Abstract
Background and Objective
We investigated the relationship among heat shock protein 70 (hsp70) promoter activation, extracellular HSP70 protein levels, and tumor cure in an animal model of meso-tetrahydroxyphenyl chlorin (mTHPC; Foscan®)-mediated photodynamic therapy (PDT).
Materials and Methods
Using Western blot analysis, we compared HSP70 protein levels in control and PDT-treated EMT6 cells with the amplitude of hsp70-promoter driven green fluorescent protein (GFP) expression in identically treated, stably transfected hsp70-GFP/EMT6 cells. A clonogenic survival assay was performed to assess the relationship among promoter activation, HSP70 levels, and cell survival in vitro. Tumor growth studies with this transfected cell line were performed to examine responses to fluences from 0.1 to 10 J cm−2, which ranged from sub-curative to curative. In vivo stereofluorescence and confocal fluorescence imaging were used to assess the temporal kinetics in hsp70 activation in tumors subjected to these fluences and the intratumor spatial correlation between hsp70 induction and extracellular levels of HSP70, respectively.
Results
Maximum GFP expression and HSP protein levels in cells were observed at PDT doses that corresponded to 30% cell survival. The relative changes in GFP and HSP70 protein accumulation as analyzed using Western immunoblots agreed very well, thereby confirming the validity of fluorescent reporter assessment of gene expression in our studies. In vivo imaging revealed that hsp70 promoter-driven GFP expression and accumulation of extracellular HSP70 in PDT-treated tumors subjected to non-curative doses exhibit minimal spatial correlation. There is a strong correlation between mTHPC-PDT doses that result in long-term tumor cure and those that cause high levels of surface exposed or extracellularly released HSP70s.
Conclusion
Treatment conditions that induce strong promoter activation do not correspond to tumor cure. PDT doses that result in long-term tumor growth control also produce significant accumulation of extracellular HSP70.
Keywords: photodynamic therapy, heat shock protein, HSP70, meso-tetrahydroxyphenyl chlorin, in vivo imaging, confocal fluorescence microscopy
INTRODUCTION
Photodynamic therapy (PDT) initiates a plethora of cellular and molecular responses, some of which have been extensively studied and documented [1–3]. PDT-induced oxidative stress increases expression of several genes as well as cellular stress proteins [4]. Among the stress proteins, heat shock protein 70 (HSP70) is the most abundant and conserved and has frequently been proposed as a potential biomarker of cellular toxicity [5,6]. The transcription and translation of HSPs, including HSP70, in response to PDT has been documented in several published reports. Mang and Dougherty [7] first reported on enhanced expression of HSP from populations of EMT6 cells subjected to dihematoporphyrin ether-PDT. Increased induction of several stress proteins, including HSP70, was observed after benzoporphyrin derivative (BPD [monoacid ring A])-PDT in vitro, but not in vivo [8]. Gomer et al. [4] examined the transcription and translation of stress genes, and reported that PDT performed on RIF-1 cells in vitro using either a chlorin (mono-l-aspartyl chlorin e6 [NPe6])- or a purpurin (tin etio-purpurin [SnET2])-based sensitizer enhanced heat shock factor (HSF) binding activity and HSP70 mRNA, and protein production. The authors also found that PDT of RIF-1 tumors with NPe6, SnET2, and porfimer sodium (Photofrin), induced enhanced HSP70 mRNA transcription [9]. Hanlon et al. [10] reported that Photofrin PDT of HT29 and RIF-1 cells in vitro resulted in an increase of HSP60 induction but attributed this increase to PDT resistance conferred by the two cell lines. In 2003, we used a mouse mammary sarcoma (EMT6) cell line stably transfected with a plasmid consisting of the gene for green fluorescent protein (GFP) under the control of an hsp70 promoter, and showed that sublethal doses of meso-tetrahydroxyphenyl chlorin (mTHPC)-PDT in vitro and in vivo induced maximum levels of hsp70 activation as reported via GFP expression [11]. A recent study by Zhou et al. [12], examined the mechanism of HSP70 translocation and the relationship between HSP70 expression and mitochondrial transmembrane potential. The authors found that within 30 minutes of a “lethal” dose of Photofrin-PDT there was a large increase of HSP70 on the surface of HeLa cells, and the mitochondrial membrane was permeabilized.
Based on the presently available literature, it is believed that intracellular expression of HSPs has cancer augmenting or pro-survival properties. In particular, intracellularly over-expressed HSPs, such as HSP70, HSP90, HSP60, or HSP27, have been shown to exhibit apoptosis-inhibitory and cytoprotective activity [13]. Surface exposure of HSPs or their extracellular release are believed to have tumor suppressing properties due to their ability to attract the attention of the innate immune system towards the tumor cells [14,15]. Recent observations have shown that PDT treatment is accompanied by not only induction but also extracellular exposure and release of HSPs that play a role in triggering the host response [16]. Jalil et al. [17] demonstrated up-regulation of HSP70, HSP90, and other stress proteins after Photofrin-PDT of mouse C26 cells and associated their expression to the activation and maturation of co-cultured immature dendritic cells (DCs), which when injected intratumorally resulted in the mounting of an effective antitumor response. In fact, Korbelik reported that signals such as HSP70 released from PDT-treated cancer cells could illicit the tumor-associated macrophages to produce complement proteins, a process mediated by the communication involving TLR2 and four receptors along with NFκB activation [18]. In a recent study, Zhou et al. showed that when tumor cells were treated with high doses of Photofrin-PDT that resulted in necrosis, HSP70 was released and could regulate macrophage activation and tumor necrosis factor-alpha (TNFα) production. However, cells treated with low PDT doses also expressed HSP70 on the cell surface but did not induce TNFα production [19]. These elegant experimental results with “non-lethal” PDT doses reinforce HSP70’s cytoprotective role, while the results with the “lethal” PDT doses support the immunological activation role of HSP70. The authors further demonstrated that TNFα production by the macrophages was significantly decreased when the interactions of HSP70 with TLR2 were obstructed, thus suggesting that HSP70 presents potent “danger signals” to the macrophages through the TLR2 receptor. Engagement of TLR2 and TLR4 driven by HSP70 is now recognized as a major route of activation of DCs and other antigen-presenting cells [20].
It is clear that specific PDT treatment conditions may create a unique environment that provides tumor antigens accompanied by “danger” signals that could assist the immune system in launching an effective host response. Although there is a family of stress proteins, the motivation behind studying the activation of HSP70 in response to PDT was based on current literature alluding to the extensive role of HSP70 as a “danger” molecule in immune potentiation [21,22]. Our present study builds on these recent observations to examine the relationships among hsp70 promoter activation, cell surface exposure or extracellular release of HSP70 and tumor response for a range of mTHPC-PDT treatment conditions that would sample both non-curative and curative doses. Traditionally, HSP70 levels in vitro and in vivo have been determined by methods such as Western blotting and in situ hybridization. To enable the study of HSP70 induction in response to PDT in individual, intact cells in culture and in an intact animal in vivo, we use stably transfected EMT6 cells in which the hsp70 promoter-driven-inducible-expression of GFP fluorescence reports the PDT-mediated stress response. The objectives of this study were to examine in an animal tumor model PDT treatment conditions that induced maximal promoter activation of hsp70 as reported via GFP, and the extent of correlation among hsp70 activation, extracellularly released HSP70, and tumor responses that ranged from non-curative to curative. Using in vivo imaging, we evaluated the role of intracellular hsp70 promoter activity and extracellular HSP70 expression in informing PDT efficacy.
MATERIALS AND METHODS
Cell Culture
A line of EMT6 tumor cells stably transfected with the plasmid pR70/GFP, in which the gene for GFP is under the control of a rat hsp70 promoter fragment, has been described previously [11]. Briefly, the pR70/GFP plasmid contains the SV40 promoter driving expression of the neo gene that confers resistance to G-418, allowing for selection of the transfected cells. A single clone exhibiting high heat-induced expression and low basal levels of GFP fluorescence was selected, and the cells derived from this clone are referred to as hsp70-GFP/EMT6.
In Vitro PDT Treatment, Cell Monolayer Imaging, and Analysis
hsp70-GFP/EMT6 cells were grown as monolayers on coverslips placed in petri dishes containing Basal Eagle Media (BME) supplemented with 10% FCS and G-418. The cells were then incubated for 24 hours with an mTHPC (Biolitec AG, Jena, Germany) concentration of 0.3 μg ml−1 at 37°C [23]. A dose ranging study established 0.3 μg ml−1 as an incubation concentration that induced minimal GFP expression over the basal level, and therefore allowed us to study the extent of hsp70 promoter induction with increasing light fluences. After incubation, the medium containing the photosensitizer was removed and replaced with fresh medium. PDT irradiation was performed on cell monolayers using 658 nm light from a diode laser (Power Technology, Alexander, AR). The 658 nm diode laser was used to take advantage of one of the main absorption bands of mTHPC, which has a peak wavelength of 650 nm with a full-width half max of ~20 nm. An irradiance of 2.5 mW cm−2 was used to deliver treatment fluences ranging from 0.1 to 2 J cm−2. Seven hours following irradiation, PDT-treated cell monolayers on coverslips were placed in a microscope coverslip dish and imaged using an inverted fluorescence microscope (Nikon TE-2000, Melville, NY). Control and mTHPC-sensitized cells that were exposed only to drug sensitization were treated identically and also imaged. GFP fluorescence was detected using an “Endow” GFP band-pass filter cube (Chroma Technology, Rockingham, VT). Cell monolayer images were obtained with a 20× objective (0.75 NA) and acquired by a 12-bit color CCD camera (RT EE; Diagnostic Instruments, Sterling Heights, MI). To account for variations in background GFP expression in control cells, coverslips containing control cells were processed in parallel with every experimental group. Throughout, fluorescence from treated cells was normalized to these control samples. The digitized images were analyzed with the NIH program ImageJ (http://rsb.info.nih.gov/ij/) and MATLAB (The MathWorks Inc., Natick, MA) using methods described earlier [11]. Briefly, the GFP expression levels are obtained by computing GFP intensities from all the GFP-positive pixels in the fluorescence image, and then dividing them by the total number of pixels within cells as calculated from the corresponding bright-field image. This allowed us to quantify GFP expression as a function of the total number of pixels corresponding to adherent cells, thereby providing a correction for varying cell numbers in different microscopic fields.
Western Blot Analysis
Seven hours following irradiation, PDT treated cells and identically handled but non-irradiated control and mTHPC-sensitized cells were washed with ice-cold Hank’s Balanced Salt Solution (HBSS), ice-cold PBS, and harvested in ice-cold lysis buffer (10 mM EDTA, 600 mM NaCl, 2% Triton X-100, 5 mM Iodoacetamide, 1 mM Tris–HCl, 4 g ml−1 aprotinin at pH 7.5), and evaluated for protein expression. Protein samples were size-separated with a sodium dodecylsulfate–polyacrylamide gel electrophoresis, transferred onto nitrocellulose membranes and blocked for 1 hour in Tris-buffered saline with 0.1% Tween 20 and 5% non-fat dry milk. Blots were probed at 4°C overnight with FITC-conjugated mouse monoclonal anti-HSP70 (clone C92F3A5, Enzo Life Sciences International, Inc., Plymouth Meeting, PA) and FITC-conjugated mouse monoclonal anti-β-actin (clone AC-15, Sigma–Aldrich, St. Louis, MO) at 1:1,000 and 1:2,500 dilution, respectively. Blots were then visualized by detecting the fluorescence emission using the Typhoon 9410 Western blotting detection system (GE Healthcare Bio-Sciences Corp., Piscataway, NJ). Intensity of fluorescence bands was analyzed using ImageJ. All experiments were performed at least three times.
Clonogenic Assay
After incubation with 0.3 μg ml−1 mTHPC for 24 hours, the hsp70-GFP/EMT6 cells were washed with HBSS twice and harvested by trypsinization. They were diluted at least 1:1 in complete media and then centrifuged to a pellet. To obtain approximately 50–100 colonies after PDT, the number of cells counted by a hemacytometer (Hausser Scientific, Horsham, PA) was adjusted for each fluence and seeded into 100-mm-diameter tissue culture dishes. Each dish was exposed to an irradiance of 2.5 mW cm−2. After irradiation, additional BME with serum was added into the dishes such that the percentage of serum was maintained at 10%. After 7–8 days, colonies were stained with 0.005% crystal violet in water and counted visually. The percentage of clonogenic survival of the mTHPC-PDT-treated cells is reported as the ratio of the plating efficiency of the treated cells to that of cells incubated with 0.3 μg ml−1 mTHPC but not irradiated.
Animal and Tumor Model
Mouse mammary hsp70-GFP/EMT6 tumors were initiated into the ear pinna of female BALB/c mice by the intradermal (ID) injection of 5 × 10⁵ cells. Animals were followed daily to track tumor growth and were fed exclusively on a chlorophyll-free diet to eliminate chlorophyll-derived fluorescence. Approximately 7–10 days after implantation when the tumors reached a volume of ~15–25 mm3 they were used for control, PDT treatment, or imaging studies.
PDT Treatment and Tumor-Response Assay
mTHPC was administered at a dose of 0.3 mg kg−1 body weight by tail vein injection [24]. Twenty-four hours later the ear tumor was irradiated with 658 nm light at an incident irradiance of 20 mW cm−2. The tumors were irradiated for a range of fluences from 0.1–10 J cm−2. After PDT, tumor dimensions along three orthogonal axes were measured daily using digital calipers. Volumes were computed assuming an approximately ellipsoidal shape with the expression, V = (4/3)πr1 r2 r3. Mice were removed from the study if the volume of the tumor reached twice the pre-treatment volume. Cures were defined as no evidence of palpable tumor 90 days after PDT. In this study, we refer to curative doses as irradiation fluences that result in 100% tumor cures, sub-curative doses represent cures >50% but <100%, and non-curative doses do not result in any tumor cures.
In Vivo Imaging and Analysis
Stereofluorescence microscopy was used to map on a macroscopic scale the spatial and temporal kinetics of intracellular hsp70 activation, as reported via GFP fluorescence levels, in the hsp70-GFP/EMT6 tumors established in the mouse ears. Imaging was performed using a Nikon fluorescence stereomicroscope (Model SMZ1500) equipped with an Xcite illumination source (EXFO, Mississauga ON, Canada). Images were acquired using a 1× objective with a 2× magnification zoom that corresponded to individual fields of view (FOV) of 9.5 mm × 7 mm. Excitation of GFP and its fluorescence collection were performed using an “Endow” GFP band-pass filter cube (Chroma Technology, Rockingham, VT). High-resolution images of 1,390 × 1,040 pixels were captured and digitized by a Photometrics 12-bit monochrome CCD camera (Cool-SNAPHQ, Roper Scientific, Inc., Trenton, NJ). The measured GFP signal acquired from the tumor regions was corrected for possible therapy-induced variations in tissue optical properties using an algorithm based on white light reflectance images of the whole ear, comprising the tumor and adjacent normal ear, for each experimental time point. To preserve constant optical properties, careful procedures were followed to keep the normal skin of the ear unexposed to the PDT treatment beam. The reflectance images were acquired with the unfiltered output of a 100 W halogen lamp from a ring fiber illuminator (Nikon Inc., Melville, NY), which provided uniform illumination of the imaged field. The reflected light was collected with the GFP bandpass filter in the detection path to ensure that the reflectance correction was performed for the same wavelength range over which the GFP emission was acquired. To account for possible confounding effects from variations in white light lamp intensity and the irregular geometry of the ear, reflectance measurements from the tumor were normalized to those from the adjacent normal ear. The reflectance image acquired prior to mTHPC administration was defined as an untreated control. The white light data at time-points up to 48 hours post-irradiation was analyzed by computing the ratio of the reflectance from tumor versus normal tissue at each time point, and normalizing it to the corresponding ratio obtained from the untreated control. As the normal tissue was not exposed to light, the reflectance measured from these regions would not exhibit any therapy-induced changes, and therefore any variations in the normalized ratio would be a consequence of optical property changes in the tumor. The GFP amplitude acquired at the corresponding time-point was then divided by the normalized ratio to correct for any changes in these optical properties. The method was confirmed in experiments using tissue-simulating phantoms that mimic the absorption and scattering properties of tissue [25]. To check the validity of our reflectance correction algorithm, phantoms comprised of 0.9% Liposyn, 1 μg ml−1 fluorescein and India ink at concentrations that ranged from 0.03 and 0.08% by volume were used.
In order to investigate microscopic-scale hsp70 promoter activation and its spatial relationship to the intratumor distribution of cell surface and/or extracellular HSP70 in response to the PDT treatments, in vivo confocal fluorescence imaging was performed. The anesthetized mouse was placed on the stage of an inverted microscope in a supine position, so that the ventral side of the ear was facing downward for imaging. Images were acquired using a 10×, 0.45 NA objective and a 100 μm-diameter pinhole, which provided an optical section thickness of approximately 6 μm as determined by fluorescence edge response measurements [26]. Images were acquired at 16 bits with a lateral resolution of 1 μm per pixel. In order to construct confocal images of the whole ear tumor, a computer-controlled motorized stage (BioPrecision2 stage, Ludl Electronics Product Ltd., Hawthorne, NY) with a linear encoder resolution of 50 nm was used. A Labview (National instruments Corp., Austin, TX) based image acquisition software allowed translation of the stage and acquisition of 800 μm × 800 μm individual fields that were stitched using ImageJ to create a mosaic with a FOV of 2.4 mm × 2.4 mm.
Extracellular and cell-surface bound HSP70 was visualized using an antibody labeling technique that we have recently reported [27]. Briefly, a 30-μl solution of 0.2 μg μl−1 phycoerythrin (PE)-conjugated anti-mouse HSP70 antibodies (clone C92F3A-5, Enzo Life Sciences) was administered ID ~2 hours prior to imaging. To image in the same optical section both intracellular hsp70 promoter activation and cell-surface/released HSP70 as reported via GFP expression and anti-HSP70-PE staining, respectively, we performed simultaneous two-color excitation of GFP and PE with 488 nm from an air-cooled argon ion laser. A 500 nm long pass filter was used to reject any 488 nm reflection in the detection path and GFP and PE emission were detected using 515/30 nm and 585/40 bandpass filters (Chroma) placed in front of their respective detectors.
Statistical Analysis
Significant differences between the treatment groups for the in vitro and in vivo experiments were ascertained with a pair-wise student’s t-test (two-sample t-test, Origin 8.0, OriginLab, Northampton, MA). A value of P < 0.05 was considered statistically significant.
RESULTS AND DISCUSSION
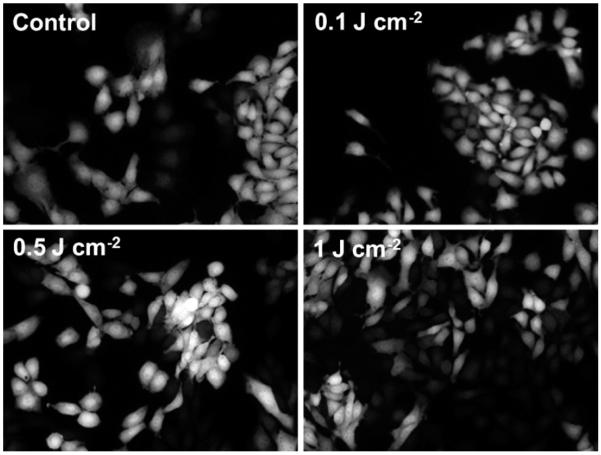
The panel of images in Figure 1 illustrates the level of hsp70 activation in the hsp70-GFP/EMT6 cells as reported by GFP fluorescence for a range of treatment fluences from 0.1 to 1 J cm−2. PDT treatment with a fluence of 0.5 J cm−2 caused a significantly higher GFP expression compared to the untreated control cells (P < 0.05). Figure 2 summarizes the extent of GFP expression for the different treatment fluences. The GFP intensities are normalized to the control. The data shows that the level of hsp70 promoter-driven GFP expression, relative to the low constitutive basal levels in control cells, was maximally induced when cells were subjected to 0.5 J cm−2 fluence, with a ~1.7-fold higher GFP amplitude. Pair-wise t-tests showed that fluorescence levels in these cells were significantly higher than in the untreated controls, mTHPC-only group and the two PDT treatment groups of 0.1 and 1 J cm−2 (P < 0.05). The GFP intensities diminished when the cells were irradiated with 1 J cm−2, and these levels were not different from control, mTHPC only and 0.1 J cm−2 irradiated cells at the P = 0.05 significance. These results are qualitatively comparable with those reported in our earlier molecular imaging study, where we established this cell line and used it to characterize the mTHPC-PDT induced hsp70 promoter activation in vitro [11]. Although the goal of the current study was to investigate the spatial and temporal kinetics of hsp70 activation in PDT-treated tumors in vivo, an important additional focus was to further characterize the cell line by examining the relationship among PDT-induced hsp70 activation as reported via GFP expression, HSP70 protein levels, and cell cytotoxicity as reported by a clonogenic cell survival assay for the range of treatment fluences.
Fig. 1.
Representative images of hsp70 promoter-driven GFP fluorescence in hsp70-GFP/EMT6 cell monolayers subjected to the following conditions: control ((−) mTHPC (−) light) and 0.3 mg ml−1 mTHPC-sensitized cells irradiated with fluences of 0.1, 0.5 and 1 J cm−2. Images were acquired ~7 hours post irradiation.
Fig. 2.
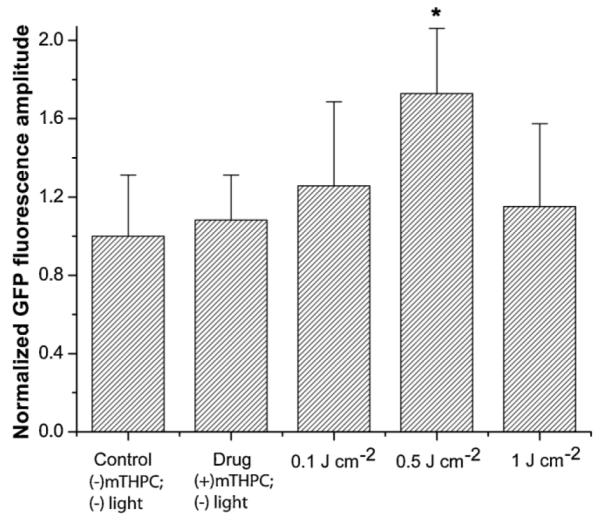
Normalized mean GFP fluorescence intensity for various treatment conditions in vitro. Error bars represent SEM. The intensities were calculated from analysis of GFP fluorescence in hsp70-GFP/EMT6 cells and normalized to those measured in untreated controls ((−) mTHPC (−) light). The maximum PDT-induced GFP expression levels were observed in cells subjected to 0.5 J cm−2. Pair-wise t-tests showed that fluorescence levels in these cells were significantly higher than in the untreated controls, mTHPC-only group and the two PDT treatment groups of 0.1 and 1 J cm−2 (*P < 0.05). The GFP levels at 1 J cm−2 were not different from control, mTHPC only and 0.1 J cm−2 irradiated cells at the P = 0.05 level of significance.
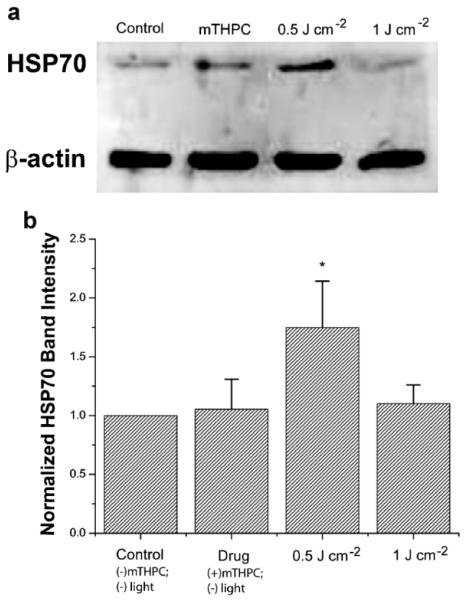
Western blot assays of protein quantification in this study were performed to test the validity of using a fluorescent reporter model system to examine the expression profile of intracellular hsp70 promoter activation in vitro and in vivo in response to PDT. In order to investigate the relationship between GFP expression and HSP70 protein levels, at 7 hours after irradiation, cells were lysed and protein extracts were analyzed by Western blotting. As shown in Figure 3a, mTHPC photosensitization induces an increase in HSP70 expression in response to 0.5 J cm−2. Figure 3b summarizes the intensity levels of the HSP70 protein bands, which were quantified by densitometry and normalized against levels of β-actin, serving as an internal loading control. Each data point is calculated from measurements performed in at least three independent samples. We observed a ~1.8-fold increase in HSP70 after 0.5 J cm−2 PDT treatment compared to both untreated cells and cells treated with mTHPC alone. The protein levels at 1 J cm−2 dropped and at the P = 0.05 significance were not different from those measured in untreated and mTHPC-only sensitized cells. This trend in HSP70 protein levels closely reproduces the pattern of PDT-mediated hsp70 promoter-induced GFP fluorescence shown in Figure 2, thereby establishing the validity of promoter-driven GFP as reporter of PDT-induced HSP expression in tumors in vivo.
Fig. 3.
a: hsp70-GFP/EMT6 cells were lysed and assayed for HSP70 protein levels using Western blotting. Actin levels were used to monitor protein loading. b: Analysis of the Western immunoblots showed increased expression of HSP70 in 0.5 J cm−2 irradiated cells with protein levels significantly higher than those extracted from untreated controls, mTHPC-only incubated cells, and 1 J cm−2 treated cells (*P < 0.05). The protein levels at 1 J cm−2 were not significantly different from those measured in untreated and mTHPC-only sensitized cells.
Figure 4 shows the measured clonogenic survival of mTHPC-PDT-treated hsp70-GFP/EMT6 cells. Each data point is a mean of at least three independent experiments. All of the data are normalized to the plating efficiency of control ((−) drug, (−) light) cells. Clonogenic survival measured in cells subjected to overnight incubation with 0.3 μg ml−1 mTHPC, but not irradiated was 98%. Survival for light-only controls ((−) mTHPC, (+) 1 J cm−2), and ((+) mTHPC, (−) light) cells were similar (data not shown). The objective of presenting the clonogenic data was to offer a qualitative interpretation for the correlation between reduced cell survival and irradiation-induced decrease in GFP at higher fluences. We find that optimal hsp70 activation reported via GFP and HSP70 protein expression are associated with in vitro treatment fluences corresponding to 30% cell survival. At the higher fluence of 1 J cm−2, the significantly lower level of GFP fluorescence and HSP70 expression correlates well with <1% cell survival. This is qualitatively consistent with our earlier findings, where we showed that reduced cell viability, measured by trypan blue exclusion assay, is responsible for the reduction in GFP intensity with increasing PDT doses [11]. Our results are in qualitative agreement with a report by Luna et al. [9], in which the authors observed that CAT expression, under the control of an hsp70 promoter in RIF cells, initially increased with increasing NPe6-PDT doses and then decreased. The authors attributed the decrease in CAT expression to the PDT cytotoxic response.
Fig. 4.
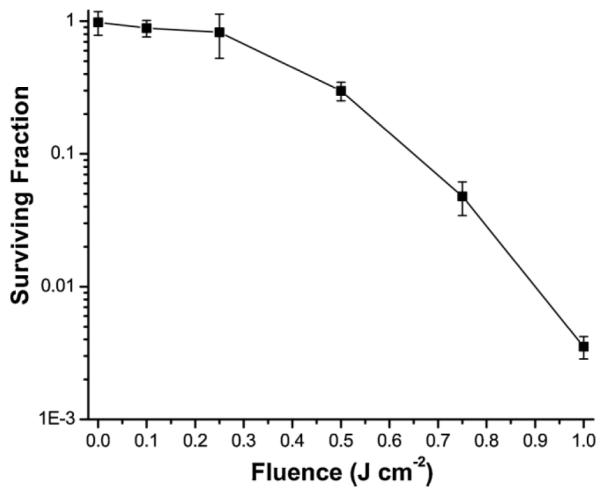
Clonogenic survival of hsp70-GFP/EMT6 cells sensitized with 0.3 μg ml−1 mTHPC for 24 hours and subjected to no light, and fluences of 0.1, 0.25, 0.5, 0.75, and 1 J cm−2. All of the data are normalized to the plating efficiency of control ((−) drug, (−) light) cells. The mTHPC only incubation and mTHPC (+) irradiation conditions resulted in surviving fractions of approximately 98, 89, 83, 30, 4.8, and 0.3%, respectively. Error bars represent standard deviation.
We next used tumor growth control to compare the therapeutic efficacy of a range of treatment protocols in BALB/c mice bearing ear tumors derived from the stably transfected hsp70-GFP/EMT6 cells. Tumors were treated when they reached ~3 mm in diameter. Tumor volume doubling was the end point used as a measure of treatment failure, and cures were defined as no evidence of tumor 90 days after PDT. The Kaplan–Meier plots of Figure 5 demonstrate that the tumor response to mTHPC-PDT was dramatically enhanced with fluences of 2 and 4 J cm−2 relative to that observed with 0.1 J cm−2. Among the eight mice treated with 4 J cm−2, 100% were cured as defined by no evidence of tumor 90 days after irradiation. Hundred percent cures was also observed in tumors treated with 10 J cm−2 (data not shown). Among the 16 mice treated with 2 J cm−2, 15 (93%) were cured. However, no cures were observed in the 0.1 J cm−2 group (n = 8), where the median tumor volume doubling time was 7 days and not significantly different from untreated controls ((−) light, (−) mTHPC), which had a median tumor doubling time of 6 days (n = 8).
Fig. 5.
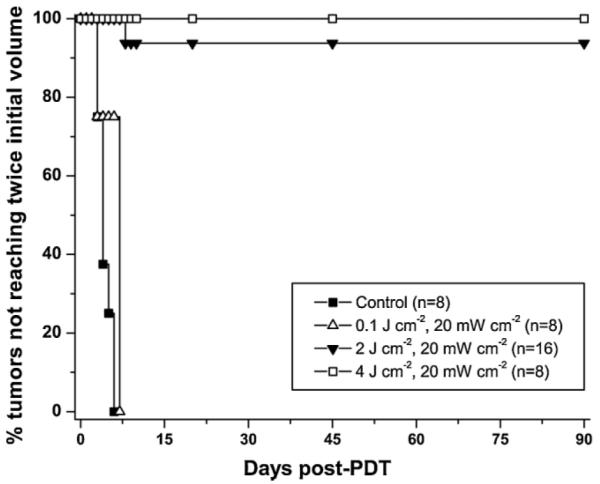
Kaplan–Meier curves of tumor responses to mTHPC-PDT. Laser irradiation at 658 nm was performed at an irradiance of 20 mW cm−2 for a range of fluences from 0.1 to 10 J cm−2 at 24 hours after intravenous administration of 0.3 mg kg−1 mTHPC. 100% cure rates were observed in mice treated with 4 J cm−2 and 10 J cm−2 (n = 5, data not shown).
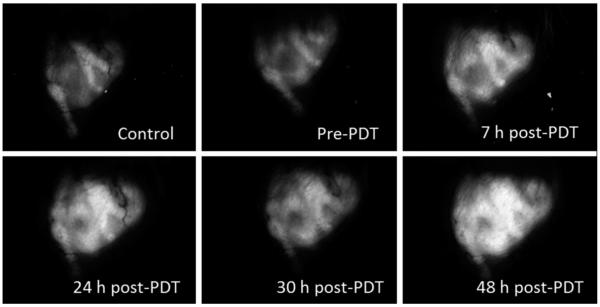
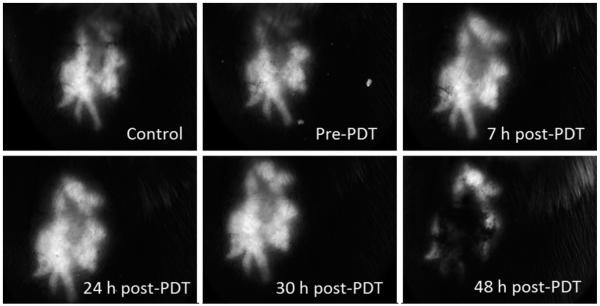
With the mTHPC-PDT treatment conditions that result in non-curative and curative tumor responses established, the stable transfection of EMT6 cells with a reporter GFP gene construct under the control of an hsp70 promoter allowed us to evaluate in vivo the response of the hsp70 promoter to these treatment protocols, using wide-field stereofluorescence and confocal fluorescence imaging. The stereomicroscope system was used for the long-term analysis and for quantification of the GFP fluorescence intensities in vivo. Shown in Figure 6 is a representative panel of images illustrating the time course of GFP expression in the same field of view (FOV) of an EMT6 tumor before mTHPC administration (control), prior to PDT irradiation (mTHPC only, no light), and at 7, 24, 30, and 48 hours after treatment with 0.1 J cm−2. The images illustrate that the expression at 7 and 24 hours post-PDT is higher than control and mTHPC-only levels. There is a slight decrease in GFP at the 30 hours time-point followed by a rebound in fluorescence at 48 hours. This phenomenon of an oscillation in GFP levels following an initial increase was observed in some but not all cases. It may be hypothesized that the initial increase in GFP expression is due to direct PDT-induced oxidative stress, and the second wave is associated with the onset of a sub-sequent insult initiated by therapy-induced perfusion deficits. This observation of oscillatory behavior in hsp70-promoter induction demonstrates the complex temporal heterogeneity of molecular responses that can be visualized, in the same animal, using a fluorescent reporter protein, such as GFP. The expression pattern of GFP as a function of time after treatment with a curative fluence of 10 J cm−2 is shown in Figure 7. Qualitatively, we observe that, unlike the 0.1 J cm−2 case where GFP signal increases after treatment and remains sustained at high levels until at least 48 hours post-PDT, GFP expression peaks at 24–30 hours time and then declines. The decrease at longer time-points is likely associated with cellular damage and lysis.
Fig. 6.
In vivo time course analysis of hsp70 promoter-driven GFP expression in an individual hsp70-GFP/EMT6 ear tumor subjected to mTHPC-PDT with 0.1 J cm−2. All images were acquired using wide-field stereofluorescence microscopy under the identical acquisition conditions as described in the Materials and Methods Section. The FOV in the images is 9.5 mm × 7 mm.
Fig. 7.
Series of stereofluorescence images illustrating hsp70-promoter driven GFP fluorescence up to 48 hours in an individual ear tumor treated with a curative fluence of 10 J cm−2. The FOV in the images is 9.5 mm × 7 mm.
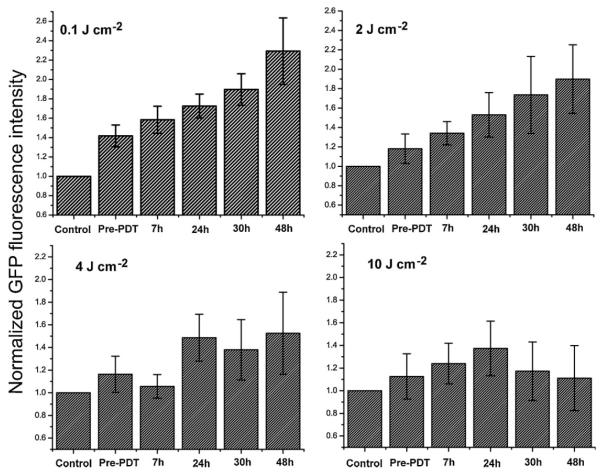
A quantitative analysis of the average fluorescence intensities in these mice at the indicated time-points for the different treatment fluences is summarized in Figure 8. The GFP levels in unsensitized tumors illuminated with irradiation fluences of 0.1–10 J cm−2 were similar to those observed in control tumors that received neither mTHPC administration nor light (data not shown). The GFP intensities in each of the plots are normalized to the value obtained from analysis of control tumors (no mTHPC, no light). The intensity of the hsp70 promoter-induced GFP levels is highest with 0.1 J cm−2, with a maximum at 48 hours. Average GFP signals at 48 hours are ~2.5-fold higher than those in untreated tumor controls. Treatment fluences of 2 and 4 J cm−2 also resulted in induction of hsp70, but the relative increase in maximum GFP fluorescence with respect to controls is more modest at ~1.8- and 1.4-fold, respectively. Consistent with the panel of images shown in Figure 6, tumors subjected to 10 J cm−2 showed a trend of initial increase in GFP expression up to 24 hours followed by a decrease. Relative to mTHPC-only tumor controls, at 24 hours the tumors irradiated with 10 J cm−2 exhibited a statistically significant (P < 0.05) increase of ~23% higher GFP fluorescence, while the levels at 48 hours were not statistically different from those in the untreated control and mTHPC-only groups. The GFP levels at 24 hours post-irradiation with 4 and 10 J cm−2 were not statistically different. The analyses of the wide-field imaging measurements in conjunction with the tumor growth control studies therefore demonstrate a lack of positive correlation between PDT-mediated hsp70 promoter activation and tumor response. Tumor treatment conditions that induce a strong and prolonged expression of a transgene, such as GFP, under the control of the hsp70 promoter do not result in tumor cures.
Fig. 8.
Quantitative analyses of GFP fluorescence intensity in hsp70-GFP/EMT6 ear tumors subjected to fluences of 0.1, 2, 4, and 10 J cm−2. For each treatment group, the mean GFP values were normalized to that obtained from control tumors, prior to mTHPC administration. Columns represent mean GFP intensities from at least eight separate experiments, and the error bars are the SEM.
It is interesting to note that 0.3 mg kg−1 mTHPC administration induced a small but significant 10–20% increase in GFP fluorescence compared to that in nonsensitized tumors. The mTHPC-induced stress response in vivo was not totally unexpected because previous studies have shown enhanced stress protein levels in two cell lines in response to Photofrin incubation alone [28]. The same authors reported increased HSF binding in response to SnET2 incubation, although minimal HSF binding and no HSP70 induction was observed after Photofrin incubation [4]. Our own studies have shown mTHPC incubation induced concentration-dependent GFP expression [11]. These varied results reported in the literature in addition to our own findings thus suggest that stress responses due to drug exposure are specific and strongly sensitizer dependent.
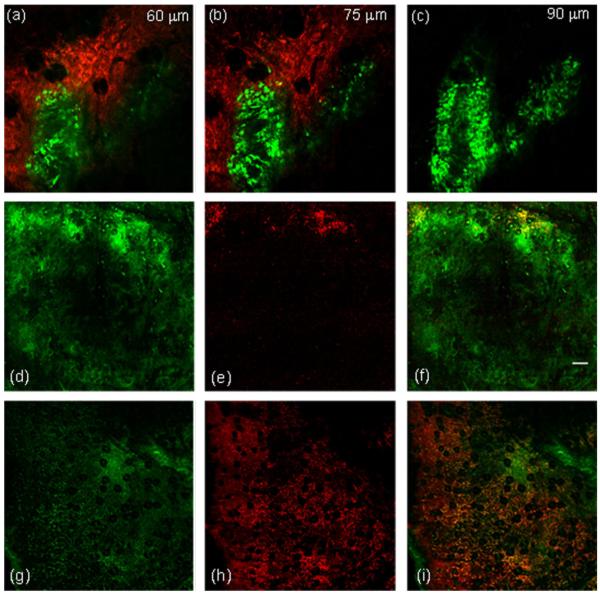
An interesting study by Korbelik et al. [29] showed that PDT induces cell surface expression and release of HSPs. The extent of the cell surface HSP70 expression was related to PDT dose, with higher doses causing increased extracellular exposure. They also found that, to a lesser degree, surface HSP70 was evident on tumor cells, in vivo and in vitro, that were subjected to lower doses and that remained viable. As extracellular and released HSPs are considered to be an important component in eliciting immune responses [14], we became interested in correlating PDT-induced hsp70 promoter activation as reported via GFP fluorescence with that of extracellular HSP70. In order to perform these experiments, we adopted an in vivo antibody labeling technique recently demonstrated by our laboratory, in which we directly injected PE-conjugated antibodies against HSP70, and were thereby able to visualize in vivo the distribution of extracellular HSP70. As noted in Materials and Methods Section, both hsp70-promoter driven GFP fluorescence and anti-HSP70-PE were excited efficiently by 488 nm light and detected simultaneously by two appropriately filtered detectors. Figure 9a–c are in vivo images obtained at three depths in the same tumor. The images are comprised of GFP (green) or PE (red) fluorescence, and were acquired 24 hours post-irradiation with the curative fluence of 4 J cm−2. The images at all three depths exhibit patterns of extracellular HSP70 accumulation that are not associated with regions of the tumor that express high levels of GFP. The panel of images in Figure 9d–i demonstrates the spatial distribution of extracellular HSP70 in relation to GFP expression for the non-curative PDT dose of 0.1 J cm−2 Figure 9(d–f) and the curative dose of 10 J cm−2 Figure 9(g–i). Each image is comprised of nine 800 μm × 800 μm individual fields, which were stitched to create a montage with a FOV of 2.4 mm × 2.4 mm, as described in the Materials and Methods Section. This ability to create large FOV mosaics of in vivo confocal images allowed us to visualize heterogeneities in extracellular HSP70 distribution. For both treatment doses, the images were acquired 24 hours post-irradiation. In Figure 9f, which is a merged image of GFP and PE-conjugated anti-HSP70, with the exception of sparse regions at the tumor boundary, there is almost complete absence of extracellular HSP70. This suggests that at this non-lethal dose of 0.1 J cm−2, even at 24 hours where hsp70 activation in these tumors is ~1.7-fold higher than in untreated controls (Fig. 8), the great majority of the tumor cells do not undergo translocation to the cell surface and/or release of HSP70. In Figure 9i, which is a merged image from a tumor irradiated with 10 J cm−2, a significantly higher degree of labeled anti-HSP70 is observed, thus indicating that at these curative doses a large fraction of the stressed cells release or expose their HSPs. Table 1 lists the approximate fraction of the total pixels that are anti-HSP70 positive for the four treatment fluences that were examined. We found that while ~7% of the pixels in the 0.1 J cm−2 treated tumors exhibited anti-HSP70 positive pixels, the corresponding numbers for 2, 4, and 10 J cm−2 were ~2-, 3-, and 6-fold higher, respectively.
Fig. 9.
In vivo two-color confocal images of hsp70 promoter-induced GFP fluorescence (green) and extracellular HSP70 (red) in an hsp70-GFP/EMT6 tumors subjected to mTHPC-PDT. Extracellular HSP70 was labeled using a PE-conjugated antibody against HSP70. a–c: Tumors irradiated with 4 J cm−2 and imaged 24 hours after irradiation. The images were acquired from the same FOV at three different tissue depths of 60, 75, and 90 μm in the tumor. The optical section thickness, the in-plane resolution, and the FOV in the image are 6 μm, 1 μm/pixel, and 800 μm × 800 μm, respectively. d–f: In vivo confocal fluorescence images of hsp70-GFP/EMT6 tumors subjected to 0.1 J cm−2 and (g–i) 10 J cm−2, and imaged 24 hours after irradiation. d and g: hsp70-driven GFP expression and (e and h) the distribution of extracellular HSP70. The merged images in (f and i) display the overlay of the GFP (green) and extracellular HSP70 (red) images. The FOV imaged in both of these tumors is 2.4 mm × 2.4 mm, constructed from a montage of nine individual 800 μm × 800 μm fields. The scale bar represents 200 μm.
TABLE 1.
Fraction of Pixels That Were Anti-HSP70 Positive in Imaged Tumor Fields Corresponding to PDT Doses From 0.1 to 10 J cm−2
| Treatment fluence (J cm−2) |
% of pixels staining positive for anti-HSP70 |
|---|---|
| 0.1 | 6.9 |
| 2 | 11.8 |
| 4 | 21.7 |
| 10 | 41.2 |
The FOVs of the analyzed images were at least 800 μm × 800 μm. Images from two tumors were analyzed for each fluence.
In summary, the in vivo imaging studies have allowed us to explore a range of mTHPC-PDT conditions and establish treatment regimes that result in the intracellular activation of HSP70 and its extracellular release. To the best of our knowledge, we have presented the first in vivo images of extracellular HSP70 in response to PDT-mediated oxidative stress. Results from in vivo wide-field and microscopic scale confocal imaging indicate that maximal and sustained activation of hsp70 promoter correspond to PDT doses that are non- or sub-curative, while conditions that lead to complete tumor cures exhibit lower levels of hsp70 promoter-induced GFP expression, and produce significant accumulation of surface-exposed or extracellular HSP70. Hsp70-driven GFP expression and accumulation of extracellular HSP70 exhibit minimal spatial correlation in tumors treated with a non-or sub-curative dose. A dichotomy exists between the effects of HSP based on its relative location, intra- versus extracellular. Findings from several studies have shown that the activation of intracellular HSP70 induces the cell’s anti-apoptotic mechanisms [30] and is anti-inflammatory [31], while extracellular HSP70 stimulates cytokine and chemokine synthesis, up-regulates co-stimulatory molecules and enhances anti-tumor surveillance [32,33]. Our finding that treatment conditions that induce maximal promoter activation of HSP70 do not result in tumor cure is therefore consistent with the cytoprotective role of activated intracellular HSP70. At higher PDT doses, the positive correlation between tumor cure and the extent of extracellular HSP70 content is also in agreement with the hypothesis that cellular necrosis causes the discharge of intracellular contents into the extracellular milieu, thereby liberating immune-stimulatory “danger” molecules such as HSPs that contribute to long-term tumor growth control.
ACKNOWLEDGMENTS
The authors are thankful to Dr. Susanna Grafe at Biolitec AG (Jena, Germany) for the gift of mTHPC. The authors also thank Ellie Roztocil and Dr. Scott Butler for their helpful suggestions on the Western blotting assay, and the Molecular Imaging Core at the University of Rochester for the gel measurements. This work was supported by National Institutes of Health grants CA68409 and CA55791 awarded by the National Cancer Institute. F.J.D.A. was supported by GM064133-2106, a Post-Baccalaureate Research Program for Minority Students (PREP) Grant from the NIH.
Contract grant sponsor: National Institutes of Health grants awarded by the National Cancer Institute; Contract grant numbers: CA68409; CA55791; Contract grant sponsor: Post-Baccalaureate Research Program for Minority Students (PREP) Grant from the NIH; Contract grant number: GM064133-2106.
Footnotes
The authors have no affiliation with or financial involvement in any organization or entity with a direct financial interest in the subject matter or materials discussed in the manuscript.
REFERENCES
- 1.Agostinis P, Berg K, Cengel KA, Foster TH, Girotti AW, Gollnick SO, Hahn SM, Hamblin MR, Juzeniene A, Kessel S, Korbelik M, Moan J, Mroz P, Nowis D, Piette J, Wilson BC, Golab J. Photodynamic therapy of cancer: An update. CA Cancer J Clin. 2011;61:250–281. doi: 10.3322/caac.20114. DOI:10.3322/caac.20114. [DOI] [PMC free article] [PubMed] [Google Scholar]
- 2.Gomer CJ, Luna M, Ferrario A, Wong S, Fisher AM, Rucker N. Cellular targets and molecular responses associated with photodynamic therapy. J Clin Laser Med Surg. 1996;14:315–321. doi: 10.1089/clm.1996.14.315. [DOI] [PubMed] [Google Scholar]
- 3.Castano AP, Demidova TN, Hamblin MR. Mechanisms in photodynamic therapy: Part two – Cellular signalling, cell metabolism and modes of cell death. Photodiagn Photodyn Ther. 2005;2:1–23. doi: 10.1016/S1572-1000(05)00030-X. [DOI] [PMC free article] [PubMed] [Google Scholar]
- 4.Gomer CJ, Ryter SW, Ferrario A, Rucker N, Wong S, Fisher AM. Photodynamic therapy-mediated oxidative stress can induce expression of heat shock proteins. Cancer Res. 1996;56:2355–2360. [PubMed] [Google Scholar]
- 5.Lindquist S, Craig EA. The heat-shock proteins. Annu Rev Genet. 1988;22:631–677. doi: 10.1146/annurev.ge.22.120188.003215. [DOI] [PubMed] [Google Scholar]
- 6.Fischbach M, Sabbioni E, Bromley P. Induction of the human growth hormone gene placed under human hsp70 promoter control in mouse cells: A quantitative indicator of metal toxicity. Cell Biol Toxicol. 1993;9:177–188. doi: 10.1007/BF00757579. [DOI] [PubMed] [Google Scholar]
- 7.Mang TS, Dougherty TJ. Time and sequence dependent influence of in vitro photodynamic therapy (PDT) survival by hyperthermia. Photochem Photobiol. 1985;42:533–540. doi: 10.1111/j.1751-1097.1985.tb01606.x. [DOI] [PubMed] [Google Scholar]
- 8.Curry PM, Levy JG. Stress protein expression in murine tumor cells following photodynamic therapy with benzoporphyrin derivative. Photochem Photobiol. 1993;58:374–379. doi: 10.1111/j.1751-1097.1993.tb09577.x. [DOI] [PubMed] [Google Scholar]
- 9.Luna MC, Ferrario A, Wong S, Fisher AM, Gomer CJ. Photodynamic therapy-mediated oxidative stress as a molecular switch for the temporal expression of genes ligated to the human heat shock promoter. Cancer Res. 2000;60:1637–1644. [PubMed] [Google Scholar]
- 10.Hanlon JG, Adams K, Rainbow AJ, Gupta RS, Singh G. Induction of Hsp60 by Photofrin-mediated photodynamic therapy. J Photochem Photobiol B. 2001;64:55–61. doi: 10.1016/s1011-1344(01)00189-0. [DOI] [PubMed] [Google Scholar]
- 11.Mitra S, Goren EM, Frelinger JG, Foster TH. Activation of heat shock protein 70 promoter with meso tetrahydroxyphenyl chlorin photodynamic therapy reported by green fluorescent protein in vitro and in vivo. Photochem Photobiol. 2003;78:615–622. doi: 10.1562/0031-8655(2003)078<0615:aohspp>2.0.co;2. [DOI] [PubMed] [Google Scholar]
- 12.Zhou F, Xing D, Chen WR. Dynamics and mechanism of HSP70 translocation induced by photodynamic therapy treatment. Cancer Lett. 2008;264:135–144. doi: 10.1016/j.canlet.2008.01.040. [DOI] [PubMed] [Google Scholar]
- 13.Volloch VZ, Sherman MY. Oncogenic potential of Hsp72. Oncogene. 1999;18:3648–3651. doi: 10.1038/sj.onc.1202525. [DOI] [PubMed] [Google Scholar]
- 14.Theriault JR, Mambula SS, Sawamura T, Stevenson MA, Calderwood SK. Extracellular HSP70 binding to surface receptors present on antigen presenting cells and endothelial/epithelial cells. FEBS Lett. 2005;579:1951–1960. doi: 10.1016/j.febslet.2005.02.046. [DOI] [PubMed] [Google Scholar]
- 15.Melcher A, Todryk S, Hardwick N, Ford M, Jacobson M, Vile RG. Tumor immunogenicity is determined by the mechanism of cell death via induction of heat shock protein expression. Nat Med. 1998;4:581–587. doi: 10.1038/nm0598-581. [DOI] [PubMed] [Google Scholar]
- 16.Garg AD, Krysko DV, Vandenabeele P, Agostinis P. DAMPs PDT-mediated photo-oxidative stress: Exploring the unknown. Photochem Photobiol Sci. 2011;10:670–680. doi: 10.1039/c0pp00294a. DOI:10.1039/c0pp00294a. [DOI] [PubMed] [Google Scholar]
- 17.Jalili A, Makowski M, Switaj T, Nowis D, Wilczynski GM, Wilczek E, Chorazy-Massalska M, Radzikowska A, Maslinski W, Biały L, Sienko J, Sieron A, Adamek M, Basak G, Mróz P, Krasnodebski IW, Jakóbisiak M, Gołab J. Effective photoimmunotherapy of murine colon carcinoma induced by the combination of photodynamic therapy and dendritic cells. Clin Cancer Res. 2004;10:4498–4508. doi: 10.1158/1078-0432.CCR-04-0367. [DOI] [PubMed] [Google Scholar]
- 18.Korbelik M. Complement upregulation in photodynamic therapy-treated tumors: Role of toll-like receptor pathway and NFkappaβ. Cancer Lett. 2009;281:232–238. doi: 10.1016/j.canlet.2009.02.049. [DOI] [PubMed] [Google Scholar]
- 19.Zhou F, Xing D, Chen WR. Regulation of HSP70 on activating macrophages using PDT-induced apoptotic cells. Int J Cancer. 2009;125:1380–1389. doi: 10.1002/ijc.24520. [DOI] [PMC free article] [PubMed] [Google Scholar]
- 20.Asea A, Rehli M, Kabingu E, Boch JA, Bare O, Auron PE, Stevenson MA, Calderwood SK. Novel signal transduction pathway utilized by extracellular HSP70: Role of toll-like receptor (TLR) 2 and TLR4. J Biol Chem. 2002;277:15028–15034. doi: 10.1074/jbc.M200497200. [DOI] [PubMed] [Google Scholar]
- 21.Multhoff G. Heat shock proteins in immunity. Handb Exp Pharmacol. 2006;172:279–304. doi: 10.1007/3-540-29717-0_12. [DOI] [PubMed] [Google Scholar]
- 22.Garg AD, Nowis D, Golab J, Agostinis P. Photodynamic therapy: Illuminating the road from cell death towards anti-tumour immunity. Apoptosis. 2010;15:1050–1071. doi: 10.1007/s10495-010-0479-7. [DOI] [PubMed] [Google Scholar]
- 23.Ball DJ, Vernon DI, Brown SB. The high photoactivity of m-THPC in photodynamic therapy. Unusually strong retention of m-THPC by RIF-1 cells in culture. Photochem Photobiol. 1999;69:360–363. doi: 10.1562/0031-8655(1999)069<0360:thpoti>2.3.co;2. [DOI] [PubMed] [Google Scholar]
- 24.Jones HJ, Vernon DI, Brown SB. Photodynamic therapy effect of m-THPC (Foscan) in vivo: Correlation with pharmacokinetics. Br J Cancer. 2003;89:398–404. doi: 10.1038/sj.bjc.6601101. [DOI] [PMC free article] [PubMed] [Google Scholar]
- 25.Finlay JC, Foster TH. Recovery of hemoglobin oxygen saturation and intrinsic fluorescence using a forward adjoint model. Appl Opt. 2005;44:1917–1933. doi: 10.1364/ao.44.001917. [DOI] [PubMed] [Google Scholar]
- 26.Bigelow CE, Conover DL, Foster TH. Confocal fluorescence spectroscopy and anisotropy imaging system. Opt Lett. 2003;28:695–697. doi: 10.1364/ol.28.000695. [DOI] [PubMed] [Google Scholar]
- 27.Cummings RJ, Mitra S, Lord EM, Foster TH. Antibody-labeled fluorescence imaging of dendritic cell populations in vivo. J Biomed Opt. 2008;13:044041. doi: 10.1117/1.2966122. [DOI] [PMC free article] [PubMed] [Google Scholar]
- 28.Gomer CJ, Luna M, Ferrario A, Rucker N. Increased transcription and translation of heme oxygenase in Chinese hamster fibroblasts following photodynamic stress or Photofrin II incubation. Photochem Photobiol. 1991;53:275–279. doi: 10.1111/j.1751-1097.1991.tb03934.x. [DOI] [PubMed] [Google Scholar]
- 29.Korbelik M, Sun J, Cecic I. Photodynamic therapy-induced cell surface expression and release of heat shock proteins: Relevance for tumor response. Cancer Res. 2005;65:1018–1026. [PubMed] [Google Scholar]
- 30.Jaattela M, Wissing D, Kokholm K, Kallunki T, Egeblad M. Hsp70 exerts its anti-apoptotic function downstream of caspase-3-like proteases. EMBO J. 1998;17:6124–6134. doi: 10.1093/emboj/17.21.6124. [DOI] [PMC free article] [PubMed] [Google Scholar]
- 31.Housby JN, Cahill CM, Chu B, Prevelige R, Bickford K, Stevenson MA, Calderwood SK. Non-steroidal anti-infl amatory drugs inhibit the expression of cytokines and induce HSP70 in human monocytes. Cytokine. 1999;11:347–358. doi: 10.1006/cyto.1998.0437. [DOI] [PubMed] [Google Scholar]
- 32.Lehner T, Bergmeier LA, Wang Y, Tao L, Sing M, Spallek R, van der Zee R. Heat shock proteins generate beta-chemokines which function as innate adjuvants enhancing adaptive immunity. Eur J Immunol. 2000;30:594–603. doi: 10.1002/1521-4141(200002)30:2<594::AID-IMMU594>3.0.CO;2-1. [DOI] [PubMed] [Google Scholar]
- 33.Srivastava P. Interaction of heat shock proteins with peptides and antigen presenting cells: Chaperoning of the innate and adaptive immune responses. Annu Rev Immunol. 2002;20:395–425. doi: 10.1146/annurev.immunol.20.100301.064801. [DOI] [PubMed] [Google Scholar]


