Abstract
In humans and experimental animals, high fat diets (HFD) are associated with risk factors for metabolic diseases, such as excessive weight gain and adiposity, insulin resistance and fatty liver. Mice lacking the glutamate-cysteine ligase modifier subunit gene (Gclm(−/−)) and deficient in glutathione (GSH), are resistant to HFD-mediated weight gain. Herein, we evaluated Gclm-associated regulation of energy metabolism, oxidative stress, and glucose and lipid homeostasis. C57BL/6J Gclm(−/−) mice and littermate wild-type (WT) controls received a normal diet or a HFD for 11 weeks. HFD-fed Gclm(−/−) mice did not display a decreased respiratory quotient, suggesting that they are unable to process lipid for metabolism. Although dietary energy consumption and intestinal lipid absorption were unchanged in Gclm(−/−) mice, feeding these mice a HFD did not produce excess body weight nor fat storage. Gclm(−/−) mice displayed higher basal metabolic rates resulting from higher activities of liver mitochondrial NADH-CoQ oxidoreductase, thus elevating respiration. Although Gclm(−/−) mice exhibited strong systemic and hepatic oxidative stress responses, HFD did not promote glucose intolerance or insulin resistance. Furthermore, HFD-fed Gclm(−/−) mice did not develop fatty liver, likely resulting from very low expression levels of genes encoding lipid metabolizing enzymes. We conclude that Gclm is involved in the regulation of basal metabolic rate and the metabolism of dietary lipid. Although Gclm(−/−) mice display a strong oxidative stress response, they are protected from HFD-induced excessive weight gain and adipose deposition, insulin resistance and steatosis.
Keywords: glutathione, high fat diet; insulin resistance; lipid metabolism; mitochondria; steatosis
Introduction
Glutathione (GSH), the most abundant non-protein thiol in mammalian cells, serves diverse cellular functions. GSH acts as an antioxidant and substrate for antioxidant enzymes, forms mixed disulfide redox couples, affects post-translational protein modification, reduces ribonucleotides and several lipid second-messengers, regulates nitric oxide signaling pathways, and influences neurotransmission (Dalton et al., 2004). GSH is synthesized by the sequential actions of rate-limiting glutamate-cysteine ligase (GCL) and glutathione synthase. In higher eukaryotes, GCL is most catalytically active as a heterodimer, comprised of a catalytic subunit (GCLC) and a modifier subunit (GCLM) (Chen et al., 2005). GCLM binding to GCLC regulates the rate of de novo GSH synthesis by decreasing the Km for glutamate and ATP, increasing the Ki for feedback inhibition by GSH, and γ-glutamylcysteine biosynthesis. Oxidative stress upregulates GCL subunits increasing the velocity of transcriptionally through the NRF2/KEAP1 signaling pathway (Kode et al., 2008), or it induces rapid GCL activation through transcription-independent association of the GCLC and GCLM subunits (Krejsa et al., 2010).
Since low levels of GSH are typically associated with diseases such as AIDS {54} and susceptibility to environmental toxicants (Smith et al., 1996), various clinical studies evaluated methods to increase blood and tissue GSH. While oral GSH is not available systemically in humans (Witschi et al., 1992), intravenous cysteine or GSH infusion elevates the levels of hepatic and renal GSH (Aebi and Lauterburg, 1992). Furthermore, oral administration of the bioavailable form of cysteine, N-acetylcysteine, increases blood and tissue levels of cysteine and GSH {54}. Thus, both genotype and dietary variables, especially amino acids such as methionine (Ronchi et al., 2010), are important in regulating GSH levels.
Both animal and human studies have shown the importance of GCLM in regulating GSH homeostasis and preventing toxicity and disease conditions (Dalton et al., 2004). This lab has generated a mouse model with ablation of the Gclm gene. These mice, and cells derived from these mice, have only 10-25% of the wild-type (WT) cellular levels of GSH, and show altered sensitivity to many environmental chemicals (Yang et al., 2002; Dalton et al., 2004). In the absence of chemical exposures, the intrinsic oxidative stress status for these mice has not been fully characterized. This is an aim of the current study.
In the course of maintaining the Gclm mouse line, we observed that Gclm(−/−) mice, when consuming breeder chow that contains about twice the energy from fat as a normal diet (ND), did not gain weight as rapidly as WT mice. Additional studies confirmed that Gclm(−/−) mice did not gain excess weight even when fed a high fat diet (HFD) in which there is a 6-fold increase in energy from fat. This finding provides the basis for the present study, which examines the roles for GCLM and GSH in oxidative stress, energy homeostasis, lipid metabolism and risk indicators for potential metabolic disorders associated with high dietary fat intake, such as insulin resistance preceding type 2 diabetes mellitus and steatosis preceding fatty liver-associated diseases.
Materials and Methods
Animals and treatment
All experiments involving mice were conducted in accordance with the National Institutes of Health standards for care and use of experimental animals as stated in Principles of Laboratory Animal Care (NIH Publication No. 85-23, revised 1985; http://grants1.nih.gov/grants/olaw/references/phspol.htm), and the University of Cincinnati Institutional Animal Care and Use Committee. Gclm(−/−) mice and WT littermate controls were bred in-house from a line previously generated and backcrossed onto a >99.8% C57BL/6J background (Yang et al., 2002). Animals were group-housed, maintained on a 12-h light/dark cycle, and had access to water ad libitum. Mice were matched by initial body weight (BW), assigned to groups, and given ad libitum a ND (AIN-93M, Research Diets, New Brunswick, NJ) containing 16.12 kJ/g diet with 1.29 kJ derived from fat. At 8 weeks of age, some female mice were transferred to a HFD consisting of AIN-93M diet with additional butterfat, producing 19.34 kJ/g diet with 7.74 kJ derived from fat. Both diets contained the same amount of protein, minerals and vitamins. Mice were killed by CO2 asphyxiation 11 weeks after starting the HFD. Blood was collected in borate-heparin buffer as described, for determination of thiols and thiol disulfides (Jones et al., 1998).
Metabolic parameters and body composition
BWs were measured and food and water consumption were estimated twice weekly. In vivo oxygen consumption and CO2 release were determined using metabolic chambers. Oxygen consumption was determined as gas consumed in the presence of soda lime to absorb CO2. CO2 release was calculated as gas consumed in the presence of, minus the absence of, soda lime. Estimates of total fat tissue, lean tissue (muscle), and water were assessed in live, unanesthetized mice by nuclear magnetic resonance (EchoMRI; EchoMedical Systems, Houston TX; http://www.echomri.com).
Intestinal lipid absorption
Intestinal lipid absorption was assessed by the University of Cincinnati Mouse Metabolic Phenotyping Core (http://mousephenotype.uc.edu/UC/LLGMeta.html). A separate group of mice was fed the HFD containing a standard amount of sucrose polybehenate (SPB), a compound structurally similar to triacylglycerol, but not hydrolyzed by intestinal lipases and not absorbed from the intestinal lumen. Lipid and SPB content in fecal samples were solvent extracted and esterified with methanolic BF3 to form fatty acid (FA) methyl esters, then analyzed by gas chromatography. The percent of dietary lipid absorbed, corrected for minor diet contamination of the feces, was calculated as [(dietary FA/SPB in diet) minus (fecal FA/SPB in feces)]/(dietary FA/SPB in diet).
Mitochondrial respiration
Mice were killed by CO2 asphyxiation. Liver was excised and mitochondria were isolated, washed, then centrifuged through a cushion of respiratory buffer (70 mM sucrose, 220 mM mannitol, 0.5 mM EDTA, 2.5 mM KH2PO4, 2.5 mM MgCl2, 0.1% bovine serum albumin, and 2 mM HEPES, pH 7.4). The mitochondrial pellet was suspended in respiratory buffer and State 3 and State 4 respiration was measured polarographically with a Clark-type oxygen electrode.
Thiols, thiol disulfides and redox potential
Thiols and thiol disulfides were determined using a Waters HPLC and a Waters Nova-Pak C18 column (3.9 mm × 150 mm; 4 μm), with mobile phases and fluorescence detection of the dansylated products at excitation335 nm and emission515 nm (Jones et al., 1998). For GSH, cysteine and homocysteine, the redox potentials (ΔE) for the RSSR/2RSH half-reactions, RSSR + 2H+ → 2RSH, were calculated as: ΔERSSR/2RSH = {ΔE0, + (RT/nF) × (actual pH − standard pH)} − {RT/nF ln ([RSH]2/[RSSR])}, where R = GSH, cysteine or homocysteine, n = number of electrons transferred, R = universal gas constant (8.31 J K−1 mol−1), T = degrees Kelvin, F = Faraday constant (9.65 Coulombs × 104 mol−1). The standard redox potentials (ΔE0,) of −240 mV for GSSG/2GSH, and −340 mV for CySS/2Cys and HcySS/2Hcy were used. For glutathione at 37°C, and assuming a cytosolic pH of 7.4, ΔEGSSG/2GSH = {−240 mV + (−61.5 mV/2e−) × (0.4)} − {(61.5 mV/2e−) × log ([GSH]2/[GSSG])]} (Dalton et al., 2004).
Glucose and glucose tolerance test
Glucose concentration was determined with a handheld glucometer (Ascensia Contour glucometer, Bayer). Aliquots of 5 μL blood from 8-hour fasted mice (fasted from midnight to 8 a.m.) were applied directly to glucose strips, between the hours of 8 a.m. and 10 a.m., to measure fasting levels of blood glucose and control for possible variability due to diurnal rhythm effects. Glucose tolerance tests were performed following an 8-h fast. After initial blood collection, 1.5 mg D-glucose/g BW was administered by i.p. injection, followed by 120 min of periodic collections of blood. Plasma insulin was measured using a radioimmunoassay employing guinea pig anti-insulin serum with high affinity for rodent insulin (Elder et al., 2006).
Quantification of hepatic lipid
Hepatic lipid was evaluated by gravimetric and histological procedures. For gravimetric analysis, total nonpolar and polar lipids were extracted from a portion of the liver with CHCl3:MeOH (2:1, v/v) (2h, dark, 4°C). MgCl2 (2 vol of 1 mM) was added, mixed, and centrifuged at 1,500g for 15 min. The lower CHCl3 phase was treated with anhydrous Na2SO4, dried under argon, and the residue dissolved in 250 μL diethyl ether. Acetone (5 mL) was added, and the mixture stirred at 4°C to precipitate phospholipids. After centrifugation, the supernatant (containing nonpolar lipids) was removed, and both supernatant and pellet (containing phospholipids) were separately dried under argon and weighed. For histological determination of the number and size of lipid droplets, 5 μm sections of liver were stained with H&E, photographed at 100X magnification and saved as TIFF images. The size and number of lipid droplets per unit area were calculated from several randomly selected fields per mouse, utilizing Image J version 1.44 software (http://rsb.info.nih.gov/ij/).
Other assays
Hepatic GSH peroxidase (GPX1) (Günzler and Flohé, 1985) and GSSG reductase (GSR) (Mulherin et al., 1996) activities were quantified as described. For heme oxygenase (HMOX1), liver tissue was homogenized on ice in 50 mM Tris-HCl buffer containing 0.5% Triton X-100 (pH 7.4). After centrifugation at 10,000g, 100 μL supernatant (containing biliverdin reductase) was mixed with 1 mL 10 mM NADPH, 10 mM MgCl2, and 2.5 mM hemin, at 37°C in the dark. After 30 min, the reaction was terminated by the addition of 1 mL chloroform. After centrifugation, bilirubin absorbance(463-520 nm) was determined in the supernatant and compared against bilirubin standards. Control assay samples did not contain NADPH. Membrane fluidity (fluorescence anisotropy) of red blood cells was assayed as described (Shertzer et al., 1991) utilizing the membrane interior lipid bilayer probe 1,6-diphenyl-1,3,5-hexatriene (DPH) and the membrane surface probe 1-(4-trmethylammoniumphenyl-6-diphenyl-1,3,5-hexatriene p-toluenesulfonate (TMA-DPH). The enzyme activity for segments of the mitochondrial respiratory chain were assayed as described (Shertzer et al., 2006). H2O2 was monitored at 37°C in freshly-prepared mitochondria as 5 μM luminol (5-amino-2,3-dihydro-1,4-phthalazinedione) chemiluminescence that was inhibited by 500 U/ml catalase, utilizing the substrates 6 mM succinate or 3 mM malate + 3 mM glutamate, under ADP-limited conditions (state 4) (Senft et al., 2002). Hemoglobin (Hgb) and metHgb were quantified spectrophotometrically (Winterbourn, 1985), and mean corpuscular hemoglobin concentration (MCHC) was calculated from hematocrit (Hct) and Hgb. Protein was measured by the bicinchoninic acid method (Pierce Chemical Co.; Rockford, IL).
RNA isolation and microarray analysis
Liver was removed, quickly rinsed in ice-cold RNase-free PBS, flash-frozen in liquid N2 and stored at −80°C. Frozen tissue (~50 mg) was homogenized in Tri Reagent™ (Molecular Research Center, Inc., Cincinnati, OH U.S.A.) and RNA was isolated from the homogenate per the manufacturer’s protocol. Total RNA quantity and quality were assessed by absorbance(260 nm) and absorbance ratios of 260/280 nm and 260/230 nm ratios, respectively, utilizing Agilent Bioanalyzer/Nanodrop analysis (Agilent 2100 Bioanalyzer). RNA samples (n=4 per treatment group) with absorbance(260/280) ratios ≥ 2.0 were used for microarrays and qRT-PCR. RNA samples were labeled by reverse transcription and competitively hybridized to microarrays of labeled cDNA targets with two dye flips per group (http://microarray.uc.edu/). Microarray data were analyzed online using the NIH National Institute for Allergy and Infectious Diseases program DAVID v6.7 (Database for Annotation, Visualization and Integrated Discovery) (http://david.abcc.ncifcrf.gov/).
cDNA synthesis and quantitative real-time PCR (qRT-PCR)
cDNA synthesis was performed using an RNA-to-cDNA kit (Applied Biosystems). Synthesis of cDNA was carried out using 0.5 μg total RNA; qRT-PCR was performed on an MJ Opticon (Bio-Rad, Hercules, CA) using SYBR Green 2X RT-PCR master mix (Bio-Rad) with a total reaction volume of 20 μL. Thermocycling parameters were: 95°C for 3 min followed by 40 cycles of 95°C for 30 s, 55°C for 60 s, 72°C for 60 s, followed by data collection at the end of each cycle. Primer sequences and Amplicon size [base pairs] were: fatty acid synthase (Fasn; F5′-CCTGGATAGCATTCCGAACCT, R5′-AGCACATCTCGAAGGCTACACA [122]), elongation of long chain fatty acids-6 (Elovl6; F5′-GCGCTGTACGCTGCCTTTAT, R5′-GCGGCTTCCGAAGTTCAAA [76]), steroyl-CoA desaturases-1 and -2 (Scd1/2; F5′-CAACACCATGGCGTTCCA, R5′-GGTGGGCGCGGTGAT [59]), sterol regulatory element-binding protein-1 and -2 (Srebf1; F5′-CCAGAGGGTGAGCCTGACAA, R5′-AGCCTCTGCAATTTCCAGATCT [72] and Srebf2; F5′-GCGGACAACACACAATATCATTG, R5′-TGACTAAGTCCTTCAACTCTATGATTTTG [80]), peroxisome proliferator-activated receptor alpha (Ppara; F5′-TGGTTCCTGGTGCCGATTTA, R5′-ACTAGCATCCCACTTAATTATGTATCTGAA [99]), peroxisome proliferator-activated receptor gamma coactivator-1-alpha (Ppargc1a; F5′-TATGGAGTGACATAGAGTGTGCT, R5′-CCACTTCAATCCACCCAGAAAG [134]) and 18S mRNA (F5′-CGGCTACCACATCCAAGGAA, R5′-GCTGGAATTACCGCGGCT [201]). Primer sequences were confirmed to be specific for the target gene by using a basic local alignment search tool (PRIMER-BLAST; http://blast.ncbi.nlm.nih.gov/Blast.cgi). All reactions were performed in duplicate with a minimum of three independent replicates, and gene expression values were calculated using the difference in target gene expression relative to 18S mRNA utilizing the 2−ΔΔct method (Livak and Schmittgen, 2001).
Statistics
Statistical significance of the differences between group sample mean values was determined by either a one-way ANOVA (genotype), or a two-way ANOVA (genotype and diet), followed by the Student-Newman-Kuels test for pairwise comparison of means. Potential interactions between the primary variables, genotype and diet, were also evaluated. Comparison of the rates of BW gain was evaluated using Friedman repeated measures ANOVA on ranks, with Tukey pairwise multiple comparison. GO and KEGG pathway differences were considered significant with FDR < 0.05. Statistics were performed using SigmaStat Statistical Analysis software (SPSS Inc., Chicago, IL).
Results
BW gain, body composition and systemic energy metabolism
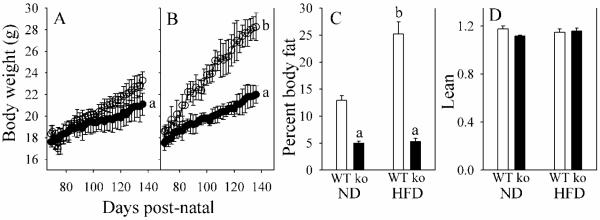
We measured BW gain and evaluated body composition in Gclm(−/−) and WT mice fed either a ND or HFD for 11 weeks. For ND-fed mice (Fig. 1A), WT mice gained 0.079 g/d (r2=0.956), while Gclm(−/−) mice gained 0.046 g/d (r2=0.959). For HFD-fed mice (Fig. 1B), WT mice gained 0.150 g/d (r2=0.983), while Gclm(−/−) mice gained 0.061 g/d (r2=0.983). BW changes were correlated with changes in body fat (Fig. 1C). Because lean body mass (Fig. 1D) and body water (data not shown) did not differ between groups, increase in adipose as storage fat was concluded to be the primary cause for BW gain in HFD-fed WT mice. Neither food nor water consumption, nor intestinal lipid absorption, could explain the lack of gain in BW and storage fat in HFD-fed Gclm(−/−) mice. For all groups, daily food and water consumption was 247-257 kJ/100 g BW, and 33-36 mL/kg BW, respectively. Dietary lipid absorption was 93.6% ± 2.3% for WT mice and 91.3% ± 2.9% for Gclm(−/−) mice.
Fig. 1. Body weight (BW) and body composition in WT and Gclm(−/−) mice.
BW gains are shown for WT (open circles) and Gclm(−/−) (closed circles) mice consuming a normal diet (A) or a HF diet (B). The percent body fat (C) and lean BWs (D) after 11 weeks of treatment for WT mice (open bar) and Gclm(−/−) mice (ko; closed bar), consuming a normal diet (ND), or a HF diet. Lean is calculated as (g BW – g body fat)/g body water.
Data are shown as mean values ± SE (n=8).
aDifferent mean value due to genotype (same diet) (p <0.05).
b Different mean value due to diet (same genotype) (p <0.05).
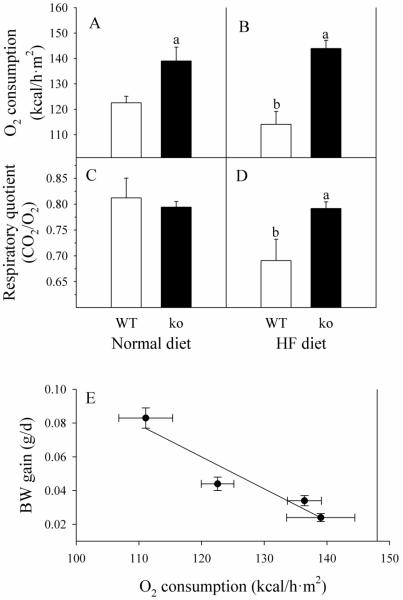
Because basal metabolic rate (BMR) is an important factor in determining the rate of energy storage, we measured O2 consumption and CO2 release to calculate systemic respiration parameters. WT mice consumed less O2 on the HFD than on the ND (111 ± 4 versus 123 ± 3 kcal/h·m2), respectively (Fig. 2A-B). Gclm(−/−) mice, in contrast to WT mice, have a higher BMR, which is not affected by the diet formula (139 ± 5 kcal/h·m2 for ND, versus 136 ± 3 kcal/h·m2 for HFD). Furthermore, HFD reduced the respiratory quotient (CO2 release/O2 consumption) in WT mice from 0.81 ± 0.04 to 0.69 ± 0.04, indicating a switch from balanced metabolism to fat as the major energy source (Fig. 2C-D). There was no difference between respiratory quotient in Gclm(−/−) mice fed ND (0.79 ± 0.01) or HFD (0.80 ± 0.02), suggesting that Gclm(−/−) mice fed HFD did not utilize the excess dietary fat for energy metabolism. We also examined the relationship between BMR and the rate of BW gain. A highly significant first-order inverse correlation exists, with r2 = 0.906 (Fig. 2E).
Fig. 2. Systemic respiration in WT and Gclm(−/−) mice.
WT (open bars) and Gclm(−/−) (ko; closed bars) mice received ND (A and C), or HF diet (B and D). O2 consumption and CO2 production were measured in non-fasted mice. Data are shown as mean values ± SE (n=8). The linear regression of BW gain on systemic oxygen consumption (E) has a slope of −0.0019 (g/d)/(kcal/h·m2) and an r2 = 0.906.
a Different mean value due to genotype (same diet) (p <0.05).
b Different mean value due to diet (same genotype) (p <0.05).
Hepatic mitochondrial respiration and mitochondrial release of H2O2
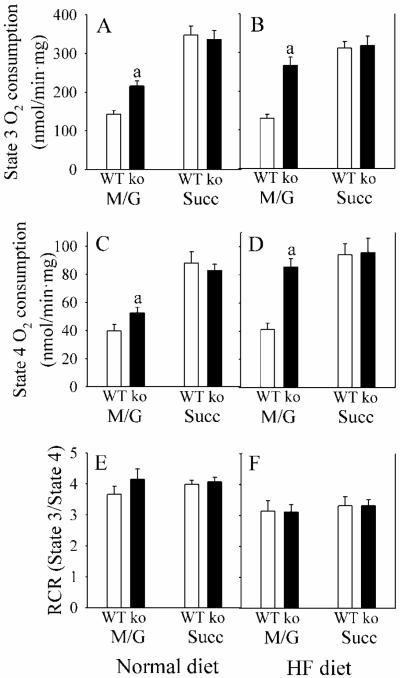
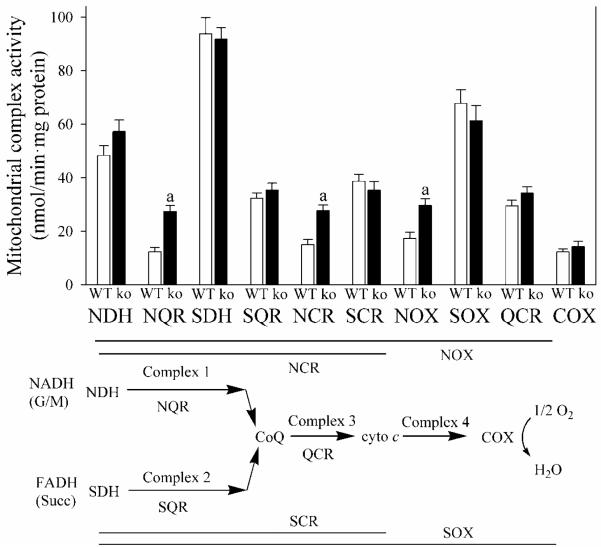
In order to determine the cause of the increase in BMR in Gclm(−/−) mice, we examined mitochondrial respiration in liver. For both states 3 and 4 (ADP-limited) respiration, mitochondrial rates for O2 consumption with NADH-dependent substrates, such as malate and glutamate, are typically less than half the rates utilizing FAD-dependent substrates, such as succinate (Fig. 3A, B), indicating that the NADH dehydrogenase complex 1 is rate-limiting in mitochondrial respiration. Under every condition, states 3 and 4 respiration change proportionally (Fig. A-D), such that energy coupling is the same with malate + glutamate as with succinate (Fig. 3E, F). Hepatic mitochondria from Gclm(−/−) mice displayed an increase in malate + glutamate-dependent, but not succinate-dependent, respiration (Fig. 3A). The site for this increase in mitochondrial respiration in Gclm(−/−) liver mitochondria (i.e., the rate-limiting subunit(s) for electron transport within complex 1) is located specifically after NADH dehydrogenase (NDH) and before coenzyme Q (Fig. 4). Microarray results did not reveal any significant change in hepatic expression for 37 nuclear-encoded complex 1 subunit genes in Gclm(−/−) mice.
Fig. 3. Liver mitochondrial respiration in WT and Gclm(−/−) mice.
Mitochondrial respiration from liver of WT (open bars) and Gclm(−/−) (ko; closed bars) mice, receiving ND, was measured under State 3 (with 0.4 mM ADP) and State 4 (ADP-limited) conditions. The substrates 3 mM malate + 3 mM glutamate (M/G), or 6 mM succinate (Succ) were used. The respiratory control ratio (RCR) was calculated as State 3/State 4.
Data are shown as mean values ± SE (n=8).
a Different mean value from WT (p <0.05).
Fig. 4. Activity of mitochondrial respiratory complex subunits.
Enzyme activity of the mitochondrial respiratory chain from livers of WT (open bars) and Gclm(−/−) (ko; closed bars) mice, receiving ND, was measured for different segments [NDH, NADH dehydrogenase; NQR, NADH-coenzyme Q oxidoreductase; SDH, succinate dehydrogenase; SQR, succinate-coenzyme Q oxidoreductase; NCR, NADH-cytochrome c oxidoreductase; SCR, succinate-cytochrome c oxidoreductase, NOX, NADH oxidase; SOX, succinate oxidase; QCR, coenzyme Q-cytochrome c oxidoreductase; COX, cytochrome c oxidase].
Data are shown as mean values ± SE (n=4 mice).
a Different mean value from WT (p <0.05).
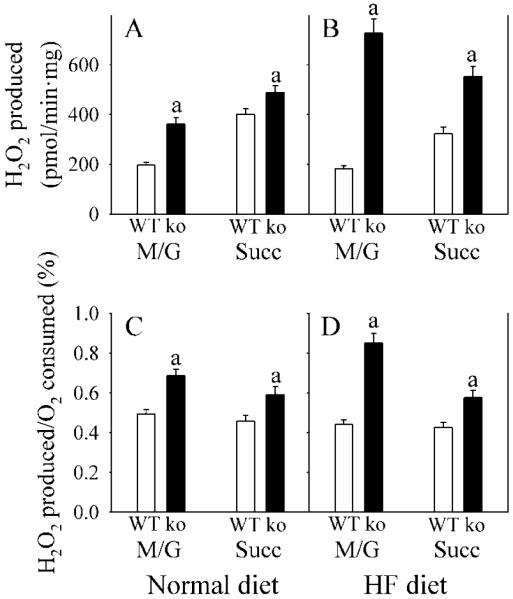
Because mitochondrial complexes 1 and 3 are major sources of reactive oxygen production, we evaluated this parameter utilizing substrates for complex 1 (NADH-linked substrates malate + glutamate) and complex 2 (FADH-linked substrate succinate). Compared with WT mice, Gclm(−/−) mice generated more H2O2 with both substrates (Fig. 5). However, the increase was greater with malate + glutamate than with succinate, and was most pronounced in mice consuming the HFD.
Fig. 5. Mitochondrial H2O2 production.
WT (open bars) and Gclm(−/−) (ko; closed bars) mice received ND (A and C), or HF diet (B and D). H2O2 production was determined in liver mitochondria from WT (open bars) and Gclm(−/−) (ko; closed bars) under state 4 conditions utilizing succinate (Succ) or malate + glutamate (M/G) substrates. H2O2 production was normalized to protein (A and B), or to oxygen consumption (C and D).
Data are shown as mean values ± SE (n=4 mice).
a Different mean value from WT (p <0.05).
Oxidative stress and thiol status
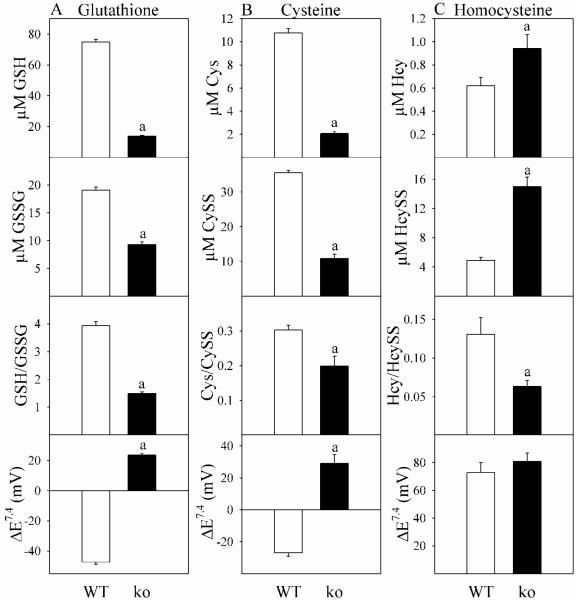
Although GSH status for these Gclm(−/−) mice has been reported previously (Yang et al., 2002; Dalton et al., 2004), biological thiol redox signaling involves not only GSH, but cysteine (Cys) and homocysteine (Hcy) as well (Jones, 2006; Giustarini et al., 2011). In Gclm(−/−) mice, relative to WT, decreases in plasma levels of GSSG and cystine (CySS) were proportionately less than decreases in GSH and Cys, respectively (Fig. 6A-B). This imbalance produced decreases in GSH/GSSG and Cys/CySS, and resulted in positive thiol reduction potentials (more oxidized thiol redox states). Hcy behaved quite differently (Fig 6C). Gclm(−/−) mice showed elevated plasma levels of Hcy, with even greater increases in HcySS, such that the Hcy/HcySS ratio was significantly decreased and ΔEHySS/2Hcy was unchanged.
Fig. 6. Plasma thiols and thiol redox potentials in WT and Gclm(−/−) mice.
Thiols and thiol disulfides were assayed in plasma from WT (open bars) and Gclm(−/−) (ko; closed bars) mice receiving ND. Column A is glutathione-related parameters, column B is cysteine-related parameters, and column C is homocysteine-related parameters. Nonstandard abbreviations used are CySS, cys disulfide; Hcys, homocysteine; HcySS, homocysteine disulfide. Data are shown as mean values ± SE (n=4 mice).
a Different mean value from WT (p <0.05).
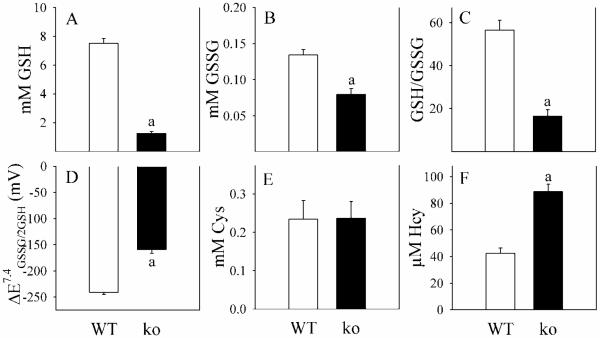
We also evaluated hepatic thiols, where glutathione changes in Gclm(−/−) mice roughly mirrored those in blood, with a disproportional decrease in GSH relative to GSSG (Fig. 7A-B), such that GSH/GSSG ratios were reduced by two-thirds (Fig. 7C) and ΔEGSSG/2GSH was less negative (Fig. 7D). Liver tissue concentrations of CySS and HcySS were not detectable (<10 μM). These observations are in agreement with the concept that circulating thiols are primarily exported from the liver.
Fig. 7. Hepatic thiols in WT and Gclm(−/−) mice.
Thiols and thiol disulfides were assayed in liver from WT (open bars) and Gclm(−/−) (ko; closed bars) mice. Cys and Hcy disulfides were below the level of detection.
Data are shown as mean values ± SE (n=4 mice).
a Different mean value from WT (p <0.05).
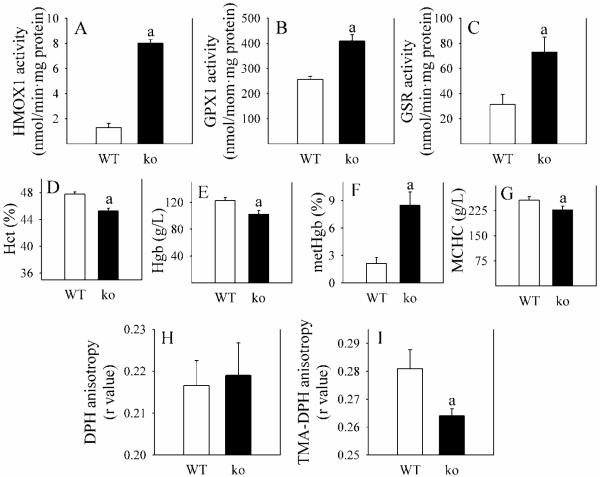
Accompanying the more oxidized thiol redox state in Gclm(−/−) relative to WT mice is a strong systemic oxidative stress response, evident by increases in activity of hepatic antioxidant enzymes heme oxygenase-1 (HMOX1), glutathione peroxidase-1 (GPX1) and glutathione reductase (GSR) (Fig. 8A-C), the gene expression levels of which are regulated by the oxidative stress-responsive transcription factor NRF2. Biochemical changes in red blood cells (RBCs) also reflect the systemic oxidative stress. In Gclm(−/−) mice, Hct, Hgb and MCHC (Fig. 8D, E, G) are decreased, while metHgb is increased 3.5-fold (Fig. 8F). Furthermore, whereas fluidity of the RBC lipid bilayer is not changed in Gclm(−/−) mice (Fig. 7H), fluidity at the surface (Fig. 8I) is increased (decrease in the r value). This finding suggests the occurrence of oxidation of surface lipids or proteins in these cells.
Fig. 8. Parameters of oxidative stress in WT and Gclm(−/−) mice.
Several parameters of oxidative stress were determined in WT (open bars) and Gclm(−/−) (ko; closed bars) mice receiving ND. Panels A-C depict the activity of hepatic enzymes induced by oxidative stress. Panels D-G indicate changes in red blood cell (RBC) numbers, Hgb and metHgb content, and mean corpuscular hemoglobin concentration (MCHC). The bottom two panels show RBC membrane fluidity in the interior of the membrane (H) and at the surface (I).
Data are shown as mean values ± SE (n=4 mice).
a Different mean value from WT mice (p <0.05).
Glucose homeostasis and steatosis
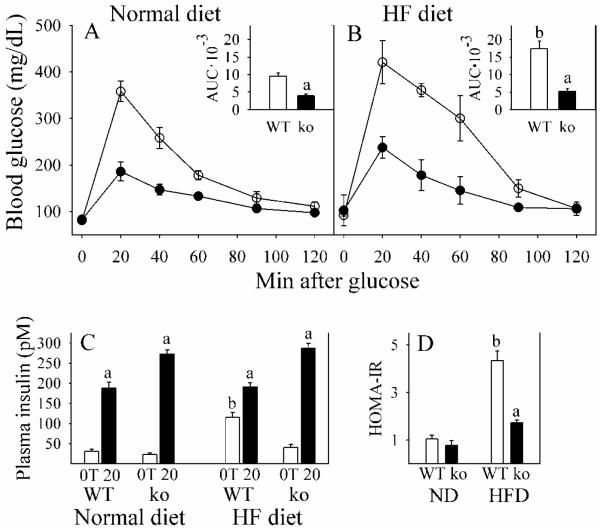
A number of physiological and biochemical changes that occur in Gclm(−/−) mice (oxidative stress, low GSH and elevated Hcy levels) are considered to be risk factors for type 2 diabetes and fatty liver diseases. Therefore, we evaluated glucose homeostasis and hepatic lipid content, expecting to find that the Gclm(−/−) mice were glucose intolerant and steatotic. To the contrary, we found that Gclm(−/−) mice on a ND had improved glucose tolerance over WT littermates (Fig. 9A). When placed on the HFD, WT mice exhibited reduced glucose tolerance, while Gclm(−/−) mice remained highly glucose tolerant (Fig. 9B). Similarly, whereas HFD increased fasting plasma insulin and caused insulin resistance (expressed as homeostasis model assessment of insulin resistance, HOMA-IR) in WT mice, Gclm(−/−) mice were resistant to HFD-induced changes in insulin homeostasis (Fig. 9C-D). Furthermore, glucose-stimulated plasma insulin levels were higher in Gclm(−/−) mice than WT mice (Fig. 9C).
Fig. 9. Glucose tolerance and insulin homeostasis in WT and Gclm(−/−) mice.
Blood glucose was determined after an 8-h fast for WT (open circles) and Gclm(−/−) (ko; closed circles) mice consuming a normal diet (A) or a HF diet (B) for 11 weeks. After the fast, zero time (0T) samples of plasma were taken for glucose and insulin assays. Glucose (1.5 mg/g BW) was then given i.p. and blood glucose concentration measured over the next 120 min. The inserts in A and B show the calculated area-under-the-curves (AUC) for each curve, in units of mg glucose/dL·min·10−3. Plasma insulin (C) levels are shown for 0T (open bars) and 20 min after glucose administration (20; closed bars). Fasted plasma insulin and blood glucose were used to calculate insulin resistance (D) as HOMA-IR (Homeostasis model assessment of insulin resistance), calculated as (μU insulin/mL plasma)·(mg glucose/dL blood).
Data are shown as mean values ± SE (n=8).
a Different mean value due to genotype (same diet) (p <0.05).
b Different mean value due to diet (same genotype) (p <0.05).
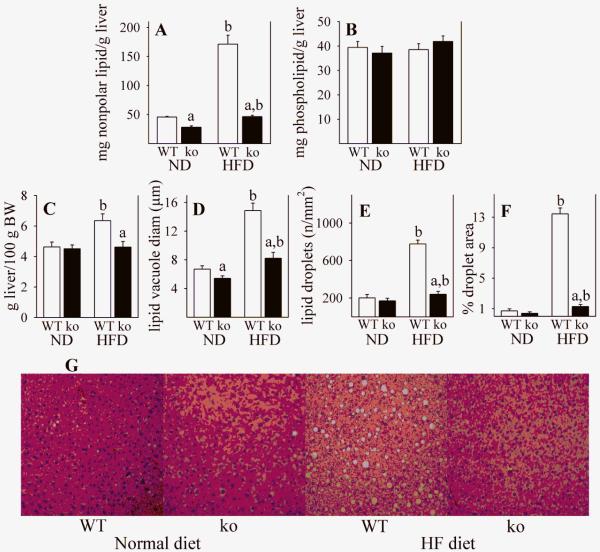
We evaluated hepatic lipid accumulation by gravimetric analysis following lipid extraction, and also by histology and morphometric analysis. Whereas HFD produced an almost 4-fold increase in nonpolar lipid content (primarily triglycerides) in WT mice, only a small increase was observed in Gclm(−/−) mice (Fig. 10A). There were no differences seen between any experimental groups in the liver content of phospholipids (Fig. 10B), which are primarily membrane components and do not contribute to fatty liver. Morphometric analysis of liver histology supported the gravimetric data, in that HFD-mediated steatosis occurred in WT mice but not in Gclm(−/−) mice (Fig. 10G). In WT mice, HFD caused a 37% increase in liver weight (Fig. 10C), attributable in large part to a 2-fold increase in lipid vacuole diameter (Fig. 10D), and a 4-fold increase in number of lipid droplets (Fig. 10E), which resulted in a 19-fold increase in hepatic lipid (Fig. 10F). In contrast, HFD caused no change in liver weight and relatively small amounts of lipid accumulation in Gclm(−/−) mice (Fig. 10C-F).
Fig. 10. Hepatic lipids in WT and Gclm(−/−) mice.
Liver lipid content was determined in WT (open bars) and Gclm(−/−) (ko; closed bars) mice consuming a ND or a HFD. Gravimetric analysis is shown for nonpolar lipids (A) and for more polar phospholipids (B). Liver weights are shown in panel C, and hepatic lipid droplets were quantified by histology and imaging. Percentage of tissue area containing lipid droplets (F) was calculated from lipid droplet size (D) and lipid droplet number (E). Representative images of H&E-stained liver sections (G) from which the lipid data (D-F) were calculated. Data (A-F) are shown as mean values ± SE (n = 4).
a Different mean value due to genotype (same diet) (p <0.05).
b Different mean value due to diet (same genotype) (p <0.05).
Lipid metabolism in Gclm(−/−) mice
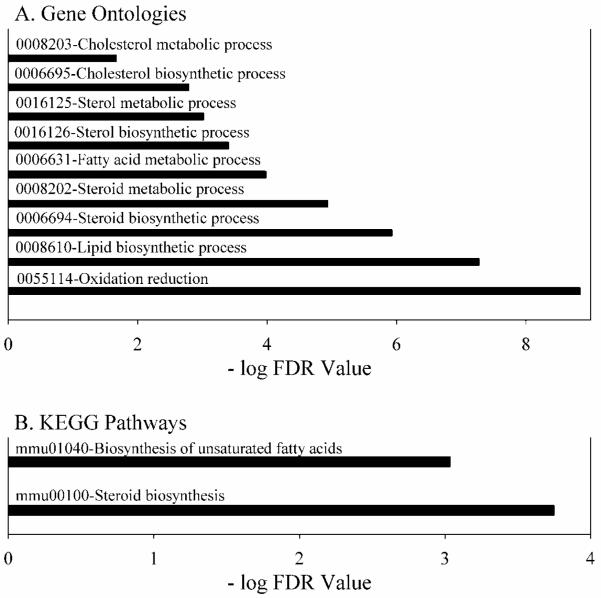
In order to gain insight into why Gclm(−/−) mice did not exhibit excess fat storage and steatosis when consuming a HFD, we performed gene expression analysis. Relative to WT mouse liver, the expression levels for lipid metabolism genes were strikingly down-regulated in Gclm(−/−) mouse liver (Fig. 11 A-B). Based on microarray data, we confirmed by qRT-PCR that several hepatic genes controlling rates of lipid biosynthesis are down-regulated. Gclm(−/−) mice were extremely deficient in Fasn expression (3% of WT), Elovl6 (6% of WT), Scd1/2 (17% of WT), Srebf1 (14% of WT), Srebf2 (9% of WT), Ppara (16% of WT), and Ppargc1a (29% of WT).
Fig. 11. Gene Ontologies and KEGG pathways down-regulated in liver from Gclm(−/−), compared with WT mice.
Liver gene-array analyses were performed in WT and Gclm(−/−) mice consuming a ND. Gene ontology (GO) and Kyoto Encyclopedia of Genes and Genomes (KEGG) pathways were identified by National Institute of Allergy and Infectious Diseases DAVID (Database for Annotation, Visualization and Integrated Discovery) Bioinformatics Resources 6.7 (http://david.abcc.ncifcrf.gov/), and ranked according to the false discovery rate (FDR). Pathways with an FDR of <0.05 are shown.
Statistical evaluation of possible interactions between genotype and diet
In performing the two way ANOVAs, we examined possible interactions between the primary variables, genotype and diet. For each case where both primary variables are present, the effect of different values observed for Gclm(−/−) mice does not depend on the diet, indicating that there is not a statistically significant interaction between genotype and diet. Since diet did not alter the values obtained for Gclm(−/−) mice, but did for WT mice, then the Gclm(−/−) genotype is dominant over the HFD for the data described in this paper.
Discussion
Changes in lipid, protein and carbohydrate storage depend only on energy inflow minus energy outflow. A positive balance typically results in an increase in fat storage. While diet and exercise contribute to the energy balance, there are countless animal and environmental variables that factor into the equation on both sides. The C57BL/6 mouse has proven to be a valuable rodent model for diet-induced obesity, and associated metabolic disorders (Matsuzawa-Nagata et al., 2008). The Gclm(−/−) mouse on the C57BL/6 background likewise has been a useful model to evaluate the etiological and regulatory role for GSH on toxicological, pharmacological and clinically-relevant disease processes in humans. Plasma GSH levels in WT Gclm(+/+), Gclm(+/−), and Gclm(−/−) mice are 62-75 μM, 30 μM and 10-14 μM, respectively ((Dalton et al., 2004), and this paper). Plasma levels in humans have extreme ranges, estimated at 18 ± 6 μM (range = 3-38 μM) (Look et al., 1997), 5 ± 2 μM (range = 2-12 μM) (Morrison et al., 1999), 3 ± 2 μM (range = 1-6 μM) (Michelet et al., 1995), and 3 ± 2 μM (range = 1-12 μM (Flagg et al., 1993). Thus, GSH plasma levels in WT, Gclm(+/−), and Gclm(−/−) mice are well within the range of levels found in human populations. Hence, the Gclm(−/−) phenotype described in this paper may be clinically relevant.
The Gclm(−/−) mouse manifests a lean phenotype even when consuming a HFD. Since the phenotype cannot be explained by differences in energy intake or intestinal lipid absorption, we focused on energy utilization. The highly significant and correlative relationship between oxygen consumption and rates of BW gain suggests that BMR, under the conditions of the present study, is the major determinant for increases in body mass. This does not diminish the potential importance of other factors, especially energy expenditure variation due to activity and body temperature. The increase in BMR in Gclm(−/−) mice is reflective of an increase in mitochondrial respiration, due to the increase in rate-limiting complex 1. We found no change in the expression of 37 nuclear-encoded subunit proteins for complex 1 represented on the microarray chip. One possibility for the enhanced activity of mitochondrial complex 1 in Gclm(−/−) mice may be due to the upregulation of mitochondrial genes encoding rate-limiting complex 1 proteins, such as MT-ND1/2/3/4/4L/5/6. Another possibility is a post-transcriptional or post-translational activation of complex 1 subunits. It appears that both complexes 1 and 3 are major sources of reactive oxygen, the production of which supports the strong systemic and hepatic oxidative stress response observed in Gclm(−/−) mice. Furthermore, the amount of H2O2 generated in complex 1 relative to complex 3 is greater in Gclm(−/−) mice than WT mice, and the complex 1 portion of H2O2 generated increases even further in liver mitochondria from mice fed a HFD.
Although Gclm(−/−) mice have reduced GSH levels, there are at least two reasons why the phenotype described in this paper cannot be directly ascribed to low levels of GSH. First, ablating a gene such as Gclm can affect many metabolic and signaling pathways, which then secondarily may generate the observed phenotype. Second, reducing GSH alters the redox state of many other thiols, including not only cysteine and homocysteine, but thioredoxins, glutaredoxins, and countless protein thiols (Jones, 2008; Hansen et al., 2006). The oxidative stress resulting from GSH depletion leads to the formation of thiol-protein mixed disulfides (Dalton et al., 2004). With diminished GSH, Cys must provide much of the thiol-mediated antioxidant response of the cell, resulting in an increase in carbon flow from methionine through the methionine trans-sulfuration pathway, raising the levels of metabolic intermediates such as Hcy in Gclm(−/−) mice. Homocysteinemia has been shown to be associated with oxidative stress and an increase in antioxidant enzymes (Moat et al., 2000). A possible mechanism for this relationship may involve insulin. Insulin is an important and potent regulator of Hcy metabolism, by transcriptional inhibition of both Hcy metabolizing enzymes, betaine homocysteine methyltransferase and cystathionine beta-synthase (Wijekoon et al., 2007). In humans, type 2 diabetes is typically preceded by years of insulin resistance and elevated blood insulin levels. Although Gclm(−/−) mice are insulin sensitive, their levels of plasma insulin after a glucose challenge are higher in than in WT mice. This mechanism may account for the elevated Hcy levels in liver and plasma observed in Gclm(−/−) mice. Conversely, the increased glucose tolerance in Gclm(−/−) mice may contribute to the elevated plasma levels of Hcy. Supporting this possibility was the finding that, in both lean and obese humans, plasma levels of Hcy were inversely associated with insulin resistance (Fonseca et al., 2003).
In spite of the association between oxidative stress and insulin resistance (Matsuzawa-Nagata et al., 2008), Gclm(−/−) mice, even fed a HFD, remain highly insulin sensitive and glucose tolerant. In particular, the HFD-associated increase in fasting plasma insulin is absent, and glucose tolerance is enhanced, in Gclm(−/−) mice. It is suggested that, in WT mice, saturation of lipid metabolism resulting from excess dietary fat intake inhibits cellular glucose uptake and insulin signaling in peripheral tissues (e.g., liver, skeletal muscle, adipose), leading to insulin resistance and compensatory increase in insulin secretion (Biswas et al., 2010). Due to intrinsic defects in lipid metabolism in Gclm(−/−) mice, such a cascade of events may not occur, which may explain the sustained insulin sensitivity in HFD-fed Gclm(−/−) mice.
Although oxidative stress (Koek et al., 2011), liver-specific deletion of the Gclc gene (Chen et al., 2007), and hyperhomocysteinemia (Namekata et al., 2004) are all associated with the development of steatosis, Gclm(−/−) mice still do not develop fatty liver when placed on a HFD. A primary reason for this phenotype is likely the drastic suppression of genes involved in hepatic de novo lipogenesis in these mice. Furthermore, the increase in body fat and a major shift in metabolism towards utilizing lipids as the metabolic fuel observed in HFD-fed WT mice are completely blocked in HFD-fed Gclm(−/−) mice, suggesting that lipogenesis and lipolysis in fat storing tissues are both impaired in Gclm(−/−) mice. Hepatic genes found down-regulated in Gclm(−/−) mice include Srebf1, Srebf2, Fasn, Elovl6, Scd1/2, Ppara and Ppargc1a. Srebf1 and Srebf2 encode sterol regulatory element-binding transcription factors (SREBFs), which are key positive regulators of lipogenic gene expression in response to insulin signaling (Oliner et al., 1996). Among the SREBFs targeting genes are Fasn, Elovl6 and Scd1/2 (Kawada et al., 2008).
Like SREBFs, PPARs are involved in regulating lipid metabolism in liver (Sugden et al., 2010). However, unlike SREBFs, PPARα (Kersten et al., 1999) and PGC-1γ (Zhang et al., 2004) may be either positive or negative regulators of lipid metabolism. A relationship between GSH deficiency and down-regulation of several hepatic lipid metabolizing genes, as well as liver lipid content, has been previously reported in rats treated with the GSH-depleting agent L-buthionine-[S,R]-sulfoximine (Brandsch et al., 2010). These authors speculated GSH deficiency reduces hepatic lipogenesis by reducing the activity of the redox-sensitive protein tyrosine phosphatase 1B, and increasing the concentration of the oxidized form of this protein. A recent paper reported that Gclm(−/−) mice (derived independently from those used in this paper) receiving a diet deficient in methionine and choline, were resistant to steatosis, fibrosis and inflammation (Haque et al., 2010). In those Gclm(−/−) mice, hepatic SCD1 mRNA levels were diminished, while FASN mRNA was unchanged and PPARα mRNA levels were increased. In contrast, PPARα and PPARγ have been shown to protect against steatosis by decreasing SREBP activity and lowering levels of the lipogenic enzymes fatty acid synthase and glycerol 3-phosphate acyltransferase (Konig et al., 2009). Furthermore, knockdown or knockout of the Ppara gene in mice leads to hypertriglyceridemia (De Souza et al., 2006). In humans, low levels of PPARα are associated with diminished rates of ß-oxidation of fatty acids through SREBP1, which in turn are associated with a greater degree of steatosis (Yasui et al., 2010). Therefore, the association between resistance from HFD-induced steatosis in Gclm(−/−) mice, and the expression of PPARs, which are transcriptionally downregulated in these mice, is not clear. Furthermore, signaling pathways upstream of the transcription factors that mediate the hepatic gene expression profile observed in Gclm(−/−) mice remains largely unknown.
Conclusions
Mice having global ablation of the Gclm(−/−) gene and having decreased systemic GSH levels display a partially latent phenotype that is evident when these mice consume a HFD. These mice have an increased BMR that correlates with lower rates of BW gain and results, at least in part, from enhanced activity of liver mitochondrial complex 1 electron transport and an increase in mitochondrial respiration. Gclm(−/−) mice are unable to metabolize dietary lipid, due to the extremely low levels of expression of lipid metabolism genes. These changes are responsible for the lean phenotype, even when these mice consume a HFD. Although Gclm(−/−) mice display strong systemic and hepatic oxidative stress responses, including increases in homocysteine levels, they do not succumb to HFD-induced insulin resistance or steatosis.
Highlights.
A high fat diet does not produce body weight and fat gain in Gclm(−/−) mice.
A high fat diet does not induce steatosis or insulin resistance in Gclm(−/−) mice.
Gclm(−/−) mice have high basal metabolism and mitochondrial oxygen consumption.
Expression of lipid metabolizing genes is extremely low in Gclm(−/−) mice.
Acknowledgements
We thank Dr. Giovanni Coppola, Department of Neurology, UCLA School of Medicine (gcoppola@ucla.edu) for the primer sequences for Ppargc1a. We also thank Dr. David A. D’Alessio, Department of Internal Medicine, University of Cincinnati College of Medicine-Endocrinology (David.D’Alessio@uc.edu), for performing the insulin RIA assays. This study was supported in part by NIEHS Center for Environmental Genetics Grant P30 ES06096.
Abbreviations
- BMR
basal metabolic rate
- BW
body weight
- DPH
1,6-diphenyl-1,3,5-hexatriene
- FBG
fasting blood glucose
- GCLM
glutamate-cysteine ligase modifier subunit
- GSH
glutathione
- GPX1
GSH peroxidase-1
- GSSG
glutathione disulfide
- GSR
GSSG reductase
- Hct
hematocrit
- HMOX1
Heme oxygenase-1
- HFD
high fat diet
- Hgb
hemoglobin
- HOMA-IR
homeostasis model assessment of insulin resistance
- MCHC
mean corpuscular hemoglobin concentration
- metHgb
methemoglobin
- ND
normal diet
- RBC
red blood cell
- TMA-DPH
1-(4-trimethylammoniumphenyl)-6-diphenyl-1,3,5-hexatriene p-toluenesulfonate.
Footnotes
Publisher's Disclaimer: This is a PDF file of an unedited manuscript that has been accepted for publication. As a service to our customers we are providing this early version of the manuscript. The manuscript will undergo copyediting, typesetting, and review of the resulting proof before it is published in its final citable form. Please note that during the production process errors may be discovered which could affect the content, and all legal disclaimers that apply to the journal pertain.
Conflict of interest statement:
The authors have nothing to disclose regarding funding or conflicts of interest regarding this manuscript.
Authorship contributions:
Participated in research design: Chen, Shertzer, Genter, Nebert.
Conducted experiments: Kendig, Krishan, Johansson, Schneider.
Performed data analysis: Shertzer, Kendig, Genter, Krishan.
Wrote the manuscript: Kendig, Shertzer.
Edited the manuscript: Chen, Genter, Nebert.
Other: All authors approved the final manuscript and Shertzer had primary responsibility for final content.
References
- Aebi S, Lauterburg BH. Divergent effects of intravenous GSH and cysteine on renal and hepatic GSH. Am. J. Physiol. 1992;263:R348–R352. doi: 10.1152/ajpregu.1992.263.2.R348. [DOI] [PubMed] [Google Scholar]
- Biswas A, Bhattacharya S, Dasgupta S, Kundu R, Roy SS, Pal BC, Bhattacharya S. Insulin resistance due to lipid-induced signaling defects could be prevented by mahanine. Mol. Cell Biochem. 2010;336:97–107. doi: 10.1007/s11010-009-0257-4. [DOI] [PubMed] [Google Scholar]
- Brandsch C, Schmidt T, Behn D, Weisse K, Mueller AS, Stangl GI. Glutathione deficiency down-regulates hepatic lipogenesis in rats. Lipids Health Dis. 2010;9:50. doi: 10.1186/1476-511X-9-50. [DOI] [PMC free article] [PubMed] [Google Scholar]
- Chen Y, Shertzer HG, Schneider SN, Nebert DW, Dalton TP. Glutamate cysteine ligase catalysis: Dependence on ATP and modifier subunit for regulation of tissue glutathione levels. J. Biol. Chem. 2005;280:33766–33774. doi: 10.1074/jbc.M504604200. [DOI] [PubMed] [Google Scholar]
- Chen Y, Yang Y, Miller ML, Shen D, Shertzer HG, Stringer KF, Wang B, Schneider SN, Nebert DW, Dalton TP. Hepatocyte-specific Gclc deletion leads to rapid onset of steatosis with mitochondrial injury and liver failure. Hepatology. 2007;45:1118–1128. doi: 10.1002/hep.21635. [DOI] [PubMed] [Google Scholar]
- Dalton TP, Chen Y, Schneider SN, Nebert DW, Shertzer HG. Genetically altered mice to evaluate glutathione homeostasis in health and disease. Free Radic. Biol. Med. 2004;37:1511–1526. doi: 10.1016/j.freeradbiomed.2004.06.040. [DOI] [PubMed] [Google Scholar]
- De Souza AT, Dai X, Spencer AG, Reppen T, Menzie A, Roesch PL, He Y, Caguyong MJ, Bloomer S, Herweijer H, Wolff JA, Hagstrom JE, Lewis DL, Linsley PS, Ulrich RG. Transcriptional and phenotypic comparisons of Ppara knockout and siRNA knockdown mice. Nucleic Acids Res. 2006;34:4486–4494. doi: 10.1093/nar/gkl609. [DOI] [PMC free article] [PubMed] [Google Scholar]
- de Quay B, Malinverni R, Lauterburg BH. Glutathione depletion in HIV-infected patients: role of cysteine deficiency and effect of oral N-acetylcysteine. AIDS. 1992;6:815–819. [PubMed] [Google Scholar]
- Elder DA, Prigeon RL, Wadwa RP, Dolan LM, D’Alessio DA. Beta-cell function, insulin sensitivity, and glucose tolerance in obese diabetic and nondiabetic adolescents and young adults. J Clin Endocrinol Metab. 2006;91:185–191. doi: 10.1210/jc.2005-0853. [DOI] [PubMed] [Google Scholar]
- Flagg EW, Coates RJ, Jones DP, Eley JW, Gunter EW, Jackson B, Greenberg RS. Plasma total glutathione in humans and its association with demographic and health-related factors. Br. J. Nutr. 1993;70:797–808. doi: 10.1079/bjn19930175. [DOI] [PubMed] [Google Scholar]
- Fonseca VA, Fink LM, Kern PA. Insulin sensitivity and plasma homocysteine concentrations in non-diabetic obese and normal weight subjects. Atherosclerosis. 2003;167:105–109. doi: 10.1016/s0021-9150(02)00386-6. [DOI] [PubMed] [Google Scholar]
- Giustarini D, Dalle-Donne I, Milzani A, Rossi R. Low molecular mass thiols, disulfides and protein mixed disulfides in rat tissues: Influence of sample manipulation, oxidative stress and ageing. Mech. Ageing Dev. 2011;132:141–148. doi: 10.1016/j.mad.2011.02.001. [DOI] [PubMed] [Google Scholar]
- Günzler WA, Flohé L. Glutathione peroxidase. In: Greenwald RA, editor. CRC Handbook of Methods for Oxygen Radical Research. CRC Press; Boca Raton, FL: 1985. pp. 285–290. [Google Scholar]
- Hansen JM, Go YM, Jones DP. Nuclear and mitochondrial compartmentation of oxidative stress and redox signaling. Annu. Rev. Pharmacol. Toxicol. 2006;46:215–234. doi: 10.1146/annurev.pharmtox.46.120604.141122. [DOI] [PubMed] [Google Scholar]
- Haque JA, McMahan RS, Campbell JS, Shimizu-Albergine M, Wilson AM, Botta D, Bammler TK, Beyer RP, Montine TJ, Yeh MM, Kavanagh TJ, Fausto N. Attenuated progression of diet-induced steatohepatitis in glutathione-deficient mice. Lab Invest. 2010;90:1704–1717. doi: 10.1038/labinvest.2010.112. [DOI] [PMC free article] [PubMed] [Google Scholar]
- Jones DP. Redefining oxidative stress. Antioxid. Redox. Signal. 2006;8:1865–1879. doi: 10.1089/ars.2006.8.1865. [DOI] [PubMed] [Google Scholar]
- Jones DP. Radical-free biology of oxidative stress. Am. J. Physiol Cell Physiol. 2008;295:C849–C868. doi: 10.1152/ajpcell.00283.2008. [DOI] [PMC free article] [PubMed] [Google Scholar]
- Jones DP, Carlson JL, Samiec PS, Sternberg P, Jr., Mody VC, Jr., Reed RL, Brown LA. Glutathione measurement in human plasma. Evaluation of sample collection, storage and derivatization conditions for analysis of dansyl derivatives by HPLC. Clin. Chim. Acta. 1998;275:175–184. doi: 10.1016/s0009-8981(98)00089-8. [DOI] [PubMed] [Google Scholar]
- Kawada T, Goto T, Hirai S, Kang MS, Uemura T, Yu R, Takahashi N. Dietary regulation of nuclear receptors in obesity-related metabolic syndrome. Asia Pac. J. Clin. Nutr. 2008;17(Suppl 1):126–130. [PubMed] [Google Scholar]
- Kersten S, Seydoux J, Peters JM, Gonzalez FJ, Desvergne B, Wahli W. Peroxisome proliferator-activated receptor alpha mediates the adaptive response to fasting. J. Clin. Invest. 1999;103:1489–1498. doi: 10.1172/JCI6223. [DOI] [PMC free article] [PubMed] [Google Scholar]
- Kode A, Rajendrasozhan S, Caito S, Yang SR, Megson IL, Rahman I. Resveratrol induces glutathione synthesis by activation of Nrf2 and protects against cigarette smoke-mediated oxidative stress in human lung epithelial cells. Am. J. Physiol Lung Cell Mol. Physiol. 2008;294:L478–L488. doi: 10.1152/ajplung.00361.2007. [DOI] [PubMed] [Google Scholar]
- Koek GH, Liedorp PR, Bast A. The role of oxidative stress in non-alcoholic steatohepatitis. Clin. Chim. Acta. 2011;412:1297–1305. doi: 10.1016/j.cca.2011.04.013. [DOI] [PubMed] [Google Scholar]
- Konig B, Koch A, Spielmann J, Hilgenfeld C, Hirche F, Stangl GI, Eder K. Activation of PPARa and PPARgamma reduces triacylglycerol synthesis in rat hepatoma cells by reduction of nuclear SREBP-1. Eur. J. Pharmacol. 2009;605:23–30. doi: 10.1016/j.ejphar.2009.01.009. [DOI] [PubMed] [Google Scholar]
- Krejsa CM, Franklin CC, White CC, Ledbetter JA, Schieven GL, Kavanagh TJ. Rapid activation of glutamate cysteine ligase following oxidative stress. J. Biol. Chem. 2010;285:16116–16124. doi: 10.1074/jbc.M110.116210. [DOI] [PMC free article] [PubMed] [Google Scholar]
- Livak KJ, Schmittgen TD. Analysis of relative gene expression data using real-time quantitative PCR and the 2(-Delta Delta C(T)) Method. Methods. 2001;25:402–408. doi: 10.1006/meth.2001.1262. [DOI] [PubMed] [Google Scholar]
- Look MP, Rockstroh JK, Rao GS, Kreuzer KA, Barton S, Lemoch H, Sudhop T, Hoch J, Stockinger K, Spengler U, Sauerbruch T. Serum selenium, plasma glutathione (GSH) and erythrocyte glutathione peroxidase (GSH-Px)-levels in asymptomatic versus symptomatic human immunodeficiency virus-1 (HIV-1)-infection. Eur. J. Clin. Nutr. 1997;51:266–272. doi: 10.1038/sj.ejcn.1600401. [DOI] [PubMed] [Google Scholar]
- Matsuzawa-Nagata N, Takamura T, Ando H, Nakamura S, Kurita S, Misu H, Ota T, Yokoyama M, Honda M, Miyamoto K, Kaneko S. Increased oxidative stress precedes the onset of high-fat diet-induced insulin resistance and obesity. Metabolism. 2008;57:1071–1077. doi: 10.1016/j.metabol.2008.03.010. [DOI] [PubMed] [Google Scholar]
- Michelet F, Gueguen R, Leroy P, Wellman M, Nicolas A, Siest G. Blood and plasma glutathione measured in healthy subjects by HPLC: relation to sex, aging, biological variables, and life habits. Clin. Chem. 1995;41:1509–1517. [PubMed] [Google Scholar]
- Moat SJ, Bonham JR, Cragg RA, Powers HJ. Elevated plasma homocysteine elicits an increase in antioxidant enzyme activity. Free Radic. Res. 2000;32:171–179. doi: 10.1080/10715760000300171. [DOI] [PubMed] [Google Scholar]
- Morrison JA, Jacobsen DW, Sprecher DL, Robinson K, Khoury P, Daniels SR. Serum glutathione in adolescent males predicts parental coronary heart disease. Circulation. 1999;100:2244–2247. doi: 10.1161/01.cir.100.22.2244. [DOI] [PubMed] [Google Scholar]
- Mulherin DM, Thurnham DI, Situnayake RD. Glutathione reductase activity, riboflavin status, and disease activity in rheumatoid arthritis. Ann. Rheum. Dis. 1996;55:837–840. doi: 10.1136/ard.55.11.837. [DOI] [PMC free article] [PubMed] [Google Scholar]
- Namekata K, Enokido Y, Ishii I, Nagai Y, Harada T, Kimura H. Abnormal lipid metabolism in cystathionine beta-synthase-deficient mice, an animal model for hyperhomocysteinemia. J. Biol. Chem. 2004;279:52961–52969. doi: 10.1074/jbc.M406820200. [DOI] [PubMed] [Google Scholar]
- Oliner JD, Andresen JM, Hansen SK, Zhou S, Tjian R. SREBP transcriptional activity is mediated through an interaction with the CREB-binding protein. Genes Dev. 1996;10:2903–2911. doi: 10.1101/gad.10.22.2903. [DOI] [PubMed] [Google Scholar]
- Ronchi VP, Giudici AM, Mendieta JR, Caballero VJ, Chisari AN, Sanllorenti PM, Conde RD. Oxidative stress in mouse liver caused by dietary amino acid deprivation: protective effect of methionine. J. Physiol Biochem. 2010;66:93–103. doi: 10.1007/s13105-010-0014-x. [DOI] [PubMed] [Google Scholar]
- Senft AP, Dalton TP, Nebert DW, Genter MB, Puga A, Hutchinson RJ, Kerzee JK, Uno S, Shertzer HG. Mitochondrial reactive oxygen production is dependent on the aromatic hydrocarbon receptor. Free Radic. Biol. Med. 2002;33:1268–1278. doi: 10.1016/s0891-5849(02)01014-6. [DOI] [PubMed] [Google Scholar]
- Shertzer HG, Bannenberg GL, Rundgren M, Moldeus P. Relationship of membrane fluidity, chemoprotection, and the intrinsic toxicity of butylated hydroxytoluene. Biochem. Pharmacol. 1991;42:1587–1593. doi: 10.1016/0006-2952(91)90428-8. [DOI] [PubMed] [Google Scholar]
- Shertzer HG, Genter MB, Shen D, Nebert DW, Chen Y, Dalton TP. TCDD decreases ATP levels and increases reactive oxygen production through changes in mitochondrial F(0)F(1)-ATP synthase and ubiquinone. Toxicol. Appl. Pharmacol. 2006;217:363–374. doi: 10.1016/j.taap.2006.09.014. [DOI] [PMC free article] [PubMed] [Google Scholar]
- Smith CV, Jones DP, Guenthner TM, Lash LH, Lauterburg BH. Compartmentation of glutathione: implications for the study of toxicity and disease. Toxicol. Appl. Pharmacol. 1996;140:1–12. doi: 10.1006/taap.1996.0191. [DOI] [PubMed] [Google Scholar]
- Sugden MC, Caton PW, Holness MJ. PPAR control: it’s SIRTainly as easy as PGC. J. Endocrinol. 2010;204:93–104. doi: 10.1677/JOE-09-0359. [DOI] [PubMed] [Google Scholar]
- Wijekoon EP, Brosnan ME, Brosnan JT. Homocysteine metabolism in diabetes. Biochem. Soc. Trans. 2007;35:1175–1179. doi: 10.1042/BST0351175. [DOI] [PubMed] [Google Scholar]
- Winterbourn CC. Reactions of superoxide with hemoglobin. In: Greenwald RA, editor. Handbook of Methods for Oxygen Radical Research. CRC Press, Inc.; Boca Raton, FL: 1985. pp. 137–141. [Google Scholar]
- Witschi A, Reddy S, Stofer B, Lauterburg BH. The systemic availability of oral glutathione. Eur. J. Clin. Pharmacol. 1992;43:667–669. doi: 10.1007/BF02284971. [DOI] [PubMed] [Google Scholar]
- Yang Y, Dieter MZ, Chen Y, Shertzer HG, Nebert DW, Dalton TP. Initial characterization of the glutamate-cysteine ligase modifier subunit Gclm(-/-) knockout mouse. Novel model system for a severely compromised oxidative stress response. J. Biol. Chem. 2002;277:49446–49452. doi: 10.1074/jbc.M209372200. [DOI] [PubMed] [Google Scholar]
- Yasui K, Harano Y, Mitsuyoshi H, Tsuji K, Endo M, Nakajima T, Minami M, Itoh Y, Zen Y, Nakanuma Y, Yoshikawa T, Okanoue T. Steatosis and hepatic expression of genes regulating lipid metabolism in Japanese patients infected with hepatitis C virus. J. Gastroenterol. 2010;45:95–104. doi: 10.1007/s00535-009-0133-8. [DOI] [PubMed] [Google Scholar]
- Zhang Y, Castellani LW, Sinal CJ, Gonzalez FJ, Edwards PA. Peroxisome proliferator-activated receptor-gamma coactivator 1alpha (PGC-1alpha) regulates triglyceride metabolism by activation of the nuclear receptor FXR. Genes Dev. 2004;18:157–169. doi: 10.1101/gad.1138104. [DOI] [PMC free article] [PubMed] [Google Scholar]


