Abstract
The purpose was to evaluate a relationship between slice thickness and calculated volume on CT liver volumetry by comparing the results for images with various slice thicknesses including three-dimensional images. Twenty adult potential liver donors (12 men, 8 women; mean age, 39 years; range, 24–64) underwent CT with a 64-section multi-detector row CT scanner after intra-venous injection of contrast material. Four image sets with slice thicknesses of 0.625 mm, 2.5 mm, 5 mm, and 10 mm were used. First, a program developed in our laboratory for automated liver extraction was applied to CT images, and the liver boundary was obtained automatically. Then, an abdominal radiologist reviewed all images on which automatically extracted boundaries were superimposed, and edited the boundary on each slice to enhance the accuracy. Liver volumes were determined by counting of the voxels within the liver boundary. Mean whole liver volumes estimated with CT were 1322.5 cm3 on 0.625-mm, 1313.3 cm3 on 2.5-mm, 1310.3 cm3 on 5-mm, and 1268.2 cm3 on 10-mm images. Volumes calculated for three-dimensional (0.625-mm-thick) images were significantly larger than those for thicker images (P<.0001). Partial liver volumes of right lobe, left lobe, and lateral segment were also evaluated in a similar manner. Estimated maximum differences in calculated volumes of lateral segment was −10.9 cm3 (−4.6%) between 0.625-mm and 5-mm images. In conclusion, liver volumes calculated on 2.5-mm or thicker images were significantly smaller than volumes calculated on three-dimensional images. If a maximum error of 5% in the calculated graft volume is within the range of having an insignificant clinical impact, 5-mm thick images are acceptable for CT volumetry. If not, three-dimensional images could be essential.
Keywords: Tomography, X-Ray Computed; Tomography, Spiral Computed; Organ Size
Computed tomography (CT) liver volumetry is a technique that enables us to assess liver volume non-invasively. The principle of the technique is simple, and it has been reported since the 1970s.1 In this method, the volume of the liver can be calculated by obtaining the area of each cross-sectional image, multiplying the area by the slice interval to give the slice volume, and summing the volumes of the slices to give the total liver volume. The technique can be used for preoperative measurement of the liver volume of donors for living related liver transplantation.2, 3 In cases of living related liver transplantations, evaluation of total and segmental liver volumes is crucial because the graft size is one of the major factors determining a successful outcome for both recipient and donor.4, 5 Many researchers have reported the results of the accuracy of CT liver volumetry by using intraoperative liver volume measurement as reference standard. Reported results show a deviation from reference standard ranging from 0% to more than 30% as to the accuracy of the technique.6–10 One of the causes of errors is considered to be partial volume effects. Volume of each slice has inherent error due to partial volume effects, and the errors are potentially cumulative when summing those volumes of slices to calculate total liver volume. Quantitative estimation of the degree of the error could be useful for improving the accuracy of CT liver volumetry.
Recent advances in multi-detector row helical CT technology have enabled us to obtain isotropic three-dimensional (3D) image data, in which the slice thickness is typically 0.5–0.7 mm. With the use of 3D image data, partial volume effects are expected to decrease considerably, and the accuracy of CT liver volumetry can potentially be improved. On the other hand, the radiologists' or surgeons' workload (time) would be substantially more if they manually trace the liver contour on each image of 3D data instead of the usual two-dimensional (2D) data, due to the considerable increase in number of images when using thinner slice sections. To our knowledge, there are no published reports on CT liver volumetry by using 3D image data, and no studies have systematically made a quantitative estimate of the effects of slice thickness less than 1 mm (i.e. 3D image data) on volume calculation, though some researchers studied the effects of that down to 2 mm.11 Therefore, it is unclear whether using 3D data would provide more accurate measurements and therefore be the preferred technique for CT volumetry in clinical routines.
Our purpose in this study was to evaluate a relationship between slice thickness and calculated volume on CT liver volumetry by using numerical simulation based on a simple model and by comparing the results of CT volumetry for images with various slice thicknesses including 0.625-mm-thick isotropic 3D images.
MATERIALS AND METHODS
The institutional review board approved this Health Insurance Portability and Accountability Act (HIPAA)-compliant retrospective study and waived the requirement for informed consent.
Numerical Simulation
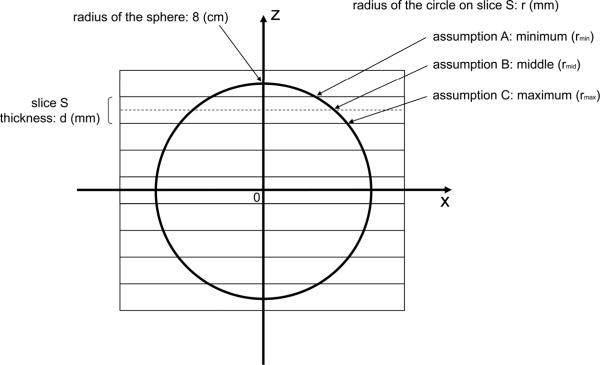
In order to examine the effects of slice thickness on the accuracy of volumetry, we performed numerical simulation based on a simple model. In this simulation, the volume of a sphere of radius 8 cm was calculated (Fig. 1). We used a sphere instead of the actual liver shape in this simulation, because we thought it would be adequate for the purpose of rough estimation of the effects being studied.
Fig. 1.
Drawing of the spherical model for numerical simulation shows a cross section of a sphere 8 cm in radius at y=0. The y-axis is perpendicular to the plane of the paper. The center of the sphere is located at the origin of the coordinate system. Rectangles show cross sections of CT slices, which are perpendicular to the z-axis, with both thickness and intervals of d mm. The center of the sphere is located at the middle of a slice and the center of the slice plane. For a given slice S, the volume of a part of the sphere within the slice S can be approximated by the volume of a cylinder with a radius of r mm and a height of d mm. The volume of the cylinder was calculated based on three assumptions for the radius: (A) minimum, (B) middle, and (C) maximum. The total volume of the sphere was approximated by the sum of the volumes of these cylinders.
Rectangles in Fig. 1 show cross sections of CT slices with both thickness and intervals of d mm. The center of the sphere is located at the middle of a slice and the center of the slice plane. For a given slice S, the volume of a part of the sphere within the slice S can be approximated by the volume of a cylinder with a radius of r mm and a height of d mm. The volume of the cylinder was calculated based on three assumptions for the radius: (A) minimum, (B) middle, and (C) maximum. The minimum and maximum distances (rmin and rmax) between the z-axis and the surface of the sphere in the slice S were used as the cylinder's radius in the minimum and maximum assumptions, respectively. In the middle assumption, the distance (rmid) between the z-axis and the surface of the sphere at the middle of slice S was used as the cylinder's radius. The total volume of the sphere was approximated by the sum of the volumes of these cylinders. The true volume of the sphere should be between the values calculated under the minimum and maximum assumptions. As the slice thickness/interval decreases, the difference between the values of the minimum and maximum assumptions will also decrease.
Potential Liver Donors
Between January 2006 and March 2007, 37 consecutive living liver transplant potential donors were examined with 64-section multi-detector row helical CT. Exclusion criteria included a fatty liver (n=8), benign or malignant liver tumors (n=8), and liver cysts more than 2 cm in diameter (n=1). Therefore, a total of 20 potential donors (mean age, 39 years; range, 24–64), including 12 men and 8 women were enrolled in the study. The mean body weight and body height were 61 ± 10 (standard deviation) kg (range, 40–82) and 165 ± 10 cm (range, 146–178), respectively. Standard liver volumes were calculated using a previously described formula by Urata et al.12 Each of two of the potential donors had two liver cysts less than 1 cm in diameter. Another potential donor had four liver cysts less than 5 mm in diameter. The remaining 17 potential donors had no focal liver lesions. Sample size was calculated to detect a 1% difference in the liver volume between calculations on two image sets with a power of .8 and an α type I error of .05, and a sample size of 10 was required. With this in mind, a sample size of 20 was chosen.
CT Examination
All potential liver donors were scanned with a 64-section CT scanner (LightSpeed VCT; GE Healthcare, Milwaukee, WI), after fasting for at least 4 hours. Details of the protocol are shown in Table 1. All images were stored in a picture archiving and communication system.
Table 1.
Parameters for CT imaging
| Parameters | Data |
|---|---|
| Scan Parameters | |
| No. of detectors | 64 |
| Section thickness (mm) | 0.625 / 5 |
| Section interval (mm) | 0.625 / 5 |
| Rotation time (s) | 0.4 |
| Helical pitch | 1.375 |
| Table movement (mm/rot) | 55 |
| Field of view (cm) | 34.5 |
| Pixel matrix | 512 × 512 |
| Tube voltage (kVp) | 120 |
| Tube current (mA) | 100 – 750* |
| Acquisition time (s) | approximately 2 (each phase)† |
| Contrast agent | |
| Type | iohexol (Omnipaque 300, GE Healthcare) |
| Concentration (mg of iodine per mL) | 300 |
| Volume (mL) | mean, 135 (range, 94–145) |
| Injection rate (mL/s) | 3.2 – 5.0 |
The tube current was modulated by an automatic exposure control technique (Auto mA and Smart mA; GE Healthcare). The noise index was set at 12.
Following acquisition of unenhanced CT images, each potential donor was scanned after intravenous contrast medium administration during the early arterial, late arterial, and portal venous phases. For timing of the start of the early arterial phase imaging, a bolus-tracking technique (SmartPrep; GE Healthcare) was used, and early arterial phase scanning was started 10 seconds after the trigger threshold (50 HU) was reached at the level of the supraceliac abdominal aorta. For the late arterial and portal venous phases, scanning delays were 22 and 64 seconds, respectively, after reaching the trigger threshold.
Liver Volume Measurement
Portal venous phase images were used in this study. For each potential donor, two image sets with different slice thicknesses/intervals of 0.625mm/0.625mm and 5mm/5mm were retrieved on a personal computer (Xeon Quad-core 2.7 GHz; Intel, Santa Clara, Ca). Images 2.5 mm-thick and with a 2.5 mm-interval were reconstructed from 0.625 mm/0.625 mm images by averaging of four contiguous 0.625-mm images. Similarly, images 10 mm thick and with a 10 mm-interval were reconstructed from 5 mm/5 mm images by averaging of two contiguous 5-mm images. Therefore, four image sets with slice thicknesses of 0.625 mm, 2.5 mm, 5 mm, and 10 mm were available for the study. Image intervals equaled slice thicknesses (i.e., no slice overlap).
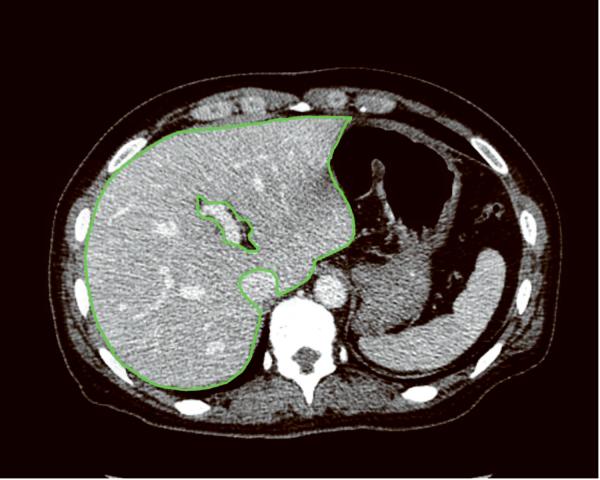
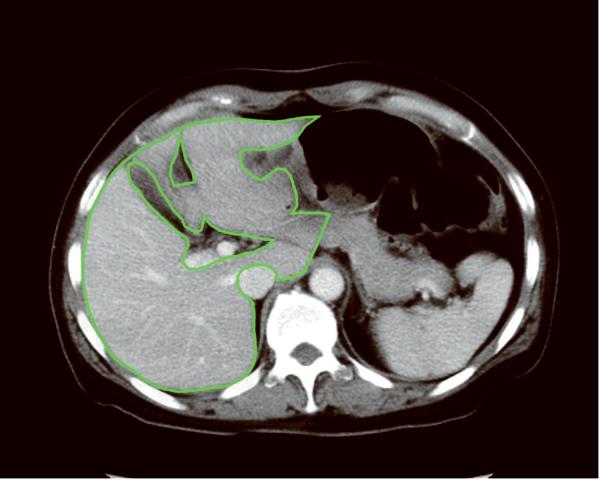
First, a program for automated liver extraction was applied to 0.625-mm 3D CT images, and the liver boundary was obtained automatically for each case. The software was developed in (anonymized) laboratory by using 3D geodesic active contour segmentation coupled with a level-set algorithm.13, 14 Second, an abdominal radiologist (anonymized) with 15 years' experience in hepatobiliary imaging reviewed every eight images (5-mm intervals) on which automatically extracted boundaries were superimposed. The radiologist edited the boundary to enhance the accuracy of volumetry by using a specially designed software tool developed in (anonymized) laboratory. In other words, the radiologist edited the boundary on a 0.625-mm 3D image, then skipped seven images and edited another boundary, then repeated the procedure. Third, the program for automated liver extraction was again applied to the images. This time, the process retained the manually corrected contours on every eight slices, and none of the manual corrections was lost in the process. Fourth, the radiologist edited the contours on every four slices (2.5-mm intervals). Fifth, the automated liver extraction program was applied again, while the manually corrected contours were retained. Finally, the radiologist edited the boundary on every slice, and the contours in every slice were settled for 0.625-mm 3D image set. The manual correction process was done carefully, and mean time required to complete it was 98 min per case (range, 85–122 min). The inferior vena cava, main trunk and bilateral first branches of the portal vein, and major fissures were excluded in the manual editing process (Fig. 2). The hepatic veins were included in the liver region. Then, the contours on 0.625-mm 3D images were transferred to the 2.5-mm, 5-mm, and 10-mm image sets. The radiologist edited the contours on every slice for these thicker images, and the contours in every slice were settled for the 2.5-mm, 5-mm, and 10-mm image sets. The whole liver volume was determined by counting of voxels within the liver boundary in each case. Additionally, the radiologist drew the border between liver segments on CT images in a similar fashion. Then, the volumes of right lobe (Couinaud segment S5–8), left lobe (S2–4), and lateral segment (S2 and S3) were also determined.
Fig. 2.
Liver contours on axial CT images after manual editing show isolation of the liver from surrounding structures. The inferior vena cava, main trunk and bilateral first branches of the portal vein, and major fissures are excluded from the liver region. The contours are drawn on (A) a 0.625-mm thick 3D image and (B) a 10-mm thick image. Partial volume effects are much more prominent on the 10-mm image compared to the 0.625-mm 3D image.
Statistical Analysis
Calculated volumes were compared among image sets with different slice thicknesses. Differences among image sets in terms of the mean calculated liver volume were analyzed statistically by using multiple comparison analysis (Dunnett pairwise multiple comparisons t test). In this test, the 0.625-mm 3D image set was chosen as the control group against which the other three image sets (2.5-mm, 5-mm, and 10-mm images) were compared. Statistical analyses were performed by using software (SPSS 11.0 for Windows; SPSS Inc., Chicago, IL). A two-tailed P value of less than .05 was considered to indicate a statistically significant difference.
The statistical analysis for assessing agreement between volumes calculated for the four different image sets was performed with the method described by Bland and Altman.15, 16 The intra-class correlation coefficients were also calculated as a measure of agreement.
RESULSTS
The results of the numerical simulation are given in Table 2. When a slice thickness of 10 mm was employed, numerical simulation showed that the maximum difference of the volumes of a sphere 8 cm in radius between the exact value and the calculated value based on simulations was 9.57 % (assumption C), although it was less than −0.4 % if the contour of the middle of the slice was used for the calculation (assumption B). The maximum difference was reduced as the slice thickness decreased, and it was less than 0.6 % when the slice thickness was 0.625 mm.
Table 2.
Results of Numerical Simulation
| Slice thickness / interval (mm) | Difference (%) |
||
|---|---|---|---|
| assumption A: minimum | assumption B: middle | assumption C: maximum | |
| 10 | −9.143 | −0.391 | 9.570 |
| 5 | −4.634 | −0.098 | 4.736 |
| 2.5 | −2.331 | −0.024 | 2.356 |
| 1.25 | −1.169 | −0.006 | 1.175 |
| 0.625 | −0.585 | −0.002 | 0.587 |
Note. – Values show the differences of the volumes of a sphere 8 cm in radius in percent figures as follows: Differences (%) = [(calculated volume based on simulation) − (exact volume)] / (exact volume) × 100 (%) Exact volume of the sphere = (4/3) π × 83 = 2144.66 cm3.
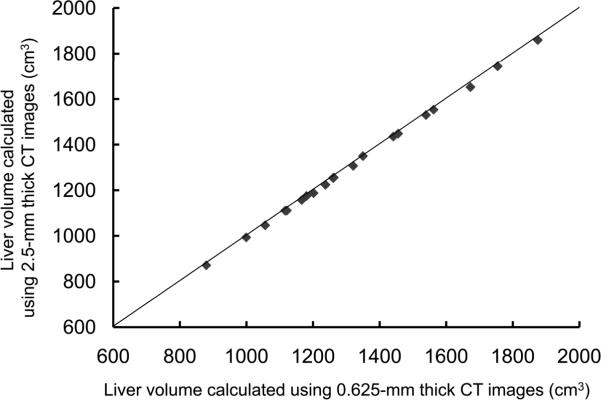
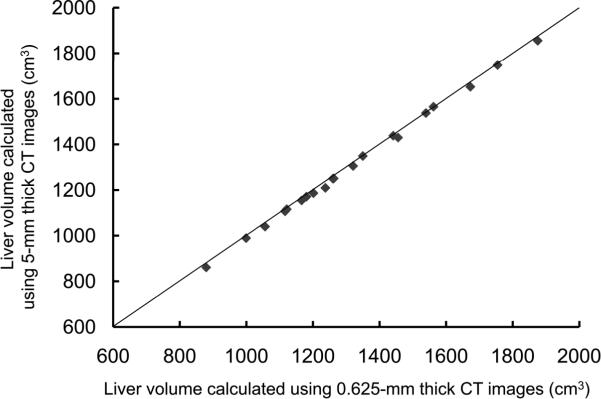
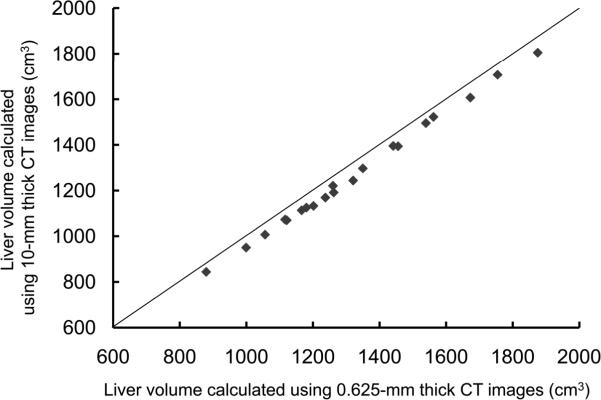
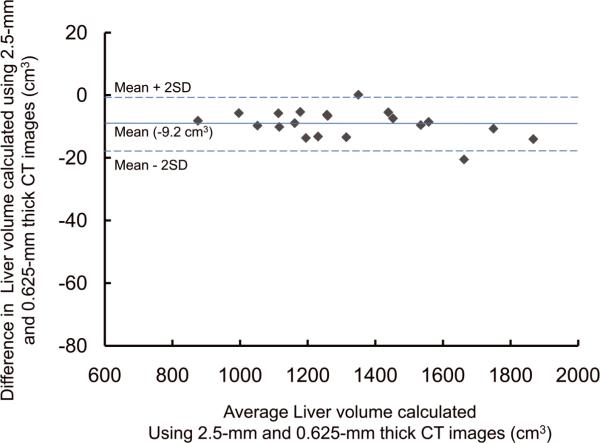
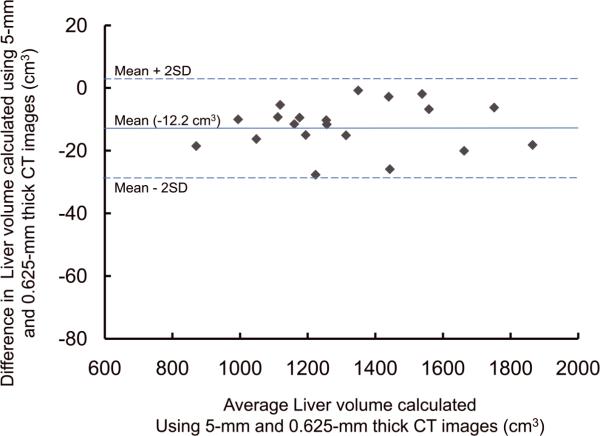
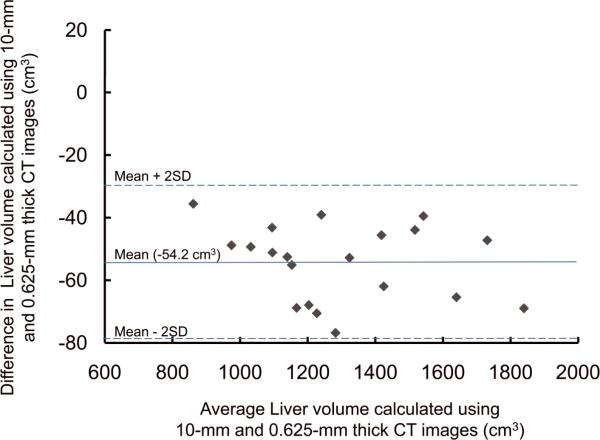
For the potential liver donors, the liver volumes estimated with CT liver volumetry are displayed in Table 3. The intra-class correlation coefficients were 1.000 (0.625-mm versus 2.5-mm images), 1.000 (0.625-mm versus 5-mm images), and 0.999 (0.625-mm versus 10-mm images) for whole liver volumetry with statistically significant differences (P<.0001). Scatter plots showed excellent agreement in calculated whole liver volume between 0.625-mm images and 2.5-mm, 5-mm, or 10-mm images (Fig. 3), although the calculated volumes on 0.625-mm 3D images were significantly larger than those on thicker slice images (2.5-mm, 5-mm, and 10-mm) (P<.0001 for all comparison pairs). Bland-Altman plots showed no discrepancies in relation to the size of the whole liver volume measurement, and a thinner slice thickness shows a smaller degree of dispersion around the horizontal axis (Fig. 4). The mean, the standard deviation of the differences, the 95% limits of agreement, the width of the 95% limits of agreement, the 95% confidence intervals (CI) for the bias, the 95% CI for the lower limit of agreement, and the 95% CI for the upper limit of agreement are summarized in Table 4 for volumes on 2.5-mm, 5-mm, and 10-mm images versus the value on 0.625-mm 3D images.
Table 3.
Volumes Estimated with CT Liver Volumetry (20 cases)
| Slice thickness / interval (mm) | Volumes ± Standard deviation (cm3) |
|||
|---|---|---|---|---|
| Whole liver | Right lobe (Couinaud segment: S5–8) | Left lobe (S2–4) | Lateral segment (S2, S3) | |
| 10 | 1268.2 ± 256.8* (843.8 – 1805.1) | 850.8 ± 186.1* (571.2 – 1237.6) | 394.3 ± 88.5* (257.7 – 580.0) | 218.8 ± 53.2* (145.2 – 329.6) |
| 5 | 1310.3 ± 260.0* (860.8 – 1855.8) | 870.5 ± 187.9† (581.2 – 1255.3) | 414.2 ± 89.8‡ (264.4 – 601.4) | 233.4 ± 55.3(N.S.) (147.8 – 347.1) |
| 2.5 | 1313.3 ± 257.8* (871.2 – 1860.0) | 873.8 ± 186.5(N.S.) (590.0 – 1255.2) | 415.0 ± 91.5(N.S.) (266.9 – 607.9) | 232.4 ± 54.4(N.S.) (150.3 – 340.8) |
| 0.625 | 1322.5 ± 259.5 (879.3 – 1874.0) | 877.0 ± 187.1 (592.1 – 1260.0) | 419.0 ± 91.8 (270.7 – 608.3) | 235.6 ± 55.1 (153.3 – 342.7) |
Note. – Values in parentheses show the minimum and maximum values.
The calculated volumes were significantly larger than those on 0.625-mm images
P<.0001,
P<.01,
P<.05; Dunnett pairwise multiple comparisons t test.
Not significant differences (P>.05).
Fig. 3.
Scatter plots of estimated whole liver volumes on 0.625-mm versus (A) 2.5-mm, (B) 5-mm, and (C) 10-mm images. Volumes estimated on thicker images were smaller than those estimated on 0.625-mm 3D images. The solid lines represent the line of equality.
Fig. 4.
Plots of estimated whole liver volume differences between 0.625-mm and (A) 2.5-mm, (B) 5-mm, and (C) 10-mm images against their averages. There are no discrepancies in relation to the size of the liver volume measurement. A thinner slice thickness shows a smaller degree of dispersion around the horizontal axis.
Table 4.
Accuracy Measurements of CT Liver Volumetry (20 cases)
| Variable | Whole liver |
||
|---|---|---|---|
| 2.5-mm Volume versus 0.625-mm Volume (cm3) | 5-mm Volume versus 0.625-mm Volume (cm3) | 10-mm Volume versus 0.625-mm Volume (cm3) | |
| Mean difference* | −9.2 [−0.70 (%)] | −12.2 [−0.96 (%)] | −54.2 [−4.20 (%)] |
| Standard deviation of differences | 4.4 [0.30 (%)] | 7.5 [0.61 (%)] | 12.1 [1.01 (%)] |
| 95% limits of agreement | −17.8, −0.5 [−1.29, −0.11 (%)] | −26.8, +2.5 [−2.22, +0.36 (%)] | −78.0, −30.5 [−6.18, −2.22 (%)] |
| Width of 95% limits of agreement | 17.3 [1.18 (%)] | 29.3 [2.58 (%)] | 47.5 [3.96 (%)] |
| 95% CI for the bias | −11.2, −7.1 [−0.84, −0.56 (%)] | −15.7, −8.7 [−1.24, −0.62 (%)] | −59.9, −48.5 [−4.67, −3.72 (%)] |
| 95% CI for the lower limit of agreement | −21.3, −14.3 [−1.53, −1.05 (%)] | −32.8, −20.8 [−2.75, −1.70 (%)] | −87.7, −68.3 [−6.99, −5.37 (%)] |
| 95% CI for the upper limit of agreement | −4.1, +3.0 [−0.35, +0.13 (%)] | −3.5, +8.4 [−0.17, +0.89 (%)] | −40.2, −20.8 [−3.02, −1.41 (%)] |
| Variable | Right lobe (Couinaud segment: S5–8) |
||
|---|---|---|---|
| 2.5-mm Volume versus 0.625-mm Volume (cm3) | 5-mm Volume versus 0.625-mm Volume (cm3) | 10-mm Volume versus 0.625-mm Volume (cm3) | |
| Mean difference* | −3.2 [−0.38 (%)] | −6.5 [−0.80 (%)] | −26.2 [−3.09 (%)] |
| Standard deviation of differences | 3.8 [0.41 (%)] | 9.6 [1.11 (%)] | 12.3 [1.47 (%)] |
| 95% limits of agreement | −10.6, +4.1 [−1.19, +0.43 (%)] | −25.3, +12.2 [−2.98, +1.38 (%)] | −50.2, −2.2 [−5.97, −0.21 (%)] |
| Width of 95% limits of agreement | 14.8 [1.62 (%)] | 37.6 [4.36 (%)] | 48.1 [5.76 (%)] |
| 95% CI for the bias | −5.0, −1.5 [−0.57, −0.18 (%)] | −11.0, −2.1 [−1.32, −0.28 (%)] | −31.9, −20.5 [−3.78, −2.40 (%)] |
| 95% CI for the lower limit of agreement | −13.7, −7.6 [−1.52, −0.86 (%)] | −33.0, −17.7 [−3.88, −2.09 (%)] | −60.1, −40.4 [−7.15, −4.80 (%)] |
| 95% CI for the upper limit of agreement | +1.1, +7.2 [+0.10, +0.76 (%)] | +4.6, +19.9 [+0.49, +2.27 (%)] | −12.0, +7.7 [−1.39, +0.96 (%)] |
| Variable | Left lobe (S2–4) |
||
|---|---|---|---|
| 2.5-mm Volume versus 0.625-mm Volume (cm3) | 5-mm Volume versus 0.625-mm Volume (cm3) | 10-mm Volume versus 0.625-mm Volume (cm3) | |
| Mean difference* | −4.0 [−0.97 (%)] | −4.8 [−1.09 (%)] | −24.7 [−5.95 (%)] |
| Standard deviation of differences | 3.7 [0.73 (%)] | 6.4 [1.53 (%)] | 9.5 [2.02 (%)] |
| 95% limits of agreement | −11.2, +3.3 [−2.40, +0.47 (%)] | −17.3, +7.6 [−4.09, +1.90 (%)] | −43.3, −6.2 [−9.92, −1.98 (%)] |
| Width of 95% limits of agreement | 14.5 [2.86 (%)] | 24.9 [5.99 (%)] | 37.1 [7.94 (%)] |
| 95% CI for the bias | −5.7, −2.2 [−1.31, −0.62 (%)] | −7.8, −1.9 [−1.81, −0.38 (%)] | −29.2, −20.3 [−6.90, −5.00 (%)] |
| 95% CI for the lower limit of agreement | −14.2, −8.3 [−2.98, −1.81 (%)] | −22.4, −12.2 [−5.31, −2.87 (%)] | −50.9, −35.7 [−11.54, −8.30 (%)] |
| 95% CI for the upper limit of agreement | +0.3, +6.3 [−0.12, +1.05 (%)] | +2.5, +12.7 [+0.68, +3.13 (%)] | −13.7, +1.4 [−3.60, −0.36 (%)] |
| Variable | Lateral segment (S2, S3) |
||
|---|---|---|---|
| 2.5-mm Volume versus 0.625-mm Volume (cm3) | 5-mm Volume versus 0.625-mm Volume (cm3) | 10-mm Volume versus 0.625-mm Volume (cm3) | |
| Mean difference* | −3.2 [−1.33 (%)] | −2.2 [−0.98 (%)] | −16.8 [−7.18 (%)] |
| Standard deviation of differences | 3.1 [1.26 (%)] | 4.4 [1.86 (%)] | 9.6 [4.05 (%)] |
| 95% limits of agreement | −9.2, +2.8 [−3.81, +1.15 (%)] | −10.9, +6.4 [−4.63, +2.67 (%)] | −35.6, +2.0 [−15.1, +0.76 (%)] |
| Width of 95% limits of agreement | 12.0 [4.96 (%)] | 17.4 [7.29 (%)] | 37.7 [15.87 (%)] |
| 95% CI for the bias | −4.6, −1.8 [−1.92, −0.74 (%)] | −4.3, −0.2 [−1.85, −0.11 (%)] | −21.3, −12.3 [−9.07, −5.28 (%)] |
| 95% CI for the lower limit of agreement | −11.7, −6.8 [−4.82, −2.80 (%)] | −14.5, −7.4 [−6.11, −3.14 (%)] | −43.3, −27.9 [−18.35, −11.87 (%)] |
| 95% CI for the upper limit of agreement | +0.3, +5.2 [+0.13, +2.16 (%)] | +2.9, +10.0 [+1.18, +4.16 (%)] | −5.7, +9.7 [−2.48, +4.00 (%)] |
Note. – CI = confidence interval.
Differences were calculated by subtracting the volume on 0.625-mm images from the volumes on 2.5-, 5-, or 10-mm image
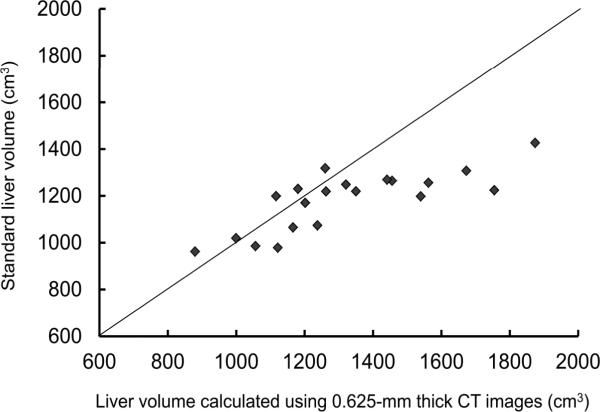
Figure 5 shows scatter plots of estimated whole liver volumes on 0.625-mm images versus standard liver volumes as calculated from body surface area. The formula for standard liver volume described by Urata et al underestimated liver volume especially for patients with a liver volume of more than 1400 cm3.
Fig. 5.
Scatter plots of estimated whole liver volumes on 0.625-mm images versus standard liver volumes as calculated from body surface area.
DISCUSSION
Researchers reported that a liver recipient with a graft-to-recipient weight ratio of less than 0.8% had a significantly lower chance of survival.17 Therefore, if a preoperatively expected graft-to-recipient weight ratio is approximately 0.8%, surgeons sometimes want to know the value with greater accuracy. In this regard, it is desirable for us to estimate the degree of error due to various factors. Although it could be expected that volumes calculated by using 0.625-mm 3D images would be more precise than those by using thicker images due to a lesser partial volume effect for 3D images, it has been unclear how much difference would be produced in volume calculation by using 3D data. This promoted us to conduct this study, and it is the first detailed report in which the effects of slice thickness were quantitatively evaluated, ranging from 0.625 mm (i.e., isotropic 3D data) to 10 mm, on the calculated liver volume. Our study showed that the liver volume calculated based on CT volumetry increased as the slice thickness decreased probably due to reducing errors from partial volume effects. Although some previous researches on CT or magnetic resonance organ volumetry showed a similar tendency11,18–20, isotropic 3D image data was not included in those researches. Our data would be useful for estimating and improving the accuracy of CT liver volumetry.
Maximum differences in calculated volume between 0.625-mm and thicker images can be estimated by using the 95% limits of agreement values in Table 4; these were −17.8 cm3 (−1.3%) for 2.5-mm, −26.8 cm3 (−2.2%) for 5-mm, and −78.0 cm3 (−6.2%) for 10-mm images for whole liver; −10.6 cm3 (−1.2%) for 2.5-mm, −25.3 cm3 (−3.0%) for 5-mm, and −50.2 cm3 (−6.0%) for 10-mm images for right lobe; −11.2 cm3 (−2.4%) for 2.5-mm, −17.3 cm3 (−4.1%) for 5-mm, and −43.3 cm3 (−9.9%) for 10-mm images for left lobe; and −9.2 cm3 (−3.8%) for 2.5-mm, −10.9 cm3 (−4.6%) for 5-mm, and −35.6 cm3 (−15.1%) for 10-mm images for lateral segment. These values agree with our rough estimations based on numerical simulation. Values in percentage were larger for partial liver than for whole liver. This suggests that the effects of slice thickness on volume calculation would be relatively-larger for smaller size objects. For lateral segment (i.e. the smallest graft), the value in percentage was approximately -5%. Based on our results, if a maximum error of 5% in the graft volume is acceptable and in a range that would not have clinical impact, it can be stated that 5-mm thick images are acceptable for CT liver volumetry and that 0.625-mm 3D images are not required. In contrast, if an error of 5% in the graft volume is unacceptable, 3D data could be essential for CT volumetry.
Reported results of the accuracy of CT liver volumetry show a deviation from reference standard ranging from 0% to more than 30%6–10, although none of these results was based on CT liver volumetry by using 3D image data. Nakayama et al9 reported that mean liver volume calculated from liquid-displacement measurement after the surgical operation was larger only by 2.4% than that calculated by preoperative manual CT volumetry for liver recipients who underwent living-related liver transplantation. Our data suggest that this small degree of error might be explained by the effect of slice thickness to some extent, because Nakayama et al used 5-mm images in their study. On the other hand, Lemke et al reported that the mean liver volume calculated during the surgical operation was smaller by 34% than that calculated by preoperative CT volumetry for living-donor right liver lobes on 7.5-mm images.10 Our data suggest that the large degree of error reported by Lemke et al cannot be explained by the effects of slice thickness. A number of causes of error have been suggested, such as the imaging technique and partial volume effects, hepatic physical density, the exact contour and segment recognition, intraoperative drainage of liquids from the liver, and hepatic volume deviations.10 The difference between the preoperative assumed liver cutting line and the actual cutting line in donor liver resection is also one of the various potential causes for errors. Lemke et al speculated that the influence of perfusion on liver volume could account for the large discrepancy they reported.10 Meanwhile, with advanced cirrhosis there often is associated decreased portal venous flow, which is the predominant source of blood volume to the liver. Therefore, the pathologic variation in size and weight from in vivo to in vitro would be lessened with greater degrees of portal hypertension. This could cause reported small discrepancies in the study by Nakayama et al in which most of their subjects had cirrhotic livers. The relative significance of the above various potential factors which can cause measurement errors in CT liver volumetry could depend on the degree of liver disease.
Since 3D images have a lesser partial volume effect, it would be reasonable that volumes calculated by using 0.625-mm 3D images would be more precise than those by using 5-mm images. However, more time and effort are required if we use 0.625-mm 3D images instead of 5-mm images, because the number of images is eight times more with 0.625-mm 3D images than with 5-mm images. In other words, it could potentially take eight times more time to draw the boundaries. In fact, the average time required for completing manual correction was 98 minutes for 0.625-mm 3D images in this study, whereas the processing time by manual segmentation is usually 20–50 minutes for 5-mm images.9, 14 Therefore, radiologists/surgeons should try to achieve a good balance between accuracy and workload. The knowledge derived from this study can be helpful in finding the optimal slice thickness in clinical practice.
Considering that the widths of the 95% limits of agreement for calculated liver volumes were narrow (i.e., 1.18% on 2.5-mm, 2.58% on 5-mm, and 3.96% on 10-mm images for whole liver), we might be able to estimate liver volumes with greater accuracy on thicker images by compensating calculated values using the mean volume differences as some researchers proposed.10, 20–22 However, because the mean differences between the calculated volumes on 3D images and on thicker images could depend on many factors such as CT scanners, reconstruction algorithms, or window settings, further investigation would be needed before this compensation technique is employed.
Some researchers reported that actual liver volumes were smaller than those calculated by CT volumetry.7, 10, 22 This phenomenon has been explained by the effects of physiologic perfusion on liver volume or the intraoperative drainage of liquids from the liver. On the other hand, our results showed that calculated liver volumes on 0.625-mm 3D images were significantly larger than the volumes on thicker images. Therefore, there might be a possibility that liver volumes calculated on 3D images could show a larger degree of error compared to those on thicker images. If 3D images are planned to be used for CT liver volumetry, this possible paradoxical effect should be kept in mind.
This study had several limitations. First, there were no surgical specimens obtained for direct comparison in this study. However, because our purpose in the study was to evaluate a relationship between slice thickness and calculated volume on CT liver volumetry, we were afraid that comparison between the calculated volume and the surgically evaluated one would make things more complicated. Second, only one radiologist was involved in CT liver volumetry. However, because the interobserver variation of CT volumetry is considered to be small23, we believe that this was unlikely to be a substantial limitation.
In conclusion, the liver volume calculated based on CT volumetry significantly increases as the slice thickness decreases. With current technologies, this has potential implications for radiologists/surgeons work effort to accomplish. If a maximum error of 5% in the calculated graft volume is within the range of having an insignificant clinical impact, 5-mm thick images are acceptable for CT liver volumetry. However, if an error of 5% is unacceptable, 3D data could be essential for CT volumetry.
Acknowledgments
This study was partially supported by (anonymized). The authors thank (anonymized) for his efforts in developing the software tools used in this research.
Financial support: Partially supported by the NIH S10 RR021039 and P30 CA14599.
Abbreviations
- CT
Computed tomography
- 3D
three-dimensional
- 2D
two-dimensional
References
- 1.Heymsfield SB, Fulenwider T, Nordlinger B, Barlow R, Sones P, Kutner M. Accurate measurement of liver, kidney, and spleen volume and mass by computerized axial tomography. Ann Intern Med. 1979;90:185–187. doi: 10.7326/0003-4819-90-2-185. [DOI] [PubMed] [Google Scholar]
- 2.Kawasaki S, Makuuchi M, Matsunami H, Hashikura Y, Ikegami T, Chisuwa H, et al. Preoperative measurement of segmental liver volume of donors for living related liver transplantation. Hepatology. 1993;18:1115–1120. [PubMed] [Google Scholar]
- 3.Wang F, Pan KT, Chu SY, Chan KM, Chou HS, Wu TJ, Lee WC. Preoperative estimation of the liver graft weight in adult right lobe living donor liver transplantation using maximal portal vein diameters. Liver Transpl. 2011;17:373–380. doi: 10.1002/lt.22274. [DOI] [PubMed] [Google Scholar]
- 4.Soejima Y, Shimada M, Suehiro T, Hiroshige S, Ninomiya M, Shiotani S, et al. Outcome analysis in adult-to-adult living donor liver transplantation using the left lobe. Liver Transpl. 2003;9:581–586. doi: 10.1053/jlts.2003.50114. [DOI] [PubMed] [Google Scholar]
- 5.Taner CB, Dayangac M, Akin B, Balci D, Uraz S, Duran C, et al. Donor safety and remnant liver volume in living donor liver transplantation. Liver Transpl. 2008;14:1174–1179. doi: 10.1002/lt.21562. [DOI] [PubMed] [Google Scholar]
- 6.Sakamoto S, Uemoto S, Uryuhara K, Kim I, Kiuchi T, Egawa H, et al. Graft size assessment and analysis of donors for living donor liver transplantation using right lobe. Transplantation. 2001;71:1407–1413. doi: 10.1097/00007890-200105270-00009. [DOI] [PubMed] [Google Scholar]
- 7.Hiroshige S, Shimada M, Harada N, Shiotani S, Ninomiya M, Minagawa R, et al. Accurate preoperative estimation of liver-graft volumetry using three-dimensional computed tomography. Transplantation. 2003;75:1561–1564. doi: 10.1097/01.TP.0000053755.08825.12. [DOI] [PubMed] [Google Scholar]
- 8.Frericks BB, Caldarone FC, Nashan B, Savellano DH, Stamm G, Kirchhoff TD, et al. 3D CT modeling of hepatic vessel architecture and volume calculation in living donated liver transplantation. Eur Radiol. 2004;14:326–333. doi: 10.1007/s00330-003-2161-8. [DOI] [PubMed] [Google Scholar]
- 9.Nakayama Y, Li Q, Katsuragawa S, Ikeda R, Hiai Y, Awai K, et al. Automated hepatic volumetry for living related liver transplantation at multisection CT. Radiology. 2006;240:743–748. doi: 10.1148/radiol.2403050850. [DOI] [PubMed] [Google Scholar]
- 10.Lemke AJ, Brinkmann MJ, Schott T, Niehues SM, Settmacher U, Neuhaus P, Felix R. Living donor right liver lobes: preoperative CT volumetric measurement for calculation of intraoperative weight and volume. Radiology. 2006;240:736–742. doi: 10.1148/radiol.2403042062. [DOI] [PubMed] [Google Scholar]
- 11.Reiner CS, Karlo C, Petrowsky H, Marincek B, Weishaupt D, Frauenfelder T. Preoperative liver volumetry: how does the slice thickness influence the multidetector computed tomography- and magnetic resonance-liver volume measurements? J Comput Assist Tomogr. 2009;33:390–397. doi: 10.1097/RCT.0b013e3181806c29. [DOI] [PubMed] [Google Scholar]
- 12.Urata K, Kawasaki S, Matsunami H, Hashikura Y, Ikegami T, Ishizone S, et al. Calculation of child and adult standard liver volume for liver transplantation. Hepatology. 1995;21:1317–1321. [PubMed] [Google Scholar]
- 13.Sethian JA. Level Set Methods and Fast Marching Methods. Cambridge University Press; Cambridge: 1996. [Google Scholar]
- 14.Suzuki K, Kohlbrenner R, Epstein ML, Obajuluwa AM, Xu J, Hori M. Computer-aided measurement of liver volumes in CT by means of geodesic active contour segmentation coupled with level-set algorithms. Med Phys. 2010;37:2159–2166. doi: 10.1118/1.3395579. [DOI] [PMC free article] [PubMed] [Google Scholar]
- 15.Bland JM, Altman DG. Statistical methods for assessing agreement between two methods of clinical measurement. Lancet. 1986;1:307–310. [PubMed] [Google Scholar]
- 16.Bland JM, Altman DG. Measuring agreement in method comparison studies. Stat Methods Med Res. 1999;8:135–160. doi: 10.1177/096228029900800204. [DOI] [PubMed] [Google Scholar]
- 17.Kiuchi T, Kasahara M, Uryuhara K, Inomata Y, Uemoto S, Asonuma K, et al. Impact of graft size mismatching on graft prognosis in liver transplantation from living donors. Transplantation. 1999;67:321–327. doi: 10.1097/00007890-199901270-00024. [DOI] [PubMed] [Google Scholar]
- 18.Berthelet E, Liu M, Truong P, Czaykowski P, Kalach N, Yu C, et al. CT slice index and thickness: impact on organ contouring in radiation treatment planning for prostate cancer. J Appl Clin Med Phys. 2003;4:365–373. doi: 10.1120/jacmp.v4i4.2511. [DOI] [PMC free article] [PubMed] [Google Scholar]
- 19.Hermoye L, Laamari-Azjal I, Cao Z, Annet L, Lerut J, Dawant BM, Van Beers BE. Liver segmentation in living liver transplant donors: comparison of semiautomatic and manual methods. Radiology. 2005;234:171–178. doi: 10.1148/radiol.2341031801. [DOI] [PubMed] [Google Scholar]
- 20.Emirzeoglu M, Sahin B, Selcuk MB, Kaplan S. The effects of section thickness on the estimation of liver volume by the Cavalieri principle using computed tomography images. Eur J Radiol. 2005;56:391–397. doi: 10.1016/j.ejrad.2005.04.008. [DOI] [PubMed] [Google Scholar]
- 21.Karlo C, Reiner CS, Stolzmann P, Breitenstein S, Marincek B, Weishaupt D, Frauenfelder T. CT- and MRI-based volumetry of resected liver specimen: comparison to intraoperative volume and weight measurements and calculation of conversion factors. Eur J Radiol. 2010;75:e107–111. doi: 10.1016/j.ejrad.2009.09.005. [DOI] [PubMed] [Google Scholar]
- 22.Yoneyama T, Asonuma K, Okajima H, Lee KJ, Yamamoto H, Takeichi T, et al. Coefficient factor for graft weight estimation from preoperative computed tomography volumetry in living donor liver transplantation. Liver Transpl. 2011;17:369–372. doi: 10.1002/lt.22239. [DOI] [PubMed] [Google Scholar]
- 23.Sandrasegaran K, Kwo PW, DiGirolamo D, Stockberger SM, Jr., Cummings OW, Kopecky KK. Measurement of liver volume using spiral CT and the curved line and cubic spline algorithms: reproducibility and interobserver variation. Abdom Imaging. 1999;24:61–65. doi: 10.1007/s002619900441. [DOI] [PubMed] [Google Scholar]


