Abstract
Recognizing that tuberculosis (TB) is still the leading cause of human death from a curable infection, the international health community has set ambitious targets for disease control. One target is to eliminate TB by 2050; that is, to cut the annual incidence of new cases to less than 1 per million population. National TB control programmes are working to eliminate TB mainly by intensifying efforts to find and cure patients with active disease. Here, we use mathematical modelling to show that, while most TB patients can be cured with present drug regimens, the 2050 target is far more likely to be achieved with a combination of diagnostics, drugs and vaccines that can detect and treat both latent infection and active disease. We find that the coupling of control methods is particularly effective because treatments for latent infection and active disease act in synergy. This synergistic effect offers new perspectives on the cost-effectiveness of treating latent TB infection and the impact of possible new TB vaccines. Our results should be a stimulus to those who develop, manufacture and implement new technology for TB control, and to their financial donors.
Keywords: diagnostics, drugs, vaccines, latent infection, cost-effectiveness
1. Introduction
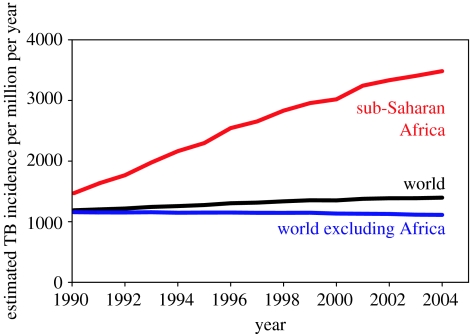
During the 1990s, the global incidence rate of TB was increasing mainly due to the spread of the human immunodeficiency virus (HIV) in sub-Saharan Africa (figure 1; Dye 2006). By 2005, the incidence rate had stabilized or was falling slowly in all six regions defined by the World Health Organization (WHO), including Africa, and was therefore probably falling in the world as a whole (World Health Organization 2007). As the global epidemic peaked at an estimated 1400 cases per million population per year, TB remained among the top 10 causes of ill health and death worldwide (Lopez et al. 2006). The response by the WHO and the Stop TB Partnership was to extend the targets for TB control beyond those specified within the United Nations Millennium Development Goals (United Nations Statistics Division 2007), setting out a strategy and a plan for halving prevalence and death rates by 2015 (compared with 1990 levels; Raviglione & Uplekar 2006; Stop TB Partnership & World Health Organization 2006). Both the Stop TB strategy and the Global Plan to Stop TB (2006–2015) are based on the diagnosis and treatment of active TB, though there is a supporting role for preventive therapy (drug treatment of latent infection), especially for people co-infected with Mycobacterium tuberculosis and HIV. The WHO also recommends BCG vaccination, but this is mainly to protect young children against miliary and meningeal disease and is not expected to have any significant impact on transmission or on the greater burden of pulmonary disease among adults (World Health Organization 2001). Beyond 2015, the internationally agreed goal is to eliminate TB by 2050, that is, to cut the annual incidence of new cases to less than 1 per million population (Dye et al. 2006). There are no specific recommendations on the combination of interventions that should be used to eliminate TB by mid-century; however, the Global Plan anticipates that a suite of new diagnostics, drugs and vaccines will become available over the next decade (Stop TB Partnership & World Health Organization 2006).
Figure 1.
TB epidemic trends in the world (black), sub-Saharan Africa (red) and world excluding sub-Saharan Africa (blue). Series are the estimated incidence rates per million population per year, based on country case reports (World Health Organization 2007). The TB incidence rate increased by an annual average of 6% in Africa between 1990 and 2005, but fell by 0.7% annually in the rest of the world.
In this paper, we investigate the prospects for eliminating TB through conventional programmes of drug treatment, used in combination with other possible methods of control. To do this we focus on the world excluding sub-Saharan Africa. The TB problem outside Africa is dominated by the most populous, highly endemic Asian countries, which accounted for more than half of all new cases arising worldwide in 2005 (World Health Organization 2007). If TB cannot be eliminated in Asia, it will not be possible to eliminate TB globally. But if TB control in Asia is a success, the current diagnostics, drugs and systems for implementing chemotherapy programmes will have passed a major test. In either event, TB control in sub-Saharan Africa presents an even greater challenge: incidence in many African countries has been pushed up dramatically by high levels of HIV co-infection, to which the response is a combination of methods for the joint control of TB and HIV/AIDS that go well beyond the core elements of the WHO strategy (Nunn et al. 2005).
Based on mathematical modelling, we argue that the goal of eliminating TB by the mid-century is most likely to be achieved if current treatment programmes can be coupled with new approaches to reduce the vast reservoir of latent human infection. This is not simply a matter of achieving greater impact by adding one intervention to another; rather, the coupling of control methods exploits synergistic interactions between interventions—synergies that have apparently not been reported in previous studies of combined interventions (Blower et al. 1996; Murray & Salomon 1998). The analysis offers a new perspective on the cost-effectiveness of treating latent TB infection and throws further light on the mechanism of action and impact of potential new vaccines.
2. Methods
2.1 Mathematical model of TB
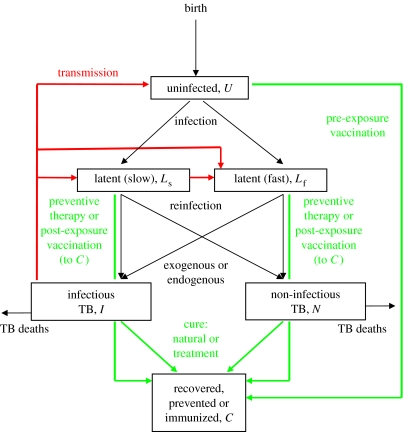
We developed an age-structured mathematical model, based on earlier TB models (Blower et al. 1996; Vynnycky & Fine 1997; Dye et al. 1998), that describes how people acquire M. tuberculosis infection, move into the latent state and progress to active disease. The natural history of TB is outlined in figure 2 and the corresponding series of differential equations, programmed in berkeley madonna, is given in appendix A.
Figure 2.
Flow chart of the TB model. Red lines show the direction of effective transmission; all groups are exposed to infection, but there are significant aetiological, clinical or epidemiological consequences only for those people who are uninfected (U) or latently infected (Ls or Lf). Children and adults, for whom the natural history of TB is qualitatively similar but quantitatively different, are distinguished in the model but not in this diagram. Green lines show the possible transitions due to vaccination and drug treatment. Those who are successfully vaccinated are immunized for life. People are lost by death from all six groups, but only TB deaths are shown.
2.2 Methods of TB control
There are three ways to control TB: (i) prevent infection, here by vaccinating uninfected people (pre-exposure, U removed at rate α per person per year), (ii) prevent progression from latent infection to active TB, here by drug treatment or post-exposure vaccination (Ls or Lf removed at rate τ per person per year to the cured class C, without the possibility of relapse), and (iii) treat active TB (I or N detected and removed by chemotherapy at a rate of δ per person per year, with a proportion κ cured, set to the WHO target of 0.85). The initial value of δ was 0.5 per person per year (i.e. average duration of illness of 2 years in the absence of any other process of removal), reflecting the fact that treatment programmes have been in place in most countries for many years and applies to both infectious and non-infectious TB. All people who are successfully vaccinated or treated move to the cured class (C) where they remain until death. Thus, successful prevention and treatment, and self-cure, is assumed to give lifelong protection.
Parameter δ has recently been termed the ‘patient detection rate’ (Borgdorff 2004). While the removal of patients from the pool of prevalent cases is a convenient device in modelling, and we use it here, the standard measure of detection in the literature on TB control is the WHO ‘case detection rate’, which is the number of sputum smear-positive patients detected in 1 year divided by the estimated number of smear-positive cases arising in that year (δ×prevalence/incidence). This index is therefore a ratio rather than a rate and can take values greater than 100%. For certain values of δ at specific moments in time, we give the equivalent WHO case detection rates.
2.3 Sensitivity analysis
The key statistic relevant to elimination is the TB incidence rate. We carried out a univariate sensitivity analysis (as available in Berkeley Madonna) to investigate the way in which equilibrium TB incidence (per million population) depended on proportional (0.1%) changes in model parameter values. Sensitivity is calculated as the change in the equilibrium incidence rate per million population divided by the change in the value of the relevant parameter.
3. Results
3.1 Fitting the model to endemic TB
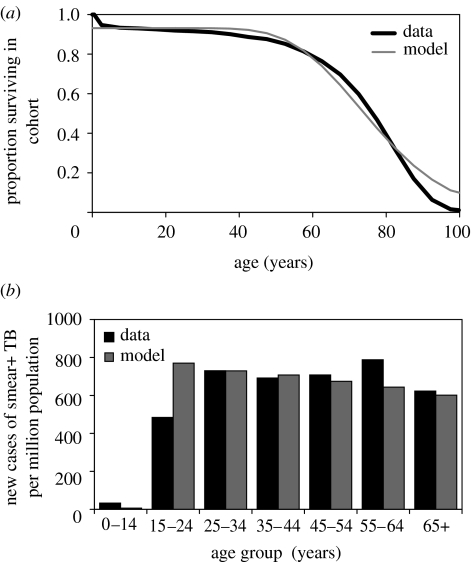
For the world excluding sub-Saharan Africa, the estimated annual incidence rate was approximately 1200 per million in 1990 dropping to approximately 1100 per million in 2005, a slow annual decline of 0.7% (World Health Organization 2007). We fitted the age-structured mathematical model to data describing the worldwide epidemiology of TB, excluding HIV co-infection and sub-Saharan Africa. The fitted model generated a steady-state incidence rate of 1034 new TB cases per million population, an annual risk of infection of approximately 1% per person per year (exactly 0.97%) and a prevalence of infection of 30%, which are consistent with available data and estimates (Dye et al. 1999; Bourdin Trunz et al. 2006; World Health Organization 2007). It also replicated the observed survivorship of people living in the developing world and the distribution by age of sputum smear-positive cases (figure 3). These model results, matching the data, were produced by detecting and treating δ=0.5 prevalent TB cases/year (i.e. an average duration of illness of 2 years), which is equivalent to a WHO case detection rate of 60%, as estimated for 2005 (§2; World Health Organization 2007). While 2 years appears to be a long average duration for a treatable, life-threatening illness, it is confirmed by surveys that find prevalence/incidence ratios of 2 or more in endemic countries, even in areas where drugs are available (Tuberculosis Research Centre 2001).
Figure 3.
(a) Age-dependent survival in the human population, with the model fitted (grey curve) to the combined survival cures of India and China (black curve; Murray et al. 2002). These and other Asian countries account for an estimated 56% of all new TB cases arising each year. (b) Fit of the model (grey bars) to the incidence of sputum smear-positive TB cases by age (black bars), as estimated for 2005 (World Health Organization 2007).
3.2 Epidemiological impact of drug treatment for active TB
The emphasis in many analyses of infectious disease control is on reducing transmission so that the basic case reproduction number, R0, is replaced by a net reproduction number, R, which has a value less than the threshold of 1 (Anderson & May 1991; Diekmann & Heesterbeek 2000). This guarantees the extinction of infection. For TB, because R0 is in the order of 2–5 (Blower et al. 1995; Vynnycky & Fine 1998; Dye & Williams 2000), this goal is not difficult to achieve in treatment programmes. However, to eliminate TB on a time scale of half a century, the task is not simply to ensure that incidence falls, but that it falls sufficiently quickly.
The dominant method of TB control at present is the treatment of active disease by chemotherapy (Raviglione & Uplekar 2006). The impact of drug treatment in forcing down incidence depends critically on the incremental increase in case detection and cure rates. If the detection rate of TB cases (both infectious and non-infectious) is increased from δ=0.5 per patient per year (equilibrium value) to 0.6 per patient per year at the start of an improved programme of treatment in 2007, and the cure rate maintained at 0.85 (equivalent to the targets of 70% detection and 85% cure set by the WHO; Dye et al. 2006), the incidence rate would be reduced by an average of 4% annually during the first decade of control, and approximately halved by 2050 (to 465 per million). A reduction of this magnitude, and on a large geographical scale, would be a substantial achievement for public health, but it leaves an incidence rate in 2050 that is still far above the elimination target of 1 per million.
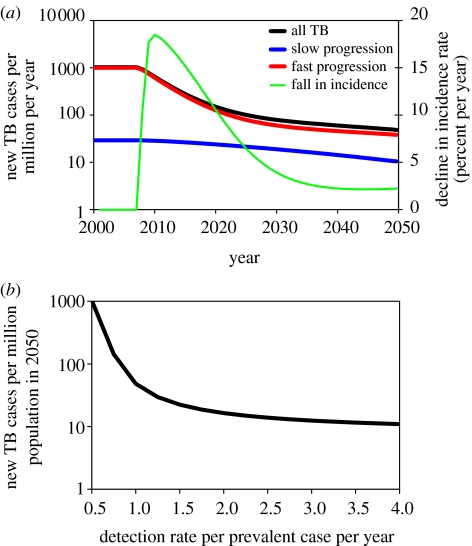
For countries outside sub-Saharan Africa, the incidence rate must fall at an average of 16% annually from 2007 onwards in order to reach the elimination target. As shown in figure 4a, this rate of decline could in principle be achieved during the first 10 years of control with a detection rate of δ=1 per patient per year, but it cannot be sustained. In the example shown in figure 4a, the incidence rate falls by an average of 8% each year during the second decade of control, and by only 3% each year in the third decade. This slowing of the rate of decline has also been seen in practice, for example across western Europe in the second half of the twentieth century (Styblo 1991; Dye et al. 1998). The reason for the slowdown is that, as transmission and incidence fall, a growing proportion of cases arises from the slow reactivation of long-standing latent infections (Stewart et al. 2003), rather than from the rapid progression of recent infections (figure 4a). Thus, the initial rate of decline in incidence is controlled by primary progression, but the long-term rate of decline is governed by reactivation.
Figure 4.
(a) Trajectory of TB incidence in a control programme that treats active TB, beginning in 2007. The total incidence rate per million population per year (black line, left axis, logarithmic scale) pre-control was approximately the same as for the world excluding sub-Saharan Africa. The red and blue lines distinguish, respectively, cases arising from recent infection or reinfection (fast progression) and from the reactivation of latent infection (slow progression). The detection rate of active TB cases (δ=0.6) was assumed to be constant between 2007 and 2050, and case detection and cure rates initially reached the target values set by the WHO. In the early stages of the treatment programme, the incidence rate fell by up to 18% annually (green line, right axis), but the rate of decline slowed thereafter. (b) TB incidence per million population in 2050, as a function of the detection rate, δ.
Higher rates of case detection will obviously cause the incidence to decrease more rapidly, but even very high rates of detection, rarely achieved in practice, cannot bring the incidence rate close to 1 per million by 2050. Figure 4b shows that, with this model, the incidence rate in 2050 falls to a minimum of approximately 10 per million at very high rates of case detection (up to δ=4 per patient per year). In other words, conventional programmes of drug treatment for active TB can reduce the incidence rate by a factor of 100 on this time scale, but not by a factor of 1000, as required to meet the agreed target.
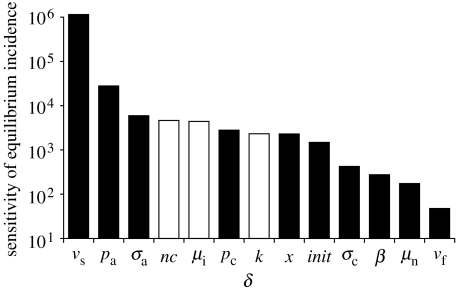
Our conclusion that the 2050 target cannot be reached by the treatment of active TB alone does not depend on the choice of model parameter values. In univariate sensitivity analysis, the equilibrium incidence rate is most dependent on parameters that determine the rate of reactivation of latent TB (νs) and the proportion of infections that progress rapidly to active TB (pa; figure 5). We chose extreme values of these two parameters (νs=0.0005 per patient per year and pa=0.25) so as to obtain the greatest possible impact of drug treatment, and refitted the model to the original equilibrium by adjusting β (to a value of 7.25 per person per year). Then, with δ=2 per patient per year, incidence was reduced to 4 per million in 2050 instead of 16 per million (figure 4b), that is, still above the elimination threshold.
Figure 5.
Univariate sensitivity analysis of model parameters. The vertical axis shows the change in equilibrium incidence per million per year divided by 0.1% of the value of the relevant parameter, as described in §2. Black bars are increases in equilibrium incidence and white bars are decreases.
While lower values of νs allow a bigger impact of chemotherapy, the true value of νs is likely to be higher, rather than lower, than the point estimate used for the calculations in this paper. A literature review carried out for a previous study placed νs in the range of 0.0001–0.0003 per patient per year (Dye et al. 1998).
3.3 Combining interventions to control TB
The rate at which TB incidence falls can be enhanced by using combinations of control methods. Besides drug treatment for active TB there are, in principle, two other possible approaches to control: the first is to prevent infection by (pre-exposure) vaccination, and the second is to stop the progression from latent infection to active disease (reactivation) through preventive drug therapy or post-exposure vaccination.
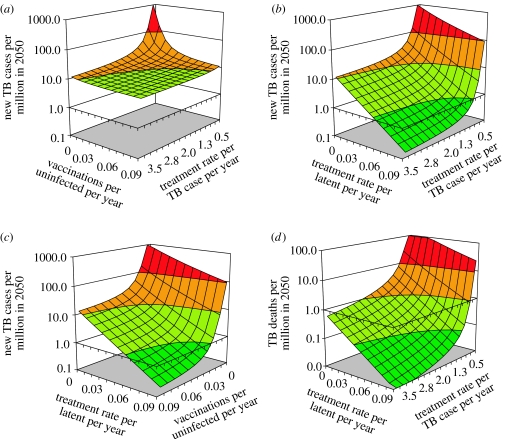
We investigated the impact of combining pre-exposure vaccination with the treatment of patients with active TB, again by calculating the expected incidence rates in 2050 (figure 6a). The effects of the two approaches were similar when used alone, and intensifying either control method yielded diminishing returns (as shown in figure 4b). These calculations show that the two methods are more effective in combination, but the additional impact is small. This is because drug treatment to stop transmission at source has the same effect as vaccinating to protect those who are exposed to infection. One intervention partly substitutes for the other; they do not act independently or synergistically.
Figure 6.
Pairwise combinations of three control methods to control TB, starting from an annual incidence of 1034 per million population. Surfaces show the expected incidence rates in 2050 with (a) pre-exposure vaccination and treatment of active TB, (b) treatment of latent infection and active TB, (c) treatment of latent infection and pre-exposure vaccination, and (d) as for (b), but with TB death rate as the outcome. Colours in (a)–(c) indicate ranges of incidence rates per million population reached by 2050: <1 (dark green, below elimination threshold), <10 (light green), <100 (orange) and ≥100 (red). Since there are fewer TB deaths than cases, the colour scale in (d) is shifted by a factor of 10.
Far greater impact can be achieved by combining interventions that attack different aetiological pathways, that is, by blocking both the fast (progressive primary) and slow (reactivation of latent infection) routes to developing active TB. The treatment of latent TB, either by preventive drug therapy or by post-exposure vaccination, is relatively ineffective when used alone, but powerful and synergistic in combination with the treatment of active TB (figure 6b) or with pre-exposure vaccination (figure 6c). When these combined approaches are implemented intensively, TB incidence can be forced below the elimination threshold by 2050. In the examples shown in figure 6b (treatment of latent infection or post-exposure vaccination) and figure 6c (pre-exposure vaccination), incidence was reduced to approximately 0.2 per million by 2050, which is approximately seven times lower than expected if the two interventions acted independently.
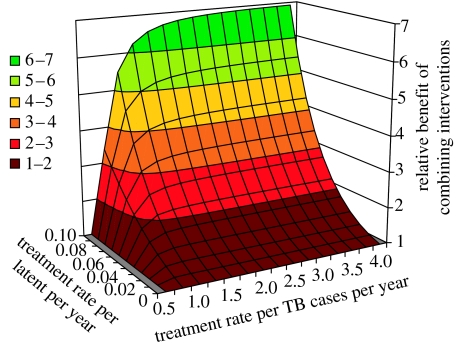
Figure 7 reveals that the synergistic effect of combining interventions operates at lower treatment rates. For example, when the treatment rate of latent infection reaches τ=0.05 per infected person per year, a patient detection rate of δ=1 per patient per year cuts incidence by more than twice as much as would be expected if the two interventions acted independently.
Figure 7.
Synergistic effect of treating both latent infection and active TB. The results in figure 4b are presented as the relative benefits, in terms of reduced incidence, attributable to the two interventions acting in synergy. The relative benefit is calculated from the incidence rates in 2050 (I250) obtained by: [I250 when treating active TB only]×[I250 when treating latent infection only]/[I250 when combining interventions].
Although these synergistic effects can be obtained by vaccinating or treating less than 10% of eligible people per year (a or δ<0.1 per person per year), there are two caveats. First, vaccination and the treatment of latent infection are preventive, and many treatments are ‘wasted’ on people who are not destined to develop active TB. To obtain a given reduction in incidence, the number of people vaccinated, or latent infections treated, must be greater than the number of TB patients treated. For example, with a detection rate of active TB of δ=1 per patient per year, latent infections must be treated at 0.095 per year to achieve a TB incidence rate of 1 per million in 2050. To reach the target with this combination of interventions requires the treatment of 2600 TB patients and 230 000 people with latent infection between 2007 and 2050.
Second, while the elimination target is expressed in terms of incident TB cases, we also want to minimize the number of TB deaths. Figure 6d shows that higher rates of detection of active TB cases are proportionally more effective in cutting TB deaths than in reducing incidence. As an illustration, setting the detection rate at δ=2 per patient per year leads to a 78-fold reduction in TB incidence rate by 2050, but the TB death rate is reduced 167-fold, more than twice as much.
4. Discussion
Current treatment programmes for active TB could, if vigorously pursued, cut TB incidence by a factor of up to 100 before 2050. However, the rapid reduction of incidence by this means alone demands rates of case detection that have not yet been achieved on a large geographical scale (World Health Organization 2007). Even if very high case detection rates can be achieved, our calculations suggest that TB will not be eliminated by mid-century—to reach that target requires the annual TB incidence rate to be cut by a factor of 1000. This is most likely to be achieved by a joint attack on both active TB and latent infection. Because there is more latent infection than active TB in every country in the world, this general strategy should be widely applicable.
These conclusions, as derived in this paper, apply to the world excluding sub-Saharan Africa. We have focused here on TB elimination outside sub-Saharan Africa because 70% of the people who develop TB each year live elsewhere and the challenge of eliminating TB in Africa has been made still more difficult by the high TB incidence rates attributable to HIV co-infection.
While sub-Saharan Africa is conspicuously different from other regions owing to the scale of the HIV epidemic, there are other obstacles to TB elimination in Africa and elsewhere. Drug resistance is one example. Any attempt to make accurate predictions of the absolute time to elimination—going beyond the general and comparative arguments presented here—would need to account for the diminished efficacy of drugs in the face of local patterns of resistance (Aziz et al. 2006; Shah et al. 2007) and the epidemiological characteristics of drug-resistant strains (Dye et al. 2002; Cohen et al. 2003). In the context of this study, however, additional problems such as HIV co-infection and drug resistance strengthen our argument for combining interventions.
All models simplify reality, and we have made simplifications in this study that tend to favour drug-treatment programmes for active TB. Our assumptions are therefore conservative with respect to our main findings. The impact of drug treatment on the model epidemics described in this paper is more immediate than expected in practice because we assumed that the intervention reaches the whole population instantaneously; this could not happen on a large scale in reality. We also assumed that TB cases arising from recent infection (primary progression) emerge within a year of exposure, rather than the observed 1–3 years post-infection (Sutherland 1968; Vynnycky & Fine 1997). Despite these simplifying assumptions, TB could not be eliminated before 2050 by drug treatment alone, no matter how high the rate of case detection is.
To supplement the sensitivity analysis carried out in this study, we explored the consequences of relaxing two structural assumptions in the model that (i) human survival is dependent on age and (ii) patients who have been successfully treated for TB can never suffer a second episode. These changes lead to small quantitative differences in the results, but have no bearing on our main conclusions (details are available from the authors on request). However, our model also assumes that people who complete a course of treatment for latent infection cannot be reinfected. This is an optimistic view of the efficacy of preventive therapy which may not be satisfied in practice. Consequently, the challenge of eliminating TB is likely to be greater than that portrayed by our calculations. This simply underlines the need for combinations of interventions to combat TB.
Given the results presented in this paper, there are strong reasons to (re)consider ways in which active TB and latent infection could be treated in combination. First, in terms of the absolute reduction in incidence, a combination of interventions will probably be needed, sooner or later, to reach the elimination target. Second, with respect to the modes of action of control methods, interventions that affect two different aetiological pathways—the slow and fast routes to developing active TB—will act in synergy. The synergy arises because the reduction of TB incidence is essentially biphasic: the first, more rapid phase of decline is governed by transmission and primary progression, and the second, slower phase is controlled by reactivation. More effort given to reducing transmission shortens the first phase and lengthens the second and, over a given time period, there are greater proportional reductions in incidence during both phases.
Isoniazid preventive therapy (IPT), the current method of treating latent TB infection, is cheap, highly efficacious and has few side effects (Cohn & El-Sadr 2000). However, IPT has never been used on a large scale because uptake and compliance with the nine-month treatment schedule tend to be poor among overtly healthy people who have only a 5–10% lifetime risk of developing active disease (Fitzgerald & Menzies 2003; O'Brien 2003; Horsburgh 2004). Besides, IPT, as a single intervention carried out at the population level, is known to be cost-ineffective compared with treating TB patients (Dye & Floyd 2006). Our finding that IPT acts in synergy with conventional treatment programmes means that it should also be more cost-effective when used in combination. The consequences of this synergistic interaction have not yet been explored in cost-effectiveness analysis.
The procedures for carrying out preventive therapy will certainly have to be simplified if treatment is to be carried out more widely, and our results provide some incentive for developing new approaches. To refine preventive therapy first requires a diagnostic test for latent infection that is more sensitive and specific than the current tuberculin skin test and yet easy to administer and read. That need might be satisfied, in part, by one or more members of the family of interferon-γ release assays (Pai et al. 2006; Richeldi 2006). Following the diagnosis of infection, treatment uptake and compliance would probably improve if the course can be made shorter than nine months. In this context, a three-month treatment regimen now appears feasible with combinations of drugs such as isoniazid and rifapentine (Schechter et al. 2006). Better still, it may be possible to target preventive therapy more effectively by developing a test to identify which infected people are at relatively high risk of progressing to active disease (Andersen et al. 2007).
Immunization is the other main option for improved TB control, and our results throw further light on the attributes of possible new TB vaccines. TB control by immunization certainly requires a vaccine that is superior to the widely used BCG (Bacille–Calmette–Guérin), for which efficacy is variable and often negligible in preventing pulmonary disease in adults, including the most infectious forms of the disease (Fine 2001; Andersen & Doherty 2005). The two types of vaccine described in this paper prevent either new infections (pre-exposure) or the reactivation of latent infections (post-exposure), and each has an advantage and a disadvantage. Pre-exposure vaccines have a greater impact than post-exposure vaccines when used alone, but substitute for the effects of treating active TB. Therefore, a pre-exposure vaccine will be most useful as an addition to treating patients when the detection rate of active TB cases is low and vice versa. Post-exposure vaccines have a relatively small impact when used alone but, like preventive drug therapy, act in synergy with the treatment of active TB (Young & Dye 2006).
In sum, conventional programmes of chemotherapy must continue to be implemented vigorously so as to cut TB burden in the coming years. For the time being, the WHO Stop TB strategy remains the cornerstone of global TB control. However, the treatment of active TB, as a single strategy, is unlikely to bring incidence down to 1 per million population by 2050, even with very high rates of case detection. A simultaneous attack on both active TB and latent infection would markedly increase the chance of eliminating this disease during the twenty-first century.
Acknowledgments
We thank an anonymous berkeley madonna programmer for tips on coding. This study was funded as part of the routine work carried out by the authors at the World Health Organization.
Appendix A. Age-structured model of tuberculosis
The following six groups of differential equations were programmed in berkeley madonna (Berkeley Madonna 2007), and the full programme is available as electronic supplementary material.
Uninfected:
Latent (slow progression to active TB):
Latent (fast progression to active TB):
Active TB infectious:
Active TB non-infectious:
Cured:
We assume that homogeneously mixing individuals in a model human population affected by TB belong exclusively to one of the above six groups. The population, P, scaled to constant size 1, consists of i=1, …, m age classes. The notation dU[1 … m]/dt, for example, represents the derivative of the proportion of people uninfected (U) with respect to time, t, arranged in a vector containing the m age classes. This allows us to distinguish differences in the natural history of TB between children (n groups among m) and adults (m−n groups), and to allow for human survival rates that depend on age.
Uninfected (U) people acquire M. tuberculosis infection following contact at rate β with contagious individuals (I), expressed in the transmission term βUI/P=βUI. A fraction pc (of infected children) or pa (of infected adults) move into the latent (fast) class (Lf), from which they break down relatively rapidly (at rate νf) to active disease; fractions 1−pc (children) or 1−pa (adults) go into the latent (slow) class (Ls). For those in class Ls, the progression to active TB is much slower on average (endogenous reactivation at rate νs), but can be accelerated by (exogenous) reinfection (βLsI), which moves them into class Lf, provided infection overcomes the partial immunity acquired from the primary infection, measured by proportion x.
Active disease is either infectious pulmonary TB (arising in fractions of σc children or σa adults), in which most patients have a positive sputum smear on microscopic examination), or non-infectious pulmonary or extrapulmonary TB (fraction 1−σc or 1−σa). Patients with active TB have an elevated death rate, which is higher for infectious (μi) than for non-infectious disease (μn), and much higher than the mortality rate from all other causes (μ). Infectious TB cases are predominantly sputum smear positive. Before drugs became available to treat TB, a proportion of patients self-cured. In this model, patients self-cure at rate nc. Birth and death rates are equal so the total population, P, remains constant. A small proportion of human TB cases are caused by mycobacteria other than M. tuberculosis, especially Mycobacterium bovis, but they are not relevant to this analysis. We also do not consider the impact of HIV on TB (which is to increase incidence further above the elimination target).
Point estimates of parameters are given in table 1. Parameter values used for this investigation are generally within the bounds used for similar TB models in previous analyses (Dye et al. 1998; Dye & Williams 2000). The value of the contact rate, β, was manually adjusted to obtain the required equilibrium incidence rate. The value of the mortality rate, μ, was fitted with the number of age classes, m, to survival curves for China and India (Murray et al. 2002) by minimizing the r.m.s. deviation with ‘curve fitter’ in Berkeley Madonna (figure 3a). The time step for numerical integration was 0.02 years, and integration was carried out with a fourth-order Runge–Kutta algorithm. With these methods and parameter values, the model generates an equilibrium incidence rate of 1034 per million per year, which is close to the estimate for the world excluding sub-Saharan Africa (figure 1), and the starting point for evaluating the impact of various control methods.
Table 1.
Definitions and values of model parameters. (Parameters are numbers (age classes), proportions or rates (per person per year). Control variables are defined in the text.)
| parameters | point value | definition |
|---|---|---|
| β | 13 | average number of contacts made annually between each infectious TB patient and all other individuals in the population (value adjusted to fit equilibrium incidence) |
| μ | 0.013 | death rate from causes other than TB |
| μi | 0.25 | death rate from infectious TB |
| μn | 0.1 | death rate from non-infectious TB |
| m | 20 | number of age classes (used with μ to construct an age-dependent survivorship curve) |
| n | 3 | number of age classes occupied by children |
| nc | 0.1 | rate at which TB patients self-cure (in the absence of chemotherapy) |
| νf | 0.9 | rate at which latently infected people progress to active TB, fast (f, progressive primary disease) or slow (s, endogenous reactivation) |
| νs | 0.00011 | |
| pc | 0.05 | proportion of newly infected people, children or adults, who develop progressive primary TB (whether infectious or non-infectious) |
| pa | 0.15 | |
| σc | 0.1 | proportion of patients, children or adults, who develop infectious pulmonary TB |
| σa | 0.6 | |
| x | 0.35 | proportion of (exogenously) reinfected latents who develop active TB |
Supplementary Material
Berkeley Madonna programme
References
- Andersen P, Doherty T.M. The success and failure of BCG—implications for a novel tuberculosis vaccine. Nat. Rev. Microbiol. 2005;3:656–662. doi: 10.1038/nrmicro1211. [DOI] [PubMed] [Google Scholar]
- Anderson R.M, May R.M. Oxford University Press; Oxford, UK: 1991. Infectious diseases of humans: dynamics and control. [Google Scholar]
- Andersen P, Doherty T.M, Pai M, Weldingh K. The prognosis of latent tuberculosis: can disease be predicted? Trends Mol. Med. 2007;13:175–182. doi: 10.1016/j.molmed.2007.03.004. [DOI] [PubMed] [Google Scholar]
- Aziz M.A, et al. Epidemiology of antituberculosis drug resistance (the global project on anti-tuberculosis drug resistance surveillance): an updated analysis. Lancet. 2006;368:2142–2154. doi: 10.1016/S0140-6736(06)69863-2. [DOI] [PubMed] [Google Scholar]
- Berkeley Madonna. Berkeley-Madonna: modeling and analysis of dynamic systems. University of California; Berkeley, CA: 2007. [Google Scholar]
- Blower S.M, McLean A.R, Porco T.C, Small P.M, Hopewell P.C, Sanchez M.A, Moss A.R. The intrinsic transmission dynamics of tuberculosis epidemics. Nat. Med. 1995;1:815–821. doi: 10.1038/nm0895-815. [DOI] [PubMed] [Google Scholar]
- Blower S.M, Small P.M, Hopewell P.C. Control strategies for tuberculosis epidemics: new models for old problems. Science. 1996;273:497–500. doi: 10.1126/science.273.5274.497. [DOI] [PubMed] [Google Scholar]
- Borgdorff M. New measurable indicator for tuberculosis case detection. Emerg. Infect. Dis. 2004;10:1523–1528. doi: 10.3201/eid1009.040349. [DOI] [PMC free article] [PubMed] [Google Scholar]
- Bourdin Trunz B, Fine P, Dye C. Effect of BCG vaccination on childhood tuberculous meningitis and miliary tuberculosis worldwide: a meta-analysis and assessment of cost-effectiveness. Lancet. 2006;367:1173–1180. doi: 10.1016/S0140-6736(06)68507-3. [DOI] [PubMed] [Google Scholar]
- Cohen T, Sommers B, Murray M. The effect of drug resistance on the fitness of Mycobacterium tuberculosis. Lancet Infect. Dis. 2003;3:13–21. doi: 10.1016/S1473-3099(03)00483-3. [DOI] [PubMed] [Google Scholar]
- Cohn D.L, El-Sadr W.M. Treatment of latent tuberculosis infection. In: Reichman L.B, Hershfield E.S, editors. Tuberculosis: a comprehensive international approach. Marcel Dekker; New York, NY: 2000. pp. 471–502. [Google Scholar]
- Diekmann O, Heesterbeek J.A.P. Wiley series in mathematical and computational biology. Wiley; Chichester, UK: 2000. Mathematical epidemiology of infectious diseases: model building analysis and interpretation. [Google Scholar]
- Dye C. Global epidemiology of tuberculosis. Lancet. 2006;367:938–940. doi: 10.1016/S0140-6736(06)68384-0. [DOI] [PubMed] [Google Scholar]
- Dye C, Floyd K. Tuberculosis. In: Jamison D.T, Breman J.G, Measham A.R, Alleyne G, Claeson M, Evans D.B, Jha P, Mills A, Musgrove P, editors. Disease control priorities in developing countries. Oxford University Press; Washington, DC: 2006. pp. 289–309. [Google Scholar]
- Dye C, Williams B.G. Criteria for the control of drug-resistant tuberculosis. Proc. Natl Acad. Sci. USA. 2000;97:8180–8185. doi: 10.1073/pnas.140102797. [DOI] [PMC free article] [PubMed] [Google Scholar]
- Dye C, Garnett G.P, Sleeman K, Williams B.G. Prospects for worldwide tuberculosis control under the WHO DOTS strategy. Directly observed short-course therapy. Lancet. 1998;352:1886–1891. doi: 10.1016/S0140-6736(98)03199-7. [DOI] [PubMed] [Google Scholar]
- Dye C, Scheele S, Dolin P, Pathania V, Raviglione M.C. Global burden of tuberculosis: estimated incidence, prevalence, and mortality by country. J. Am. Med. Assoc. 1999;282:677–686. doi: 10.1001/jama.282.7.677. [DOI] [PubMed] [Google Scholar]
- Dye C, Williams B.G, Espinal M.A, Raviglione M.C. Erasing the world's slow stain: strategies to beat multidrug-resistant tuberculosis. Science. 2002;295:2042–2046. doi: 10.1126/science.1063814. [DOI] [PubMed] [Google Scholar]
- Dye C, Maher D, Weil D, Espinal M, Raviglione M. Targets for global tuberculosis control. Int. J. Tuberc. Lung Dis. 2006;10:460–462. [PubMed] [Google Scholar]
- Fine P.E.M. BCG vaccines and vaccination. In: Reichman L.B, Hershfield E.S, editors. Tuberculosis: a comprehensive international approach. Marcel Dekker; New York, NY: 2001. pp. 503–522. [Google Scholar]
- Fitzgerald M, Menzies D. Interpretation of the tuberculin skin test. In: Davies P.D.O, editor. Clinical tuberculosis. Arnold; London, UK: 2003. pp. 323–336. [Google Scholar]
- Horsburgh C.R. Priorities for the treatment of latent tuberculosis infection in the United States. New Engl. J. Med. 2004;350:2060–2067. doi: 10.1056/NEJMsa031667. [DOI] [PubMed] [Google Scholar]
- Lopez A.D, Mathers C.D, Ezzati M, Jamison D.T, Murray C.J.L, editors. Global burden of disease and risk factors. Oxford University Press and The World Bank; New York, NY: 2006. [PubMed] [Google Scholar]
- Murray C.J.L, Salomon J.A. Modeling the impact of global tuberculosis control strategies. Proc. Natl Acad. Sci. USA. 1998;95:13 881–13 886. doi: 10.1073/pnas.95.23.13881. [DOI] [PMC free article] [PubMed] [Google Scholar]
- Murray C.J.L, Lopez A.D, Ahmad O.B, Inoue M, Ferguson B.D, Salomon J.A, Hill K.H. World Health Organization; Geneva, Switzerland: 2002. World mortality in 2000: life tables for 191 countries. [Google Scholar]
- Nunn P, Williams B.G, Floyd K, Dye C, Elzinga G, Raviglione M.C. Tuberculosis control in the era of HIV. Nat. Rev. Immunol. 2005;5:819–826. doi: 10.1038/nri1704. [DOI] [PubMed] [Google Scholar]
- O'Brien R.J. Treatment of latent tuberculosis infection. In: Davies P.D.O, editor. Clinical tuberculosis. Arnold; London, UK: 2003. pp. 307–322. [Google Scholar]
- Pai M, Kalantri S, Dheda K. New tools and emerging technologies for the diagnosis of tuberculosis: part I. Latent tuberculosis. Expert Rev. Mol. Diagn. 2006;6:413–422. doi: 10.1586/14737159.6.3.413. [DOI] [PubMed] [Google Scholar]
- Raviglione M.C, Uplekar M.W. WHO's new stop TB strategy. Lancet. 2006;367:952–955. doi: 10.1016/S0140-6736(06)68392-X. [DOI] [PubMed] [Google Scholar]
- Richeldi L. An update on the diagnosis of tuberculosis infection. Am. J. Resp. Crit. Care Med. 2006;174:736–742. doi: 10.1164/rccm.200509-1516PP. [DOI] [PubMed] [Google Scholar]
- Schechter M, Zajdenverg R, Falco G, Barnes G.L, Faulhaber J.C, Coberly J.S, Moore R.D, Chaisson R.E. Weekly rifapentine/isoniazid or daily rifampin/pyrazinamide for latent tuberculosis in household contacts. Am. J. Resp. Crit. Care. 2006;173:922–926. doi: 10.1164/rccm.200512-1953OC. [DOI] [PMC free article] [PubMed] [Google Scholar]
- Shah N.S, et al. Worldwide emergence of extensively drug-resistant tuberculosis. Emerg. Infect. Dis. 2007;13:380–387. doi: 10.3201/eid1303.061400. [DOI] [PMC free article] [PubMed] [Google Scholar]
- Stewart G.R, Robertson B.D, Young D.B. Tuberculosis: a problem with persistence. Nat. Rev. Microbiol. 2003;1:97–105. doi: 10.1038/nrmicro749. [DOI] [PubMed] [Google Scholar]
- Stop TB Partnership & World Health Organization. Stop TB Partnership; Geneva, Switzerland: 2006. The Global Plan to Stop TB, 2006–2015. [Google Scholar]
- Styblo K. KNCV Tuberculosis Foundation; The Hague, The Netherlands: 1991. Epidemiology of tuberculosis. [Google Scholar]
- Sutherland, I. 1968 The ten-year incidence of clinical tuberculosis following “conversion” in 2550 individuals aged 14 to 19 years. Tuberculosis Surveillance and Research Unit progress report, KNCV, The Hague, The Netherlands.
- Tuberculosis Research Centre. Trends in the prevalence and incidence of tuberculosis in South India. Int. J. Tuberc. Lung Dis. 2001;5:142–157. [PubMed] [Google Scholar]
- United Nations Statistics Division 2007 Millennium indicators database, vol. 2007.
- Vynnycky E, Fine P.E.M. The natural history of tuberculosis: the implications of age-dependent risks of disease and the role of reinfection. Epidemiol. Infect. 1997;119:183–201. doi: 10.1017/S0950268897007917. [DOI] [PMC free article] [PubMed] [Google Scholar]
- Vynnycky E, Fine P.E.M. The long-term dynamics of tuberculosis and other diseases with long serial intervals: implications of and for changing reproduction numbers. Epidemiol. Infect. 1998;121:309–324. doi: 10.1017/S0950268898001113. [DOI] [PMC free article] [PubMed] [Google Scholar]
- World Health Organization. BCG in immunization programmes. Wkly. Epidemiol. Rec. 2001;76:33–40. [PubMed] [Google Scholar]
- World Health Organization. World Health Organization; Geneva, Switzerland: 2007. Global tuberculosis control: surveillance, planning, financing. [Google Scholar]
- Young D.B, Dye C. The development and impact of tuberculosis vaccines. Cell. 2006;124:683–687. doi: 10.1016/j.cell.2006.02.013. [DOI] [PubMed] [Google Scholar]
Associated Data
This section collects any data citations, data availability statements, or supplementary materials included in this article.
Supplementary Materials
Berkeley Madonna programme


