Abstract
A hallmark pattern of activity in developing nervous systems is spontaneous, synchronized network activity. Synchronized activity has been observed in intact spinal cord, brainstem, retina, cortex and dissociated neuronal culture preparations. During periods of spontaneous activity, neurons depolarize to fire single or bursts of action potentials, activating many ion channels. Depolarization activates voltage-gated calcium channels on dendrites and spines that mediate calcium influx. Highly synchronized electrical activity has been measured from local neuronal networks using field electrodes. This technique enables high temporal sampling rates but lower spatial resolution due to integrated read-out of multiple neurons at one electrode. Single cell resolution of neuronal activity is possible using patch-clamp electrophysiology on single neurons to measure firing activity. However, the ability to measure from a network is limited to the number of neurons patched simultaneously, and typically is only one or two neurons. The use of calcium-dependent fluorescent indicator dyes has enabled the measurement of synchronized activity across a network of cells. This technique gives both high spatial resolution and sufficient temporal sampling to record spontaneous activity of the developing network.
A key feature of newly-forming cortical and hippocampal networks during pre- and early postnatal development is spontaneous, synchronized neuronal activity (Katz & Shatz, 1996; Khaziphov & Luhmann, 2006). This correlated network activity is believed to be essential for the generation of functional circuits in the developing nervous system (Spitzer, 2006). In both primate and rodent brain, early electrical and calcium network waves are observed pre- and postnatally in vivo and in vitro (Adelsberger et al., 2005; Garaschuk et al., 2000; Lamblin et al., 1999). These early activity patterns, which are known to control several developmental processes including neuronal differentiation, synaptogenesis and plasticity (Rakic & Komuro, 1995; Spitzer et al., 2004) are of critical importance for the correct development and maturation of the cortical circuitry.
In this JoVE video, we demonstrate the methods used to image spontaneous activity in developing cortical networks. Calcium-sensitive indicators, such as Fura 2-AM ester diffuse across the cell membrane where intracellular esterase activity cleaves the AM esters to leave the cell-impermeant form of indicator dye. The impermeant form of indicator has carboxylic acid groups which are able to then detect and bind calcium ions intracellularly.. The fluorescence of the calcium-sensitive dye is transiently altered upon binding to calcium. Single or multi-photon imaging techniques are used to measure the change in photons being emitted from the dye, and thus indicate an alteration in intracellular calcium. Furthermore, these calcium-dependent indicators can be combined with other fluorescent markers to investigate cell types within the active network.
Keywords: Neuroscience, Issue 56, calcium, imaging, mouse, network, development, cortex, multiphoton
Protocol
1. Making horizontal entorhinal-hippocampal brain slices
Entorhinal-hippocampal brain slices are made using anatomical guides, detailed in a 3D overview of the region according to Canto, Wouterlood & Witter (2008) Neural Plasticity ID 3812439.
Make 500ml of slice solution, oxygenate with carbogen gas (95% oxygen, 5% carbon dioxide) for at least 20 minutes and then freeze 250ml until iced. Minutes before slicing, crush and blend the slice ice with the remaining 250ml bubbling slice solution to be used for dissection and for cutting in the slicing chamber.
Make 200ml of r-ACSF (recovery ACSF) and at least 500ml of e-ACSF (experimental ACSF) solution. Continuously oxygenate both solutions with carbogen gas (95% oxygen, 5% carbon dioxide) for at least 20 minutes before tissue preparation.
This protocol is valid for mice from postnatal day 0 up to a maximum of 3 weeks old. Decapitate the animal, according to local ethical committee procedures, and dissect out the brain quickly in a Petri dish containing ice-cold slice solution prepared in Step 1, above (see Table 1 for solutions & reagents).
Transfer the brain onto a filter paper soaked with slice solution and separate the two hemispheres with a sharp razor blade. Transfer one hemisphere back into ice-cold slice solution.
Remove the cerebellum of the other hemisphere. Flip the brain onto its midline and cut off the top of the brain with a slight angle towards the rostral end.
Flip the brain onto the cut (dorsal) surface and glue it onto the tissue holder of the slicer upside down by gently pushing with a cotton bud.
Slice 300 μm thick brain slices using a low frequency and speed in the remaining ice-cold slice solution made in Step 1. Under our conditions, we use a Thermo Fisher Scientific vibratome (Microm, HM 650V) at settings 0.05 mm/s and 36Hz.
As soon as a slice is cut, transfer it into a slice holder (submerged) containing oxygenated Artificial Cerebro Spinal Fluid (ACSF) (2.5mM Mg2+, 1.6mM Ca2+; see Table 2) at room temperature. A higher magnesium concentration in r-ACSF reduces the influx of calcium into neurons via NMDA receptors following slicing and in our experience, leads to a better quality of slices for experiments. If needed, cut the second cerebral hemisphere afterwards.
Leave the slices for one hour to recover.
| Slice solution (in mM) – 10 | |
| 110 | choline chloride |
| 25 | NaHCO3 |
| 11.6 | 11.6 |
| 10 | D-glucose |
| 7 | MgCl2 |
| 3.1 | sodiumpyruvate |
| 2.5 | KCl |
| 1.25 | NaH2PO4 |
| 0.5 | CaCl2 |
Table 1. Recipe for slice solution.
| ACSF (in mM) | |
| 125 | NaCl |
| 26 | NaHCO3 |
| 10 | D-glucose |
| 3 | KCl |
| 2.5/1.5 | MgCl2 (recovery/experiment) |
| 1.6 | CaCl2 |
| 1.25 | NaH2PO4 |
Table 2. Recipe for both recovery (r-ACSF) and experimental (e-ACSF) solution.
2. Preparation of the staining chamber
To load the cells with the calcium-dependent indicator or cell-specific marker, slices need to be transferred to a chamber for the staining procedure. Although commercial chambers may be available, one can easily be assembled from standard lab equipment for very little cost. The key features of such a chamber are that the slices are warmed to between 30 and 35°C, incubated in a continuously oxygenated medium and that the chamber is shielded from light.
Using a heated rod, make a small hole in the side wall of two disposable polystyrene petri dishes (35 and 100mm diameter) that is just big enough to allow a section of silicon tubing (diameter approx 1.5mm) to pass through.
Thread the silicon tubing through the hole in the small petri dish and form a loop inside the inner wall of the small dish.
Use superglue to seal the open end of the tubing and stick the rest of the tubing to the inner wall of the petri dish.
Using a needle, make fine holes at evenly-spaced intervals in the tubing within the inner petri dish.
Glue the smaller petri dish inside the larger one, with both holes aligned. Thread the other end of the silicon tubing through the hole in the wall of the larger petri dish.
For the interface dish, take a cell culture insert well with semi-permeable membrane and using a heated scalpel, cut the top 1cm away to leave a shallow dish to hold the slices during incubation.
On the lid of the larger petri dish, make a hole approx. 0.5-1cm diameter to allow for carbogen (95% O2, 5% CO2) to flow into the chamber.
Take a 5 or 10ml plastic syringe. Using a heated scalpel, make an angled cut to remove the end of the syringe and keep a few cm length of syringe tube with the tip. Using superglue, attach the cut surface of the syringe tube to the petri dish lid, over the 0.5-1cm diameter hole.
Attach silicon tubing and a tubing connector to the syringe tip. Attach another tubing connector to the silicon tubing entering the base of the petri dishes.
Connect up both tubes to a regulator for carbogen (95% O2, 5% CO2) supply. Place the staining chamber on a hot plate for incubation between 30-35°C. Ensure the chamber can be shielded from light during the entire incubation process. The staining chamber is now ready to assemble and use for slice incubation.
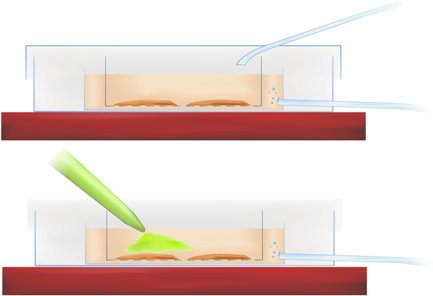 Methodology Figure 1. Cross-section of the staining chamber showing slice incubation (above) and application of calcium-sensitive indicator (pipetted green dye, below).
3. Staining of slices
Throughout any handling involving fluorescent dyes, avoid photobleaching by working with little light and keep the dye and the stained tissue in the dark between handling.
Put the staining chamber on a heat plate (35°C), connect it to a carbogen gas supply and fill it with approximately 1.5ml r-ACSF from the slice holder.
Place the interface dish in the staining chamber and fill it with 1ml ACSF.
Ensure a good carbogen supply in the staining chamber to keep the ACSF bubbling at a gentle, steady rate.
Add 9 μl DMSO and 1 μl pluronic acid (20% in DMSO stock solution, Invitrogen) into a vial of 50 μg Fura 2-AM. Vortex the dye mix for 15 minutes.
Transfer the slices into the interface dish and pipette the dye into the r-ACSF directly over the hippocampal and entorhinal cortex region of interest, as indicated in Methodology Figure 1 (above), achieving a final dye concentration of 50mM.
Close the lid of the staining chamber and incubate the dye for 20 - 40 minutes depending on the age of the animal (see Table 3).
Transfer the slices back into the slice holder.
| Age (postnatal days) | Incubation time (min) |
| <p8 | 20 |
| p8-p9 | 25 |
| p10-p11 | 30 |
| p12-13 | 35 |
| >p13 | 40 |
Table 3. Incubation times for different ages, empirically-determined in the lab.
4. Other dyes and older tissue
Perhaps due to increased myelination in the brain tissue, slices from older rodents do not take up Fura 2-AM ester that easily. To facilitate uptake of this dye a preincubation step using Cremophor EL (Sigma) is used for brains of mice at P13 and older11. Cremophor is a non-ionic surfactant used as an excipient in many pharmaceutical applications. Without this step, we find that cell-specific labelling is extremely poor and inconsistent throughout the cortical slice.
Transfer old slices into a shallow preincubation dish filled with 3ml r-ACSF and 8 μl 0.5% cremophor (Sigma) heated to 35°C for 3 minutes.
Transfer the slices into the interface dish and follow the normal staining procedure (Steps 4-7, see above).
Calcium dyes load both neurons and non-neurons in the slice preparation. To identify and distinguish between these cell types within the network, sulforhodamine 101 (SR101) can be used to label astrocytes within the slice.
Staining of slices for sulforhodamine 101
Follow steps 1-3 as before (section 3). Take 1 μl of 10mM stock solution of sulforhodamine (Sigma) from its storage at -20°C and dissolve in 999 μl r-ACSF to give a 10 μM solution. Pipette the purple dye over the slices as before (steps 5-7), leaving the slices incubating for a period of 15 minutes.
Microglia and endothelial cells are labelled using FITC tomato lectin dye
Follow steps 1-3 as before. Take 25 μl of 2mg/ml Lycopersicon esculentum (tomato) lectin FITC conjugate (L0401, Sigma) stock solution into 2.5ml r-ACSF to give 20 μg/ml concentration. Pipette the dye over the slices as before (steps 5-7), leaving the slices incubating for a period of 45 minutes.
Note, it is not possible to combine this dye with a calcium-sensitive indicator like Fura 2-AM or Oregon Green BAPTA-1 (OGB-1) that fluoresce in the green range of the spectrum since the photons from both dyes will be emitted at overlapping wavelengths. However, there are other calcium-indicator dyes such as Calcium orange, Fura Red that may be used in combination with appropriate filters or Texas-Red lectin conjugates to combine with calcium-indicator dyes in the green spectrum.
5. Attaching slices to recording chamber
During imaging slices need to be stable under the microscope. Usually a metal harp is placed to hold down the tissue but it can unevenly distort the surface of the slice, giving only part of the field of view for imaging in focus. To avoid this, slices are stuck to the recording chamber using Polyethylenimine (PEI).
Prepare the PEI solution (1ml Polyethyleneimine solution in 250ml boric buffer (table 4)). Make sure the PEI dissolves completely (stir overnight).
Fill the recording chambers with PEI solution so that the bottom is covered with fluid at least one hour before you want to apply the slices
Wash the recording chambers with distilled water and then with r-ACSF from the holding chamber.
Transfer one slice into a recording chamber.
Remove the r-ACSF with a pipette and position the slice in the middle using a brush.
Remove the r-ACSF around the slice using pieces of filterpaper. For stability and adherence, it is important that there is no ACSF around the slice anymore.
Pipette approximately 0.5-1ml ACSF, depending on the size of the recording chamber, onto the slice. ACSF should just cover the slice surface.
Put the recording chamber with the slice into a large humidified interface container, perfused with carbogen, and let the slices recover for at least one hour.
| PEI solution | |
| 1ml | Poly(ethyleneimine) solution |
| in 250ml boric buffer | |
| 40mM | boric acid |
| 10mM | sodium tetraborate decahydrate |
Table 4. Recipe PEI solution.
6. Imaging
Calcium-dependent indicator dyes can be imaged using either one- or two-photon microscopy. Use of two-photon imaging only activates indicator dye within the focal volume of the region of interest, thus reducing the amount of light scatter in the tissue. Furthermore, it enables better depth penetration of the light into the slice.
For functional calcium imaging we use a Titanium sapphire laser supplied by Coherent coupled to an Olympus microscope with a 20x objective (NA 0.95) and a Trimscope system by LaVision Biotec. The Trimscope system enables frame scanning with 64 beamlets simultaneously and is coupled with a Hamamatsu C9100 EM-CCD camera for fast frame-scanning rates.
Position the recording chamber under the microscope and establish a stable perfusion with imaging e-ACSF (1.6 Ca2+/1.5 Mg2+ ratio (table 2)) heated to a more physiological temperature of minimal 30°C.
Focus into the region of interest (ROI) using white light illumination. Avoid exposing the slice to light longer than necessary.
Choose the wavelength, imaging field of view, the scanning frequency, pixel density and additional software options applicable for the tissue and biological signals you wish to measure. For calcium network imaging with Fura 2-AM we typically choose a wavelength of 820nm, a 250x250 μm imaging field of view, a linescanning frequency of 1200Hz and 2-by-2 binning. This results in a frametime of about 100ms and thus an imaging frequency of about 10Hz.
Check if your ROI is in focus using a continuous scanning mode and selected wavelength of laserlight. Adjust focus and laser intensity to avoid pixel saturation and bleaching of your image.
Make a timelapse movie of your ROI. We typically acquire two timelapse movies of 2000 frames each.
For cell detection and identification, take a z-stack using a stepsize of 1 μm and image +/ 20 μm around your imaged plane of focus.
7. Representative results:
Successful loading of calcium indicators, Fura 2-AM are shown in Figure 1 in developing neocortical and entorhinal cortex networks using multiphoton imaging. Some dye is still present as background staining in the tissue but cell soma and in some cases, proximal dendrites are clearly visible and separate from surrounding neuropil. If loading has not been successful, very little cell-specific staining is observed and small clusters of dye spots are often visible on the slice surface in dead membrane debris.
In these screenshots, the network of cells is clearly visible in a single plane of focus for simultaneous cell imaging. Use of a metal harp or incomplete sticking of the slice to the recording chamber can result in an uneven slice surface to be imaged.
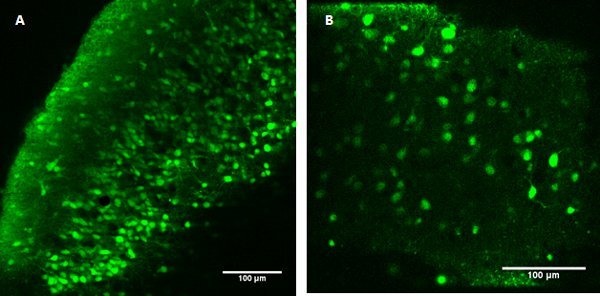 Figure 1. Fura 2-AM ester-loaded developing neocortical (A, left) and entorhinal (B, right) networks. Scale bars 100 μm. To separate neurons from astrocytes, co-application of sulforhodamine 101 with Fura 2-AM ester enables separation of cell types within the network.
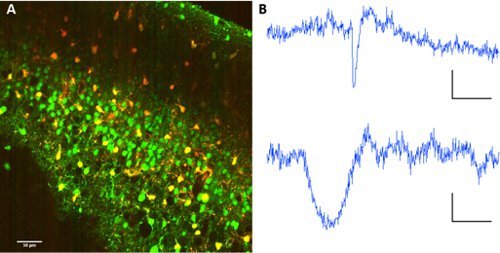 Figure 2. Astrocyte labeling with sulforhodamine 101. A Co-labelling of Fura 2-AM ester and sulforhodamine 101. Excitation wavelength: 820nm. Image collection on PMTs with dichroic mirror at 560/70nm for wavelength separation. B Representative fluorescence traces from a neuron (above) and an astrocyte (below). Scale bars 60 sec, ΔF 10 (au fluo).
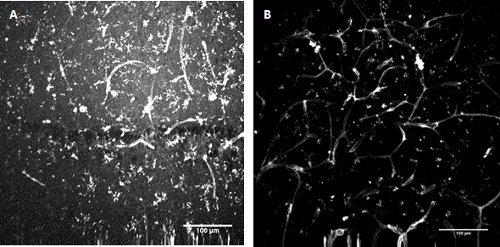 Figure 3. FITC-conjugated Lycopersicon esculentum (tomato) lectin staining. Labelling of microglia and endothelial cells in developing mouse hippocampus (A) and superficial entorhinal cortex (B).
Calcium indicator dyes are used to read-out activity from multiple cells simultaneously in developing cortical and hippocampal networks.
Figure 4. Dynamic calcium transients in hippocampal and cortical networks.
Movie 1: Fura 2-AM ester loading of mouse entorhinal cortex during second postnatal week. Click here to view movie 1.
Movie 2: Fura 2-AM ester loading of mouse hippocampus during the first postnatal week. Click here to view movie 2.
Movie 3: Fluo-4 loading of mouse cortex, during the first postnatal week. Click here to watch movie 3.
In the case of Fura 2-AM ester, cell activation involving a depolarization-induced influx of calcium, decreases dye fluorescence. For dyes such as Fluo-4, the opposite is true and cell depolarization is observed as an increase in photon emissions. Somatic calcium transients are mainly measured but activity in larger proximal dendrites can also be seen in some preparations, as shown in Movie 2.
Read-out of network activity can be quantified using commercial or in-house software scripts. In our lab, cell identification and network activity is measured and analyzed in a semi-automated manner using in-house code for Matlab (Mathworks).
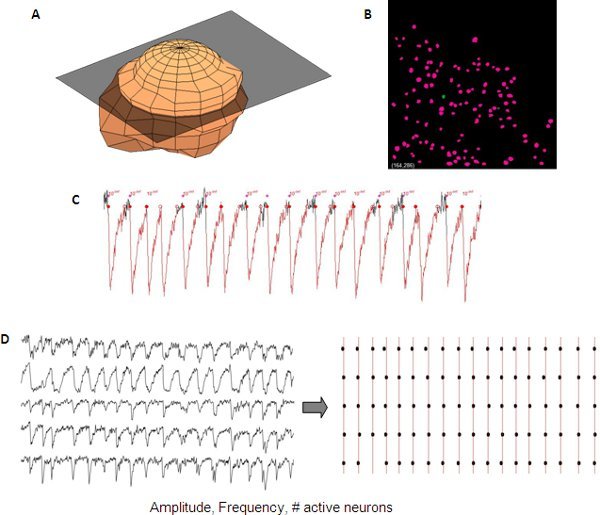 Figure 5. Representative analysis of synchronized calcium transients from a developing cortical network. 3D representation of one neuron (A) used to automatically create a neuron mask (B) from a z-stack for automated neuron detection. Measurements of calcium transients include amplitude, frequency and # of active cells that can be read out from single neuron data (C). Synchrony between different traces can be visualized using a raster plot (D).
Discussion
The methods we demonstrate here show suitable protocols for calcium imaging of network dynamics from identifiable cells within developing cortical and hippocampal networks in the mouse and also in the rat brain. These methods provide optimal spatial resolution to visualize a local network of cell somas simultaneously for measuring suprathreshold activity. Temporal resolution of network activity can be varied, depending on frame acquisition CCD camera settings, to optimize signal:noise measurements for long duration suprathreshold events, typically found in the developing nervous system. These protocols are not restricted to hippocampal and cortical networks but also label cells throughout the developing nervous system. The limitation of this method is that only suprathreshold activity can be recorded.
Disclosures
LaVision Biotec GmBH (Bielefeld, Germany) sponsored the submission fees of this manuscript article.
Acknowledgments
Work in the lab is supported by Nederlandse Organisatie voor Wetenschappelijk Onderzoek (NWO) (917.10.372) to RMM. JD is affiliated to the EU FP7 BrainTrain programme (www.brain-train.nl). We thank Pieter Laurens-Baljon and Sabine Schmitz (both CNCR, VU University Amsterdam) for images of FP multielectrode array waveforms and neuronal cultures used in the video sequence.
References
- Katz LC, Shatz CJ. Synaptic activity and the construction of cortical circuits. Science. 1996;274:1133–1138. doi: 10.1126/science.274.5290.1133. [DOI] [PubMed] [Google Scholar]
- Khazipov R, Luhmann HJ. Early patterns of electrical activity in the developing cerebral cortex of humans and rodents. Trends in Neurosciences. 2006;29:414–418. doi: 10.1016/j.tins.2006.05.007. [DOI] [PubMed] [Google Scholar]
- Spitzer NC. Electrical activity in early neuronal development. Nature. 2006;444:707–712. doi: 10.1038/nature05300. [DOI] [PubMed] [Google Scholar]
- Adelsberger H, Garaschuk O, Konnerth A. Cortical calcium waves in resting newborn mice. Nat. Neurosci. 2005;8:988–990. doi: 10.1038/nn1502. [DOI] [PubMed] [Google Scholar]
- Garaschuk O, Linn J, Eilers J, Konnerth A. Large-scale oscillatory calcium waves in the immature cortex. Nat. Neurosci. 2000;3:452–459. doi: 10.1038/74823. [DOI] [PubMed] [Google Scholar]
- Lamblin Electroencephalography of the premature and term newborn. Maturational aspects and glossary. Neurophysiol. Clin. 1999;29:123–219. doi: 10.1016/s0987-7053(99)80051-3. [DOI] [PubMed] [Google Scholar]
- Rakic P, Komuro H. The role of receptor/channel activity in neuronal cell migration. J. Neurobiol. 1995;26:299–315. doi: 10.1002/neu.480260303. [DOI] [PubMed] [Google Scholar]
- Spitzer NC, Root CM, Borodinsky LN. Orchestrating neuronal differentiation: patterns of Ca2+ spikes specify transmitter choice. Trends. Neurosci. 2004;27:415–421. doi: 10.1016/j.tins.2004.05.003. [DOI] [PubMed] [Google Scholar]
- Canto CB, Wouterlood FG, Witter MP. What does the anatomical organization of the entorhinal cortex tell us. Neural. Plast. 2008. pp. 381243–381243. [DOI] [PMC free article] [PubMed]
- Bureau I, Shepherd GM, Svoboda K. Precise development of functional and anatomical columns in the neocortex. Neuron. 2004;42:789–801. doi: 10.1016/j.neuron.2004.05.002. [DOI] [PubMed] [Google Scholar]
- Ikegaya Y, Le Bon-Jego M, Yuste R. Large-scale imaging of cortical network activity with calcium indicators. Neuroscience research. 2005;52:132–138. doi: 10.1016/j.neures.2005.02.004. [DOI] [PubMed] [Google Scholar]


