

Abstract
Purpose
Malignant cancer foci develop acidic extracellular environments. Mild acidic conditions trigger insertion and folding of the pH (low) insertion peptide (pHLIP™) across a cellular membrane, enabling targeting of such lesions.
Procedures
We employed optical imaging to follow targeting by fluorescent pHLIP given i.v. in mice. For visualization, Cy5.5 and Alexa750 were covalently attached to the N terminus of pHLIP, which stays outside of a cell membrane after transmembrane insertion.
Results
We demonstrate that pHLIP targets: (a) tumors of different origins established by subcutaneous injection of cancer cells, (b) spontaneous prostate tumors in TRAMP mice and (c) metastatic lesions in lung. pHLIP accumulation in tumors correlates with tumor aggressiveness. Within a tumor, it stains extracellular spaces and cellular membranes.
Conclusions
Tissue acidity can be detected by pHLIP peptide insertion and used to diagnose primary tumors, metastatic lesions, and lipid bodies in necrotic tissues. The ability of pHLIP to differentially bind metastatic and non-metastatic tumors may provide a new approach for evaluating cancer prognosis.
Keywords: Tumor acidity, Metastasis, Metastatic cancer, TRAMP, pHLIP, Fluorescence, Imaging, Membrane peptide
Introduction
Cells in malignant cancers exhibit an elevated uptake of glucose that leads to tumor acidosis from the Pasteur and Warburg effects [1–3]. Glucose uptake and acidosis show a positive correlation with a tumor’s aggressiveness and metastatic potential [4–7]. Therefore, extracellular acidity may be a useful biomarker to evaluate the prognosis of tumor development. The pH (low) insertion peptide (pHLIP) is a water-soluble membrane peptide that inserts and folds across a cellular membrane lipid bilayer in response to low pH [8–10]. Membrane-associated folding of pHLIP occurs within seconds [11] and is accompanied by a release of energy [12] that can be used to target acidic tumors in vivo and move cell-impermeable cargo-molecules across cellular membranes [10–14]. The extent of tumor labeling, measured by conjugating pHLIP with fluorescent and positron emission tomography (PET) imaging agents, is directly related to the level of acidity in tumors of various types established in mice [10, 13, 15].
Materials and Methods
Peptide Synthesis and Conjugation with Fluorescent Dyes
A pHLIP peptide with a single Cys residue near its N terminus (ACEQNPIYWARYADWLFTTPLLLLDLALLVDADET) was synthesized and purified by Dr. James I. Elliott at Yale University (New Haven, CT). Cy5.5-maleimide (GE Healthcare) and Alexa750-maleimide (Invitrogen) were used for the conjugation with pHLIP in DMF. The conjugated peptides were purified by high-performance liquid chromatography (HPLC). The concentration of each labeled peptide in buffer was determined by absorption, ε280=13,940 M−1cm−1 for pHLIP, ε674=250,000 M−1cm−1 for Cy5.5 and ε750=240,000 M−1cm−1 for Alexa750. The purity of the constructs was tested by analytical HPLC and SELDI-TOF mass spectrometry.
Tumor Models
HeLa, M4A4 (metastatic), and NM2C5 (non-metastatic) human cancer cells with stable green fluorescent protein (GFP) expression were purchased from ATCC. Primary tumors were established by subcutaneous injection of cancer cells (106 cells/flank/0.1 mL) of adult athymic nude mice from Harlan, Inc. TRAMP mice were obtained from the Jackson Laboratory at 4–5 weeks old. To establish metastases in lungs, M4A4 cancer cells were given as multiple tail vein injections, resulting in metastatic lung lesions; alternatively, a primary tumor was established by subcutaneous injection of M4A4 cancer cells and allowed to grow until it metastasized to the lungs.
Fluorescence Imaging of Mice and Separated Organs
Fluorescence (near infrared -NIR and GFP) imaging was performed on a Kodak Image Station In-Vivo FX system. A typical imaging procedure includes tail vein or i.p. injection of 1 mg/kg fluorescent pHLIP and imaging of mice at 4, 24, 48, and 72 h post-injection. The exposure time of Cy5.5 and Alexa750 imaging was 1 min. Imaging was performed while the animals were under gas anesthesia with supplemental heat provided to maintain core body temperature. The contrast index (CI) was calculated according to the equation:
where Fltumor and Flnorm are the fluorescence mean intensities of tumor and normal contra lateral region of the same area (muscle), respectively, and Flauto is the auto-fluorescence from the corresponding region measured from an animal that did not receive an injection of fluorescent pHLIP.
The contrast-to-noise ratio (CNR) was calculated according to the equation:
where Flb and SDb are the signal intensity and the standard deviation of the background.
Fluorescence Microscopy and Histology
Some tissue samples were examined immediately after dissection with an inverted epi-fluorescent microscope (IX71 Olympus). We also performed histological studies of tumors and organs. Tumors and organs were dissected and then fixed by 4% formalin in phosphate buffered saline (PBS) solution at pH 7.4 for 24 h at 4°C. Tissues were then rinsed with PBS and placed in a 30% sucrose PBS solution for at least 24 h at 4°C. Samples were mounted in optimal cutting temperature compound (Sakura Finetek, Torrance, CA) and frozen in dry ice or in a special folder in a Cryostat at −80°C. The temperature of mounted frozen samples was equilibrated with the in-working chamber temperature (−13°C) for 5–10 min. Samples were frozen only one time to minimize tissue damage. The tissue was sectioned at 10–20 μm in a Vibratome cryostat, and the tissue slices were placed on microscope slides coated with poly-lysine, dried in air, washed with deionized water and, in some cases, stained with DAPI (4′,6-diamidino-2-phenylindole) to observe cell nuclei. Each stained and dried section was covered with a drop of mounting medium (Permount®) and then a cover slip was placed over the medium. The slides were examined under the fluorescence microscope. To reduce out of focus light, a deconvolution microscopy technique was used. Z-sectioning was applied and optical slices were obtained using the ImagePro Plus deconvolution program.
Biodistribution and Blood clearance
Biodistribution data were obtained by measuring the mean intensity of each organ collected at various time points after fluorescent pHLIP injection. NIR and GFP fluorescent images and photos of tumors and organs were taken immediately after organ collection. Blood was collected postmortem by cutting the aorta immediately after euthanasia by CO2. Each blood sample was mixed with an equal volume of storage solution (10 mM Tris–HCl pH 7.5, 10 mM EDTA, 10% SDS).
Measurement of Tumor pH
Measurements of the pH in tumors were performed using a needle pH micro-electrode (MI-419 with a needle diameter of 0.8 mm) and reference electrode (MI-402; Microelectrodes, Inc.) [16]. The needle pH micro-electrode is inserted into the central part of a tumor, and the micro-reference electrode is placed into a nearby subcutaneous region. The pH is then measured in tumors and in the tumor-free contralateral regions. Ten mice were used in the study.
Processing of the Data
Tumor margins were established using the EdgeFinder program according to the algorithm published in Segala et al. [17]. All statistical analysis of the data was performed using “Statistica 5.0” package. The P level was computed based on the two-tailed test.
All animal studies were conducted according to an approved animal protocol (AN04-12-011), in compliance with the principles and procedures outlined in the National Institutes of Health Guide for the Care and Use of Animals.
Results
Targeting of Tumors by Fluorescent pHLIP Is Enhanced by Co-injection of Glucose
Our goals were to show targeting of spontaneous tumors and metastatic foci and to find whether the enhanced acidity of more aggressive tumors enhances targeting by fluorescent pHLIP.
To follow pHLIP in mice after i.v. or i.p. injections, we used two different fluorescent dyes, Cy5.5 and Alexa750, covalently attached to the N terminus of pHLIP, which stays outside of the membrane after transmembrane insertion. We observed a slightly higher contrast index (tumor/muscle ratio) with Alexa750 (Fig. 1), apparently due to a lower accumulation of this probe in normal tissue. Possible reasons for the difference between the probes include: (1) reduced tissue absorption due to the short-wavelength shift in absorption and emission of the Cy5.5 is in comparison with Alexa750 and (2) differences in the chemical properties of the dyes (Cy5.5 is more hydrophobic and accumulates in skin more than Alexa750). However, despite the differences, both dyes conjugated to pHLIP show pH-dependent tumor targeting.
Fig. 1.
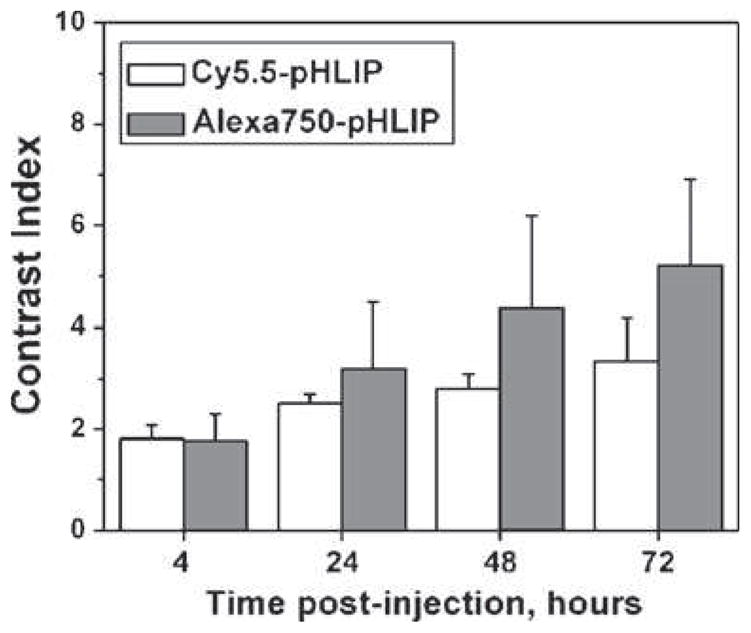
Alexa750-pHLIP and Cy5.5-pHLIP demonstrate slightly different contrast indices. The contrast index values calculated at different time points after administration of Cy5.5-pHLIP and Alexa750-pHLIP via tail vein are presented as mean±SD.
In the present study, we concentrate our attention to the targeting of small tumors (2–4 mm in diameter). By using GFP-expressing cancer cells, tumors were readily visualized, allowing assessment of the co-localization of GFP fluorescence and NIR emission of fluorescent pHLIP in vivo (Fig. 2). Figure 2a shows a representative set of fluorescence images and combined photo and GFP images obtained at different time points after tail vein injection of Cy5.5-pHLIP, Cy5.5-pHLIP with co-injection of glucose, and Cy5.5-K-pHLIP. Fluorescent pHLIP finds tumors in mice within the first 4 h and remains there for more than 72 h, exhibiting a progressive rise in contrast index from 2 to 5 (Fig. 2d). Previously, we demonstrated that feeding animals with bicarbonated water, which increases tissue pH [18, 19], correlates with a reduction of tumor targeting by pHLIP [15]. Here, we show a positive correlation between an increase of tumor targeting by pHLIP and intraperitoneal co-injection of 200 μl of a 25% solution of glucose (Fig. 2a, d, and Table 1). It has previously been demonstrated that the intracellular pH in a tissue is unaffected by glucose co-injection, whereas the average extracellular pH decreases after glucose administration and reaches a minimum level 0.3 pH units below the initial value [16]. As a consequence, the tumor cell pH gradient increases an average of 0.25–0.3 pH units. It is interesting that, despite the fact that co-injection of glucose should enhance tumor acidity for only a couple hours after its administration, we observe statistically significant changes of the fluorescent pHLIP signal at 24 h. We conclude that tumor targeting at early time points after fluorescent pHLIP administration in the presence of glucose is enhanced, while removal of the peptide from non-cancerous tissue was not affected, giving rise to the values of the contrast index calculated as the ratio of the signal in tumor to that in non-cancerous tissue (see Methods).
Fig. 2.
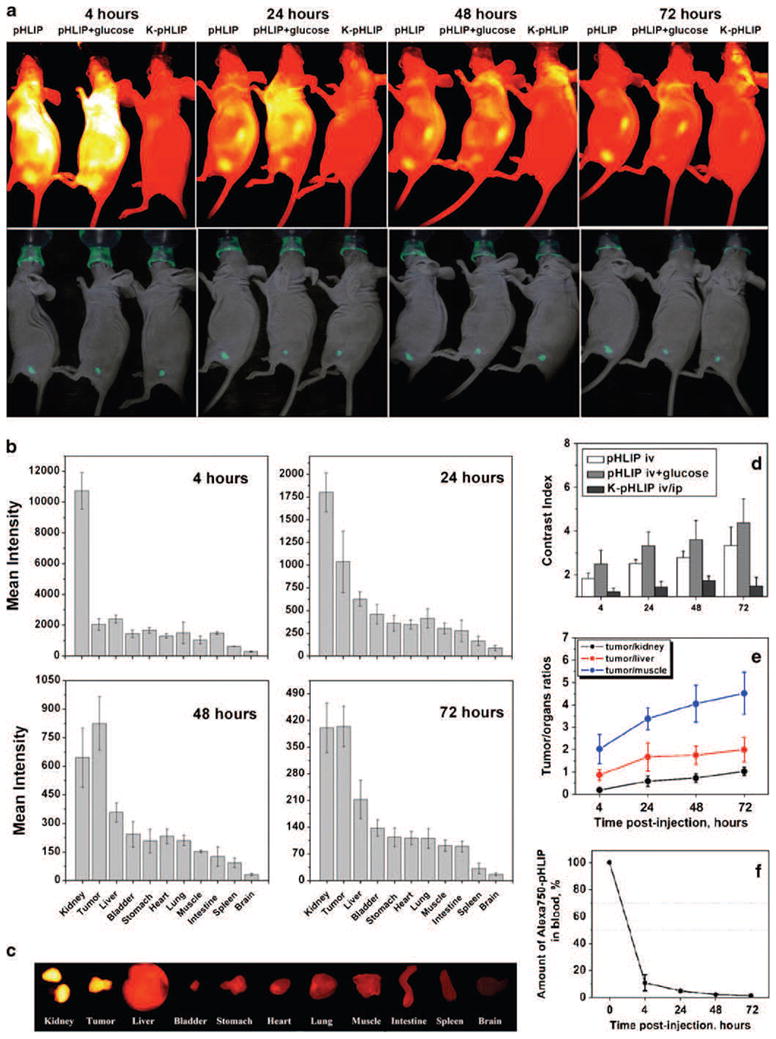
pHLIP targets small tumors and targeting is enhanced by co-injection of glucose. a Targeting of tumors by fluorescent pHLIP is demonstrated by whole-body fluorescence imaging. NIR fluorescence (top panel; yellow represents highest intensity) and overlays of visible light (photo) and GFP (green) fluorescence images (bottom panel) of mice are shown. Tumors were established by subcutaneous injection of GFP-expressing HeLa cancer cells in the right flanks, and Cy5.5-pHLIP and non-inserting control peptide Cy5.5-K-pHLIP were given as single i.v. injections, followed by imaging at 4, 24, 48, and 72 h post-injection. Targeting of tumors by Cy5.5-pHLIP was enhanced by intraperitoneal co-injection of 200 μl of a 25% glucose solution. Images obtained at different time points are presented with maximum contrast. b Surface mean intensities of tumor and major organs collected at various time points after administration of Cy5.5-pHLIP are presented (the numbers are found in Table 2). c NIR fluorescence image of tumor and organs collected at 24 h after tail vein injection of Cy5.5-pHLIP. d The contrast index calculated at different time points after administration of Cy5.5-pHLIP, Cy5.5-pHLIP with co-injection of glucose and Cy5.5-K-pHLIP are presented as mean±SD (the numbers are found in Table 1). e Tumor/muscle, tumor/kidney, and tumor/liver ratios at various time points of Cy5.5-pHLIP administration calculated from the Table 2. f Mean intensity of the NIR fluorescence in blood at different time points after administration of Alexa750-pHLIP as a single i.v. injection.
Table 1.
Mean values of the contrast index calculated from the whole-body fluorescence images of mice at various time points (4 to 72 h) after injection of Cy5.5-pHLIP, Cy5.5-pHLIP with 25% glucose, and Cy5.5-K-pHLIP into mice bearing GFP-HeLa tumors
| Time, h | Cy5.5-pHLIP | N | Cy5.5-pHLIP, glucose | N | P level | Cy5.5-K-pHLIP |
|---|---|---|---|---|---|---|
| 4 | 1.818±0.261 | 4 | 2.489±0.618 | 7 | 0.0726 | 1.217±0.165 |
| 24 | 2.512±0.176 | 9 | 3.323±0.627 | 3 | 0.0036 | 1.420±0.270 |
| 48 | 2.783±0.299 | 6 | 3.600±0.872 | 3 | 0.0657 | 1.733±0.208 |
| 72 | 3.335±0.848 | 8 | 4.367±1.097 | 3 | 0.1280 | 1.468±0.412 |
N is the number of animals in each study. P levels are computed based on a two-sided test, using the mean values of Cy5.5-pHLIP administrated as a single i.v. injection and Cy5.5-pHLIP with 25% glucose co-injection.
As a control, we used K-pHLIP, a peptide where the two Asp residues in the putative transmembrane region are replaced with Lys residues, resulting in a loss of pH-dependent insertion across membranes (over a pH range from 8 to 3) [13]. The contrast index for the fluorescent-K-pHLIP is about 1.5 (Fig. 2d), which is similar to the contrast index calculated for tumors after injection of free dyes with no pHLIP (data not shown; Cy5.5 or Alexa750 dyes were reacted with the SH group of a Cys before injection to animals in order to block the maleimide linkages on both dyes and so to reduce non-specific reactions with proteins in vivo).
Biodistribution and Blood Clearance
Since pHLIP peptide interacts with cellular membranes, it is not possible to transfer the entire fluorescent signal to the supernatant for accurate quantification even after homogenizing and dissolving organs (further processing of tissue with strong acids disrupts fluorescent dyes). Therefore, we quantified the fluorescent peptide uptake by tumors and major organs collected at various time points by measuring the fluorescence from the surfaces of organs (as shown on Fig. 2c) and calculating mean surface intensities (Fig. 2b). By analyzing the fluorescence intensity from the sliced pieces of each organ (each organ was sliced into 4–5 pieces), we concluded that the fluorescence signal is distributed homogeneously in all organs except kidneys and large tumors. The signal in a kidney is mostly accumulated in the cortex (see Fig. 3 and [13]). In small tumors with no signs of necrotic tissue, fluorescent pHLIP stains the entire tumor mass (Fig. 4a). However, in large tumors that developed apoptotic cores, a higher accumulation of fluorescent signal in the tumor core is observed (Fig. 4b). The maximum fluorescent signal was observed in tumors and major organs at 4 h post-injection. At 24 h, the fluorescence intensity in tumors dropped 2.3-fold, while, in kidney, liver, and muscle, the drop was 6.0, 3.8, and 3.4 times, respectively (Fig. 2b, d, e and Table 2). At 48 h post-injection, a further drop of intensity was observed in organs, with smaller reductions of the signal in tumors. In the control experiment, mice were illuminated for 20 min and four images were collected during the illumination. The decrease in fluorescence intensity of pHLIP-Alexa750 was less than 2%, which indicates that photobleaching effect was insignificant. The CNR at 4, 24, 48, and 72 h of tumor imaging is 149.0±13.8, 75.6±12.3, 45.1±3.8, 29.5±1.9, respectively. The data presented in Table 2 and Fig. 2b cannot be used to calculate the amount of the injected dose of the peptide accumulated in tumor and organs; they clearly demonstrate the more rapid fluorescence signal reduction in main organs relative to that in tumors, leading to enhancement of the tumor/muscle ratio (Fig. 2e).
Fig. 3.
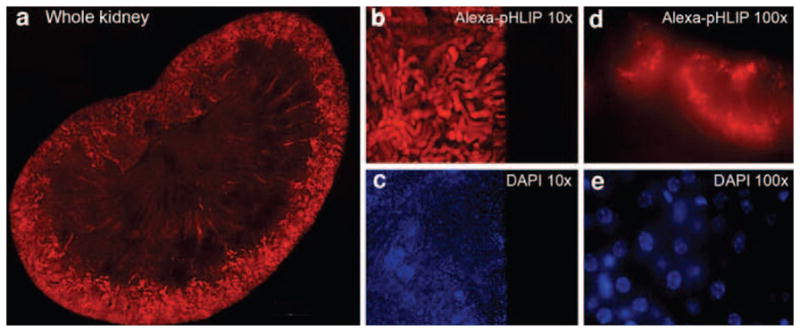
Histological study of distribution of fluorescent pHLIP in kidney. a individual fluorescent images of kidney slices were obtained using a fluorescent microscope with a ×10 objective and combined into a large image, which clearly demonstrates a predominant staining of the kidney cortex, particularly in distal tubules. DAPI stained cell nuclei (c and e). Alexa750 fluorescence is shown at ×10 and ×100 magnification on panels b and d, respectively. DAPI staining of the same area is presented in panels c and e. Fluorescent images at ×100 magnification were obtained by using focal Z-sectioning and a deconvolution program (ImageProPlus) to subtract the out-of-focus signal.
Fig. 4.

pHLIP staining of tumors. NIR, GFP, and overlay images of small (a; 1.5×3 mm) and large (b; 8×8 mm) tumors cut in half are shown. In the small tumors, NIR (as well as GFP) fluorescence distributed homogeneously, while the necrotic cores of large tumors (which has much less GFP signal) are preferentially stained by fluorescent pHLIP.
Table 2.
Mean values of the fluorescence intensity of organs and tumors measured using the Kodak Imager
| 4 h | 24 h | 48 h | 72 h | |
|---|---|---|---|---|
| Kidney | 10729.8±1190.5 | 1801.1±213.8 | 644.4±155.5 | 400.5±65.0 |
| Tumor | 2041.7±377.9 | 1035.7±337.5 | 823.8±139.8 | 404.2±53.2 |
| Liver | 2390.1±248.4 | 626.6±80.2 | 357.4±50.8 | 212.2±50.7 |
| Bladder | 1443.6±243.0 | 458.1±107.4 | 242.1±66.4 | 137.1±21.6 |
| Stomach | 1660.9±186.6 | 359.8±87.0 | 207.0±61.6 | 113.1±24.3 |
| Heart | 1297.3±153.6 | 346.3±50.4 | 231.4±38.7 | 110.9±17.8 |
| Lung | 1496.5±702.2 | 413.7±105.1 | 208.9±26.8 | 110.6±25.7 |
| Muscle | 1038.5±252.9 | 303.1±61.0 | 152.7±7.1 | 91.5±14.5 |
| Intestine | 1487.1±85.7 | 276.6±118.8 | 125.0±50.5 | 89.1±13.9 |
| Spleen | 607.4±16.0 | 165.5±52.8 | 92.5±25.0 | 31.3±14.0 |
| Brain | 282.1±36.1 | 87.6±28.1 | 30.8±6.7 | 15.7±4.1 |
Organs and tumors were collected at different time points after single i.v. Cy5.5-pHLIP injections (four mice were used to calculate the mean intensity at each time-point).
pHLIP is a moderately hydrophobic membrane-binding peptide. We previously demonstrated its ability to bind to the membrane of red blood cells (without lysing them) [15]. We assume that red blood cell binding can explain the prolonged circulation of the peptide in blood (about 10% is present at 4 h post-injection; Fig. 2f). For therapeutic applications of pHLIP, it could be considered as an advantage, while for nuclear imaging, faster blood clearance is desirable. Currently, we are testing truncated versions of the pHLIP peptide with reduced affinity to a lipid bilayer at neutral pH. New pHLIP variants demonstrate much faster blood clearance, and they might be better suited for nuclear imaging (work in progress).
Difference in Targeting of Metastatic and Non-metastatic Tumors by pHLIP
One of our goals is to evaluate the ability of fluorescent pHLIP to distinguish between metastatic and non-metastatic tumor phenotypes, since it is thought that more aggressive metastatic tumor phenotypes have a lower extracellular pH and that acidity promotes metastasis [7, 18]. Therefore, the extracellular pH of primary tumors may be a useful prognostic parameter for patients. Metastatic and non-metastatic tumors were established in mice by subcutaneous injection of two melanoma cell lines, M4A4 and NM2C5, respectively, both derived from the human melanoma cancer cell line, MDA-MB-435. M4A4 is highly metastatic in nude mice, while NM2C5 is weakly metastatic. When the primary tumors reached about 5 mm in diameter, Alexa750-pHLIP was given as single i.v. injection, and imaging was performed within 3 days (Fig. 5a). A statistically significant difference in tumor targeting was observed (Table 3 and Fig. 5b) and correlated with the tumor pH measured by a 0.8-mm diameter micro-electrode probe. The more aggressive tumors created by injection of metastatic M4A4 cancer cells, with a measured pH value of 6.9±0.2, were stained by fluorescent pHLIP 1.5–1.6 times better (Table 3) than non-aggressive tumors (NM2C5 cancer cells) with pH=7.1±0.2.
Fig. 5.
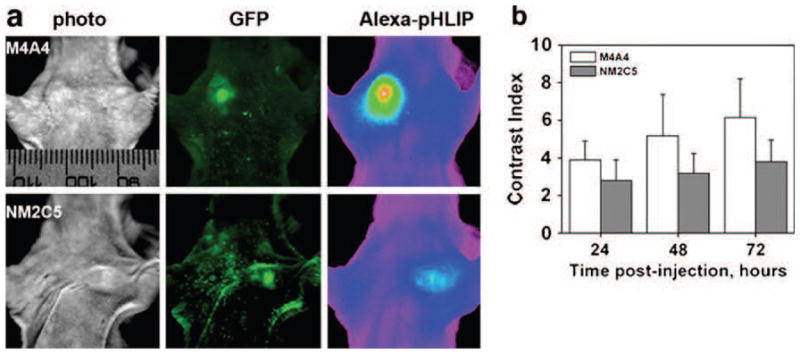
Fluorescent pHLIP can distinguish between metastatic (M4A4) and non-metastatic (NM2C5) tumors by better targeting of the more aggressive tumor phenotype. a Visible light (photo), GFP, and NIR (Alexa750-pHLIP) fluorescence images of mice bearing metastatic (M4A4) and non-metastatic (NM2C5) tumors are presented. NIR fluorescence is given using an intensity-scaled rainbow presentation. b Targeting of a metastatic (M4A4) tumor by Alexa750-pHLIP was higher than of a non-metastatic (NM2C5) tumor. Mean fluorescence was calculated by using the Kodak image software. Data are presented as mean±SD (the numbers are found in Table 3).
Table 3.
Mean values of the CI calculated from the whole-body fluorescence images of mice at various time points after Cy5.5-pHLIP administration
| Time, hr | CIM4A4 | NM4A4 | CINM2C5 | NNM2C5 | p-level |
|---|---|---|---|---|---|
| 24 | 3.896±1.001 | 16 | 2.806±1.096 | 18 | 0.0050 |
| 48 | 5.172±2.215 | 12 | 3.182±1.063 | 18 | 0.0026 |
| 72 | 6.157±2.050 | 8 | 3.799±1.147 | 12 | 0.0039 |
The numbers of animals bearing metastatic (M4A4) and non-metastatic (NM2C5) tumors (N), are presented, with P levels computed based on a two-sided test.
Targeting of Spontaneously Developed Tumors
Does pHLIP target spontaneous tumors? The data presented in Figs. 2 and 5, as well as data published previously [10, 13, 15], demonstrate the ability of pHLIP to target tumors established in mice by subcutaneous injection of cancer cells. Here, we present the results of targeting of spontaneous adenocarcinomas, choosing the transgenic adenocarcinoma mouse prostate (TRAMP) model, which is considered as one of the best for the study of prostate tumor development, growth, and metastasis [20, 21]. Mice expressing high levels of the transgene display progressive forms of prostatic disease that histologically resemble human prostate cancer ranging from mild intra-epithelial hyperplasia to large multinodular malignant neoplasia to adenocarcinomas with metastases. Fluorescent pHLIP was administrated as a single i.p. injection to TRAMP mice that had developed prostate tumors. The mouse chest was opened the day after injection, and the fluorescent images of the whole mouse, tumor and major organs were taken (Fig. 6). A high level of fluorescent pHLIP accumulation in the tumor (10.5 mm in diameter) is evident. The fluorescent image of the tumor sliced into two pieces demonstrates that pHLIP stains the entire tumor mass, penetrating to the cells in its interior (Fig. 6c), labeling the extracellular space and cellular membrane (Fig. 6d).
Fig. 6.
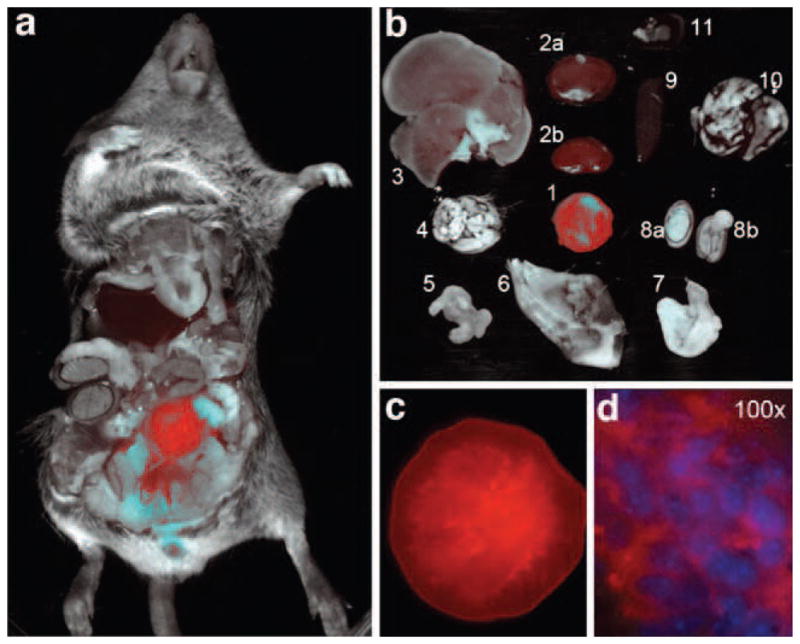
Prostate tumor targeting by fluorescent pHLIP is demonstrated in TRAMP mice by whole-body fluorescence imaging. a Overlay of visible light (photo) and NIR (Alexa750-pHLIP; red) fluorescence images of a TRAMP mouse with open chest taken at 24 h after a single i.p. injection of fluorescent pHLIP. b Overlay of visible light (photo) and NIR (Alexa750-pHLIP) fluorescence images are presented of tumor (1) and major organs [kidneys (2), liver (3), brain (4), intestine (5), muscle (6), stomach (7), testicles (8), spleen (9), lung (10), heart (11)] collected 24 h post-injection. c A NIR fluorescent image of a prostate tumor (10.5 mm in diameter) incised into two halves (one half is shown) demonstrates internal staining of the entire tumor mass by fluorescent pHLIP. d Distribution of fluorescent pHLIP in a histological section of tumor. An overlay of DAPI and Alexa750 deconvoluted fluorescence images (×100 objective) is presented. DAPI stains cell nuclei (blue), while Alexa750 stains membranes and extracellular compartments.
Staining Metastatic Lesions by Fluorescent pHLIP
Can pHLIP target metastases? Metastasis is largely what makes cancer a lethal disease. Methods that allow identification and selective treatment of metastatic lesions could be useful in reducing mortality. Recent studies show that invasive neoplasms that have enhanced glucose flux compared with normal tissues give an avenue to distinguish benign from malignant nodules using fluorodeoxyglucose-positron emission tomography [22, 23]. To find whether pHLIP might similarly be used, we investigated the capability of Alexa750-pHLIP to mark metastases in lungs. M4A4 cancer cells expressing GFP were used in the study to unmistakably visualize metastatic foci. In the first type of experiment, cancer cells were implanted by subcutaneous injection, and when the tumor grew to 10–15 mm in diameter, Alexa750-pHLIP was administrated as a single i.v. injection. The mouse was euthanized after 24 h; the primary tumor was removed, and the rest of the body was checked for metastatic lesions, which have a characteristic GFP fluorescence. Comparison of whole-body fluorescence GFP and NIR images of mice with open chests revealed selective staining of lung metastases by fluorescent pHLIP (representative image in Fig. 7a). Lungs were removed and immediately analyzed under the microscope to identify the relative localization of GFP and NIR fluorescent signals (Fig. 7b–d). Further analysis of the distribution of fluorescence was evaluated at higher magnification (×100), clearly showing extracellular and membrane localization of fluorescent pHLIP (Figs. 7 and 8), as expected from our biophysical studies showing that pHLIP inserts across a lipid bilayer at low pH to form a stable transmembrane helix and is not taken up by endocytosis [8–10, 12–14].
Fig. 7.
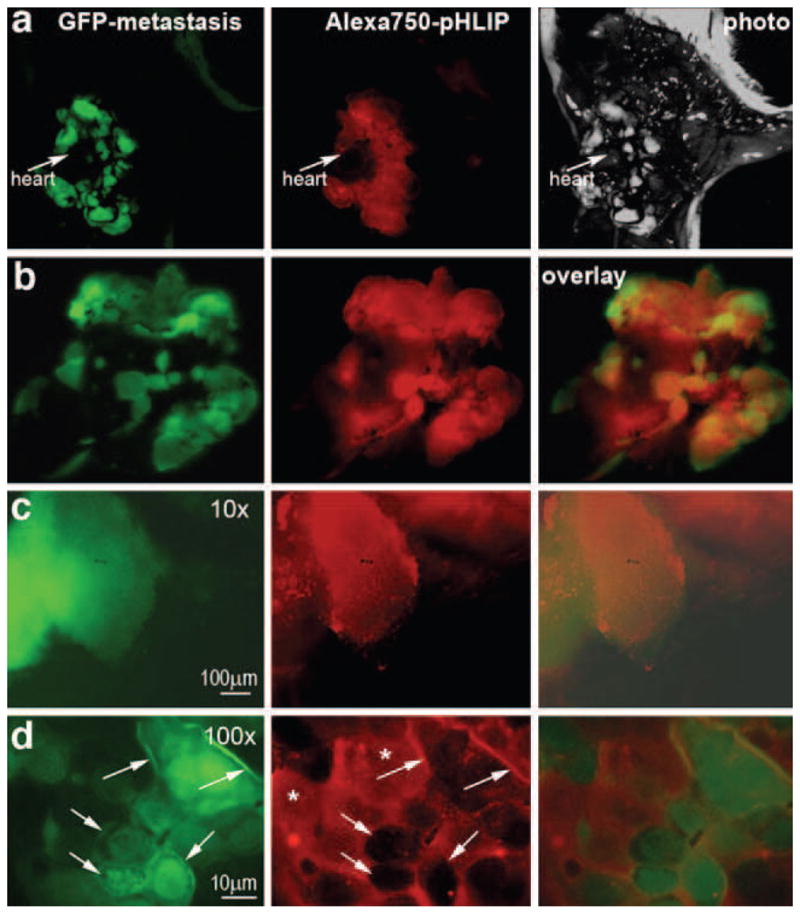
Fluorescent pHLIP targets metastatic nodules in lungs and is distributed in the extracellular space and cellular membranes of the tumor cells. A primary tumor was established by subcutaneous injection of M4A4 cancer cells expressing GFP, and the tumor was grown until it gave lung metastases. Then, the primary tumor was removed, and Alexa750-pHLIP was given as a single i.v. injection. One day after injection, the animal was euthanized, the chest was opened, and whole-body imaging was carried out. a Whole-body GFP, NIR (Alexa750-pHLIP) fluorescence, and visible light (photo) images are shown. b Co-localization of GFP and NIR fluorescence is shown in the excised lungs. c A metastatic lesion analyzed under the fluorescence microscope at ×10 magnification demonstrates co-localization of GFP and NIR emission. d A detailed analysis of NIR (Alexa750-pHLIP) fluorescence distribution was carried at ×100 magnification. The NIR fluorescence is distributed in the extracellular space (asterisk) with staining of the cellular membrane (indicated by arrows).
Fig. 8.
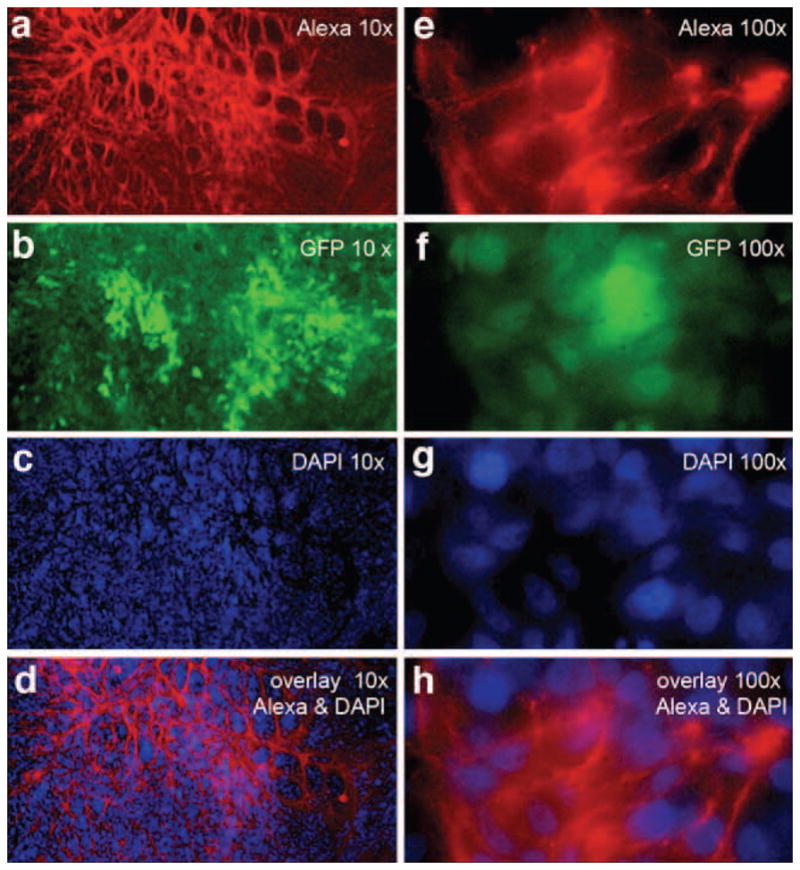
Distribution of fluorescent pHLIP in histological sections of lung metastatic sites at various magnifications. The red color represents Alexa750 fluorescence (a, e); the green color represents the GFP fluorescence of the cancer M4A4 cells (b, f); the blue color shows DAPI in nuclei (c, g), and the last row (d and h) shows overlays of Alexa750 and DAPI fluorescence images.
In a second type of metastasis experiment, M4A4 cancer cells expressing GFP were administrated directly into the blood via tail vein injection. Cancer cells circulating in the blood accumulate in the lungs and Alexa750-pHLIP injected via tail vein targeted metastatic sites (Fig. 9a). We observed a 2-mm-sized metastatic rib lesion that was marked by fluorescent pHLIP with high accuracy (Fig. 9b). The EdgeFinder program we have developed [17] was applied to calculate tumor margins from GFP and Alexa fluorescent images (Fig. 9c). Contours of GFP and NIR fluorescence shown in red and light blue, respectively, coincide with sub-millimeter precision.
Fig. 9.
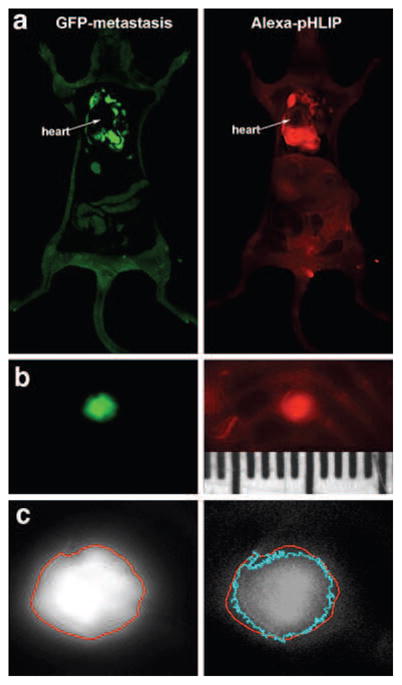
Fluorescent pHLIP targets metastatic lesions in lungs. Metastases were established by i.v. injection of M4A4 cancer cells that express GFP. Alexa750-pHLIP was given as a single i.v. injection. One day after injection, the animal was euthanized, the chest was opened, and whole-body imaging was carried out. a Whole-body GFP and NIR (Alexa750-pHLIP) fluorescent images are shown. b Targeting of a millimeter-size metastatic lesion in the ribs by fluorescent pHLIP is evident. The ruler is in millimeters. c The magnified GFP and Alexa images of the millimeter-size metastatic rib lesion are shown in (b) with tumor margins calculated by using the EdgeFinder program. Contours of GFP and NIR fluorescence, shown in red and light blue, respectively, coincide with sub-millimeter precision.
Discussion
While no specific gene mutation or chromosomal abnormality is common to all cancers, nearly all solid tumors have elevated aerobic glycolysis and acidosis, regardless of their tissue or cellular origin [24]. Altered glucose metabolism in cancer cells stimulates production and accumulation of acid in the extracellular space of tumors. Proliferation of cancer cells and the formation of metastases are promoted at low extracellular pH, while, at the same time, normal cells are susceptible to acid-induced apoptosis, facilitating tumor invasiveness. Altered glucose metabolism and acidification are thought to play a critical role in cancer biology [4, 25], and these characteristics of tumor growth and progression might be useful for the detection of primary tumors and metastatic sites, and for the prognosis of tumor development if appropriate technology can be found [26]. We suggest that the pHLIP peptide may represent such a technology for fundamental and applied studies.
Our data clearly show that fluorescent pHLIP can target, with high accuracy, primary tumors of different origins established by subcutaneous injection of cancer cells or developed spontaneously (TRAMP cancer model). It is especially important to note that fluorescent pHLIP is capable of targeting small tumors, which is important for early cancer diagnostics. The fluorescent pHLIP is distributed rather uniformly throughout an entire tumor, unless it has developed a necrotic core, where its accumulation is usually higher. Since pHLIP is a membrane-binding peptide, we speculate that it might target the lipid bodies present in apoptotic/necrotic tissue [27]. However, histological analysis should be performed to test this suggestion. The tumor targeting can be enhanced by co-injection of glucose, which is known to selectively enhance acidity in tumors. pHLIP identifies metastatic foci in lungs, suggesting that metastatic lesions are also acidic. The extent of tumor labeling by pHLIP directly correlates with tumor aggressiveness, which could provide a useful measure of the metastatic potential of tumors.
Conclusions
Fluorescent pHLIP might be used for the study of the microenvironments of tumors and metastases and their development and progression. Combining fluorescent pHLIP with the EdgeFinder program [17] might allow a surgeon to locate a tumor and identify its border, with the aim of an accurate and complete removal of all cancer cells during surgical intervention. pHLIP conjugated with PET, SPECT, and MR imaging agents is currently being evaluated using various tumor models in mice with the ultimate goal to transfer them to clinics for tumor diagnosis and therapeutic outcome monitoring. An enhanced level of acidity correlates with the development and progression, not only of tumors, but also of other pathological states [28–30]. Therefore, the pHLIP technology might have a wide range of applications in basic research and medicine for the imaging, assessment, and therapeutic targeting of acidic tissue.
Acknowledgments
We are grateful to Erin Jansen for the conjugation of fluorescent dyes with pHLIP peptide and to Dr. James Segala for analysis of metastatic lesion on ribs using EdgeFinder program, and we would like to acknowledge the financial support from the NIH CA133890 to OAA, DME, and YRK; NIH GM073857 to DME; and DOD BC061356 and NIH CA125280 to OAA.
Footnotes
Conflict of Interest Statement. The authors declare that they do not have any conflict of interest.
References
- 1.Krebs HA. The Pasteur effect and the relations between respiration and fermentation. Essays Biochem. 1972;8:1–34. [PubMed] [Google Scholar]
- 2.Warburg O, Wind F, Negelein E. The metabolism of tumors in the body. J Gen Physiol. 1927;8:519–530. doi: 10.1085/jgp.8.6.519. [DOI] [PMC free article] [PubMed] [Google Scholar]
- 3.Wu R, Racker E. Regulatory mechanisms in carbohydrate metabolism. IV. Pasteur effect and Crabtree effect in ascites tumor cells. J Biol Chem. 1959;234:1036–1041. [PubMed] [Google Scholar]
- 4.Gatenby RA, Gawlinski ET, Gmitro AF, Kaylor B, Gillies RJ. Acid-mediated tumor invasion: a multidisciplinary study. Cancer Res. 2006;66:5216–5223. doi: 10.1158/0008-5472.CAN-05-4193. [DOI] [PubMed] [Google Scholar]
- 5.Gatenby RA, Gillies RJ. A microenvironmental model of carcinogenesis. Nat Rev Cancer. 2008;8:56–61. doi: 10.1038/nrc2255. [DOI] [PubMed] [Google Scholar]
- 6.Lessi E, Marino ML, Lozupone F, Fais S, De Milito A. Tumor acidity and malignancy: novel aspects in the design of anti-tumor therapy. Cancer Therapy. 2008;6:55–66. [Google Scholar]
- 7.Rofstad EK, Mathiesen B, Kindem K, Galappathi K. Acidic extracellular pH promotes experimental metastasis of human melanoma cells in athymic nude mice. Cancer Res. 2006;66:6699–6707. doi: 10.1158/0008-5472.CAN-06-0983. [DOI] [PubMed] [Google Scholar]
- 8.Hunt JF, Rath P, Rothschild KJ, Engelman DM. Spontaneous, pH-dependent membrane insertion of a transbilayer alpha-helix. Biochemistry. 1997;36:15177–15192. doi: 10.1021/bi970147b. [DOI] [PubMed] [Google Scholar]
- 9.Reshetnyak YK, Segala M, Andreev OA, Engelman DM. A monomeric membrane peptide that lives in three worlds: in solution, attached to, and inserted across lipid bilayers. Biophys J. 2007;93:2363–2372. doi: 10.1529/biophysj.107.109967. [DOI] [PMC free article] [PubMed] [Google Scholar]
- 10.Andreev OA, Engelman DM, Reshetnyak YK. Targeting acidic diseased tissue. New technology based on use of the pH (low) insertion peptide (pHLIP) Chemistry Today. 2009;27:10–13. [PMC free article] [PubMed] [Google Scholar]
- 11.Andreev OA, Karabadzhak AG, Weerakkody D, et al. pH (low) insertion peptide (pHLIP) inserts across a lipid bilayer as a helix and exits by a different path. Proc Natl Acad Sci USA. 2010;107:4081–4086. doi: 10.1073/pnas.0914330107. [DOI] [PMC free article] [PubMed] [Google Scholar]
- 12.Reshetnyak YK, Andreev OA, Segala M, Markin VS, Engelman DM. Energetics of peptide (pHLIP) binding to and folding across a lipid bilayer membrane. Proc Natl Acad Sci USA. 2008;105:15340–15345. doi: 10.1073/pnas.0804746105. [DOI] [PMC free article] [PubMed] [Google Scholar]
- 13.Andreev OA, Dupuy AD, Segala M, et al. Mechanism and uses of a membrane peptide that targets tumors and other acidic tissues in vivo. Proc Natl Acad Sci USA. 2007;104:7893–7898. doi: 10.1073/pnas.0702439104. [DOI] [PMC free article] [PubMed] [Google Scholar]
- 14.Reshetnyak YK, Andreev OA, Lehnert U, Engelman DM. Translocation of molecules into cells by pH-dependent insertion of a transmembrane helix. Proc Natl Acad Sci USA. 2006;103:6460–6465. doi: 10.1073/pnas.0601463103. [DOI] [PMC free article] [PubMed] [Google Scholar]
- 15.Vavere AL, Biddlecombe GB, Spees WM, et al. A novel technology for the imaging of acidic prostate tumors by positron emission tomography. Cancer Res. 2009;69:4510–4516. doi: 10.1158/0008-5472.CAN-08-3781. [DOI] [PMC free article] [PubMed] [Google Scholar]
- 16.Kozin SV, Shkarin P, Gerweck LE. The cell transmembrane pH gradient in tumors enhances cytotoxicity of specific weak acid chemo-therapeutics. Cancer Res. 2001;61:4740–4743. [PubMed] [Google Scholar]
- 17.Segala J, Engelman DM, Reshetnyak YK, Andreev OA. Accurate analysis of tumor margins using a fluorescent pH low insertion peptide (pHLIP) Int J Mol Sci. 2009;10:3478–3487. doi: 10.3390/ijms10083478. [DOI] [PMC free article] [PubMed] [Google Scholar]
- 18.Robey IF, Baggett BK, Kirkpatrick ND, et al. Bicarbonate increases tumor pH and inhibits spontaneous metastases. Cancer Res. 2009;69:2260–2268. doi: 10.1158/0008-5472.CAN-07-5575. [DOI] [PMC free article] [PubMed] [Google Scholar]
- 19.Wesson DE. Dietary HCO3 reduces distal tubule acidification by increasing cellular HCO3 secretion. Am J Physiol. 1996;271:F132–F142. doi: 10.1152/ajprenal.1996.271.1.F132. [DOI] [PubMed] [Google Scholar]
- 20.Greenberg NM, DeMayo F, Finegold MJ, et al. Prostate cancer in a transgenic mouse. Proc Natl Acad Sci USA. 1995;92:3439–3443. doi: 10.1073/pnas.92.8.3439. [DOI] [PMC free article] [PubMed] [Google Scholar]
- 21.Gingrich JR, Greenberg NM. A transgenic mouse prostate cancer model. Toxicol Pathol. 1996;24:502–504. doi: 10.1177/019262339602400414. [DOI] [PubMed] [Google Scholar]
- 22.Kumar R, Alavi A. Clinical applications of fluorodeoxyglucose–positron emission tomography in the management of malignant melanoma. Curr Opin Oncol. 2005;17:154–159. doi: 10.1097/01.cco.0000152626.98124.3a. [DOI] [PubMed] [Google Scholar]
- 23.Mavi A, Lakhani P, Zhuang H, Gupta NC, Alavi A. Fluorodeoxyglucose-PET in characterizing solitary pulmonary nodules, assessing pleural diseases, and the initial staging, restaging, therapy planning, and monitoring response of lung cancer. Radiol Clin North Am. 2005;43:1–21. doi: 10.1016/j.rcl.2004.09.001. [DOI] [PubMed] [Google Scholar]
- 24.Seyfried TN, Shelton LM. Cancer as a metabolic disease. Nutr Metab. 2010;7:7. doi: 10.1186/1743-7075-7-7. [DOI] [PMC free article] [PubMed] [Google Scholar]
- 25.Gillies RJ, Robey I, Gatenby RA. Causes and consequences of increased glucose metabolism of cancers. J Nucl Med. 2008;49:24S–42S. doi: 10.2967/jnumed.107.047258. [DOI] [PubMed] [Google Scholar]
- 26.Vansteenkiste J, Fischer BM, Dooms C, Mortensen J. Positron-emission tomography in prognostic and therapeutic assessment of lung cancer: systematic review. Lancet Oncol. 2004;5:531–540. doi: 10.1016/S1470-2045(04)01564-5. [DOI] [PubMed] [Google Scholar]
- 27.Zoula S, Herigault G, Ziegler A, et al. Correlation between the occurrence of 1H-MRS lipid signal, necrosis and lipid droplets during C6 rat glioma development. NMR Biomed. 2003;16:199–212. doi: 10.1002/nbm.831. [DOI] [PubMed] [Google Scholar]
- 28.Kellum JA, Song M, Li J. Science review: extracellular acidosis and the immune response: clinical and physiologic implications. Crit Care. 2004;8:331–336. doi: 10.1186/cc2900. [DOI] [PMC free article] [PubMed] [Google Scholar]
- 29.Xiong ZG, Pignataro G, Li M, Chang SY, Simon RP. Acid-sensing ion channels (ASICs) as pharmacological targets for neuro-degenerative diseases. Curr Opin Pharmacol. 2008;8:25–32. doi: 10.1016/j.coph.2007.09.001. [DOI] [PMC free article] [PubMed] [Google Scholar]
- 30.Holzer P. Acid-sensitive ion channels and receptors. Handb Exp Pharmacol. 2009;194:283–332. doi: 10.1007/978-3-540-79090-7_9. [DOI] [PMC free article] [PubMed] [Google Scholar]