Abstract
Radiochromic plastic and gel materials have recently emerged which can yield 3D dose information over clinical volumes in high resolution. These dosimeters can provide a much more comprehensive verification of complex radiation therapy treatments than can be achieved by conventional planar and point dosimeters. To achieve full clinical potential, these dosimeters require a fast and accurate read-out technology. Broad-beam optical-computed tomography (optical-CT) systems have shown promise, but can be sensitive to stray light artifacts originating in the imaging chain. In this work we present and evaluate a method to correct for stray light artifacts by deconvolving a measured, spatially invariant, point spread function (PSF). The correction was developed for the DLOS (Duke large field-of-view optical-CT scanner) in conjunction with radiochromic PRESAGE® dosimeters. The PSF was constructed from a series of acquisitions of projection images of various sized apertures placed in the optical imaging chain. Images were acquired with a range of exposure times, and for a range of aperture sizes (0.2–11 mm). The PSF is investigated under a variety of conditions, and found to be robust and spatially invariant, key factors enabling the viability of the deconvolution approach. The spatial invariance and robustness of the PSF are facilitated by telecentric imaging, which produces a collimated light beam and removes stray light originating upstream of the imaging lens. The telecentric capability of the DLOS therefore represents a significant advantage, both in keeping stray light levels to a minimum and enabling viability of an accurate PSF deconvolution method to correct for the residual. The performance of the correction method was evaluated on projection images containing known optical-density variations, and also on known 3D dose distributions. The method is shown to accurately account for stray light on small field dosimetry with corrections up to 3% in magnitude shown here although corrections of >10% have been observed in extreme cases. The dominant source of stray light was found to be within the imaging lens. Correcting for stray light extended the dynamic range of the system from ~30 to ~60 dB. The correction should be used when measurements need to be accurate within 3%.
1. Introduction
The feasibility of optical-computed tomography (optical-CT) as a read-out technology for three-dimensional (3D) dosimetry with polymer gels was first demonstrated by Gore et al (1996) and Maryanski et al (1996). The technique was first generation, in that each 2D projection was built up by raster scanning a laser beam across the dosimeter. While effective, this technique was relatively time consuming, due to the time required to raster scan the laser across the sample to acquire projections with sufficiently high resolution. Many hours were required to scan a large dosimeter (e.g. 16 cm diameter, 12 cm height) with 2 mm3 resolution. In principle, much faster scanning can be achieved by broad-beam scanning configurations, where all points in a projection are acquired simultaneously (Krstajic and Doran 2006, Sakhalkar and Oldham 2008, Wolodzko et al 1999). This approach can be problematic when applied to polymer gels because the mechanism of optical contrast is radiation induced polymer microparticles that scatter the laser light according to Mie theory (Maryanski et al 1996). This scattered light is easily removed in the first generation configuration by means of an aperture, but it cannot be easily removed in broad-beam configurations, leading to the potential of significant scatter artifacts (Oldham 2004, Bosi et al 2009). It is only with the use of radiochromic dosimeters (Adamovics and Maryanski 2006, Fricke and Morse 1927, Kelly et al 1998), which exhibit optical contrast by light absorption (not scatter), that the potential for fast and accurate broad-beam optical-CT systems becomes a realistic goal. In this paper we introduce the DLOS (Duke large field-of-view (FOV) optical-CT scanner), a fast broad-beam telecentric optical-CT scanner for 3D dosimetry. The scanner has been designed to image radiochromic dosimeters such as PRESAGE® (Adamovics and Maryanski 2006, Sakhalkar et al 2009) where radiation induced optical contrast is light absorbing (from leuco-dye oxidation) rather than light scattering by polymerization. The small amount of scattered light that does originate in the dosimeter (or other components upstream of the lens such as the fluid) is nearly all removed by the telecentric imaging lens which has a stringent 0.1° acceptance angle. The predominant source of stray photons is therefore within the imaging lens itself (reflections off internal lenses, CCD surface, etc) as shown by measurements in sections 2.2 and 3.1. This stray light, while small compared to the scatter encountered in polymer gels, must still be corrected for in order to achieve accurate dosimetry within ~3% for dosimeters exhibiting an optical density (OD, OD = log10(I0/I)) relative to the fluid greater than 1.5. In this work we demonstrate the feasibility to correct for this stray light utilizing the deconvolution of a spatially invariant point spread function (PSF) determined from measurements with the DLOS/PRESAGE® system.
2. Methods
The methods are described in three sections. Section 2.1 introduces the design and operation of the DLOS, and illustrates the problem of stray light. Section 2.2 introduces the method for stray light correction, and the approach to measure the appropriate PSF. Section 2.3 describes two phases of evaluation tests that were performed to verify the performance of the correction method. The first evaluated the effectiveness of the correction on individual projection images containing a light block or neutral density (ND) filters, and the second on fully reconstructed 3D PRESAGE® dosimetry data.
2.1. DLOS
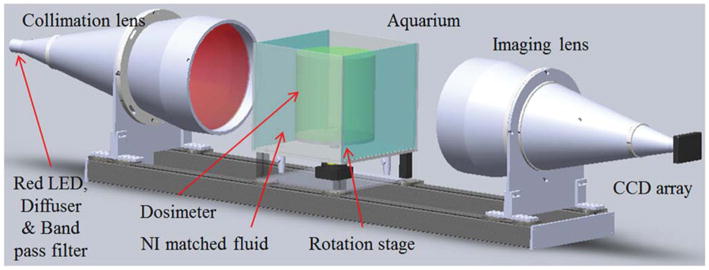
The DLOS system is shown schematically in figure 1. This design is based on an earlier prototype described in Sakhalkar and Oldham (2008), but contains several important modifications, and is scaled up from a maximum FOV of 11 to 24 cm horizontally. The main components of the system include a light source, aquarium, rotation stage, imaging lens and CCD camera. The key modifications include replacing the original area LED light source with a telecentric light source (LT-CL-240R, Opto-Engineering, Italy). The 3 W LED in the light source is immediately followed by an optical diffuser (10DIFF-VIS, Newport) and a 632 ± 5 nm band pass filter (FL632.8–10, Thorlabs). The optical diffuser plays a significant role in creating a uniform flood field while the band pass filter narrows the LED spectrum to reduce any spectral artifacts (Thomas et al 2011). Light emitted from this optical chain is collimated to a parallel beam of diameter 30 cm by the telecentric optics in the light source. The beam then transmits through the sample, remaining parallel due to the surrounding fluid, chosen to match the refractive index of the sample. The imaging lens (TC-23–240, Opto-Engineering, Italy) then collects light representing attenuation line integrals onto a 12-bit CCD array of 1040 × 1392 (a102f, Basler, Germany) while rejecting most of the scattered light originating within the sample as the lens has a manufacturer specified acceptance angle less than 0.1°. Telecentric optics provide a means to acquire orthographic projections; all projection lines are approximately parallel to the optical axis, creating an ideal for parallel geometry computed tomography. To acquire a complete scan, projections are acquired at multiple angles as the stage rotates around 360° (Radon 1986). A 3D map of optical attenuation coefficients in the dosimeter is then obtained by reconstructing the projections using a parallel beam filtered back projection algorithm. Conversion to dose is achieved through a calibration curve which is known to be linear for PRESAGE® (Adamovics and Maryanski 2006, Guo et al 2006).
Figure 1.
Computer aided rendition of the DLOS. Light emitted from a red LED source coupled with an optical diffuser and a 10 nm bandwidth band pass filter is collimated and parallel light is projected through the sample. Parallel light projection images are formed by the telecentric imaging lens which accepts light within 0.1° of the optical axis acceptance angle, giving it inherent scatter rejection that originates within the aquarium. Images are recorded with a 12-bit monochromatic CCD array. The distance from the LED to the CCD is ~2 m.
2.2. Stray light artifacts in the DLOS system
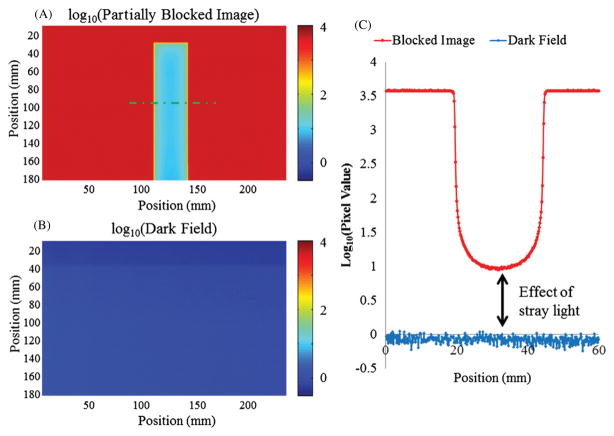
Figure 2 illustrates the stray light artifact with an opaque light block placed in the beam path between the collimation lens and the aquarium. The signal behind the light block should approach the dark field values, but is significantly higher. Moving the light block to different positions in the imaging chain (e.g. after the aquarium) had no effect on the elevated signal behind the block. This suggests that the stray light is originating within the imaging lens since upstream contributions from the fluid is negligible. Further tests to characterize stray light include origin, magnitude, range and positional dependence under realistic dosimetry imaging scenarios, and are discussed in detail in section 2.3.
Figure 2.
(A) DLOS flood/dark corrected projection image of an opaque light block placed in the center of the FOV. (B) Dark field image. (C) Line profile of the green line shown in (A) of the opaque block and the dark field demonstrating the stray light contamination to the raw signal acquired by the camera. Note the log scale on all images and profiles to highlight the small but potentially problematic effect of stray light.
2.3. Correction method
The PSF of an imaging system is defined as the image of a single point object of negligible size. The degree of blurring of the point source in the image is a measure for the quality of the imaging system (Bushberg et al 2002). Stray light causes blurring in the image of the object from two sources—aberrations and diffraction. For incoherent imaging systems such as the DLOS, image formation is linear, such that each image corresponds to a convolution of the object being imaged with the PSF. To obtain the most accurate transmission projection images with the DLOS, its PSF needs to be deconvolved (or removed) from the raw projection images. The simplest way to do this is with the Stokes equation which is as follows:
| (1) |
where F and F−1 denote a 2D Fourier transform and its inverse.
The proposed correction method involves deconvolving the stray light contribution (aberrations, diffraction and general blurring) at all points in each DLOS projection image, using a measured PSF. Stray light corrected projections can then be reconstructed using FBP algorithms to obtain accurate values of the optical attenuation coefficients throughout the dosimeter. The PSF is a well-characterized, widely accepted model to correct for blur and aberrations in optical imaging fields from astronomy (Lyon et al 1997) to confocal microscopy (Pawley 2006), and has the potential to be easily implemented in optical-CT provided the stray light generated is spatially invariant (Sondhi 1972). To our knowledge, this is the first attempt to correct for stray light using deconvolution in a telecentric imaging system, but there is theoretical justification to implement a PSF in a telecentric system (Andersen et al 1999). The key to accurate stray light correction with this approach is making an accurate determination of the PSF.
2.3.1. PSF measurements
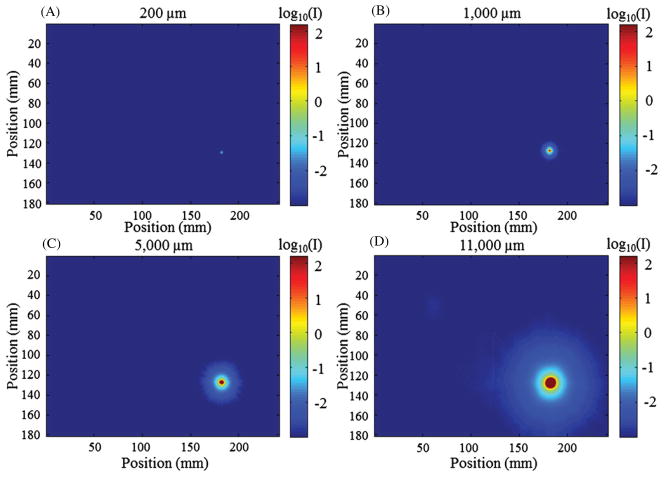
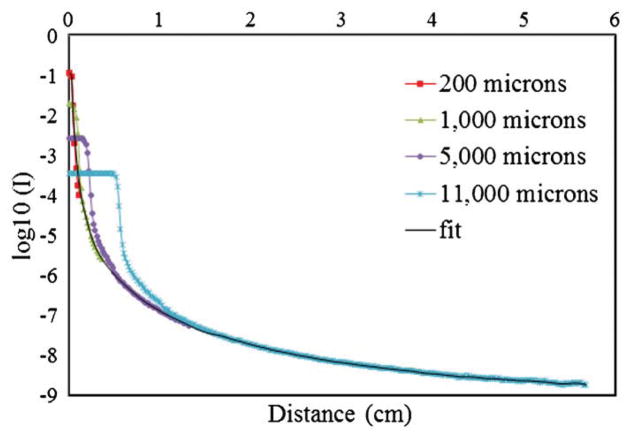
PSFs were constructed from a set of DLOS projection images of apertures of varying sizes (200, 1000, 5000 and 11 000 μm) as seen in figure 3. The apertures were placed between the aquarium and the light source. All other parameters and aspects of the scanner were kept identical to those used during a dosimetry scan (e.g. the matching fluid was present in the aquarium). The smallest aperture most closely represents a true impulse to the system, but since the stray light intensity drops off dramatically with distance (~−60 dB in the first mm), stray light can only be detected out to 3 pixels (~0.5 mm) from the center of the aperture before the noise floor is reached. Figure 2 clearly shows that stray light has effects reaching greater than 0.5 mm, so it was important to make measurements with much more dynamic range. To accomplish this, each aperture image was acquired using a high-dynamic-range imaging sequence. Many CCD chips are incapable of this process as they will experience blooming, a general spillover of signal from one pixel to another usually along one axis in the event of saturation. For each aperture, 400 images were acquired and averaged to increase the signal-to-noise ratio (SNR) and taken with increasing exposure times of 2, 4, 8, 16, 32 and 64 ms. All images were converted to irradiance (by dividing by the exposure time), and then a high-dynamic-range image was formed by combining the images acquired with different exposure times so that saturated regions were overwritten by those images with successively shorter exposure times (Robertson et al 1999). This process resulted in an aperture image with more dynamic range than the 12-bit monochromatic camera that acquired it. PSFs could then be generated from a set of these aperture images of varying diameter. Larger apertures allow more light into the system and illuminate regions of pixels at greater distances from the aperture. These regions are far enough away from the center of the aperture to behave as though they originate from a single point. Thus, smaller apertures were used to examine the PSF behavior close to the center pixel and larger apertures to approximate the PSF further from the center pixel, >1 cm. Given the general radial symmetry observed in each measurement, eight equi-spaced lines were averaged moving from the center of each aperture image outward at angles of 0°, 45°, 90°, 135°, 180°, 225°, 270° and 315°. The resulting line was then revolved through 2π around the aperture center to create a smoothed, symmetric individual aperture image that was normalized such that the area under the curve had an accumulated intensity of unity. This was done for each aperture image collected. A radial line of each normalized, radially symmetric image was then plotted onto the same graph (shown in figure 6) for the final step in obtaining the PSF. The representative PSF was then found by merging all individual aperture lines using all of the data from the 200 μm aperture line (8 pixels, 1.4 mm), all of the 1000 μm aperture minus the first 1.7 mm (pixels 11–21, 1.9 mm), pixels 42–120 from the 5000 μm aperture line (13.8 mm), and the remainder from the largest aperture line (pixels 150–300). A Savitzky–Golay filter (Savitzky and Golay 1964) (i.e. a least-squares polynomial fit smoothing algorithm with a 7 pixel kernel) was used to smooth the measurements after a Matlab piecewise Cubic Hermite Interpolating Polynomial (Bartles et al 1998) was used to fill in the missing pixel data. One limitation in this technique is that the tail of the measured PSF tends to overestimate due to the inability to remove the PSF from the aperture images, and thus this approach represents a first-order approximation of the true PSF.
Figure 3.
Images of the four aperture sizes used to construct a measured PSF of the DLOS for deconvolution taken in an arbitrary position within the FOV. Information from each aperture image is used to create the PSF with smaller aperture data used for central and larger aperture data used for peripheral regions of the PSF. Images were acquired with a sequence of exposure times in combination with 400 averages and fused to create a high-dynamic-range image. (A) 200 μm. (B) 1000 μm. (C) 5000 μm. (D) 11 000 μm. Figure 6 shows the integration of the data obtained with these four apertures.
Figure 6.
Series aperture measurements acquired with increasing diameter stitched together to create a radially symmetric PSF for use in a deconvolution algorithm.
PSF spatial invariance and robustness
PSF spatial invariance is required for implementation of an impulse response correction method. Measurements of the PSF (acquired using the procedure outlined in 2.3.1) were taken and compared at several locations in object space to verify invariance. The PSF was acquired and compared in three different scenarios. PSFs were first measured in different regions of the image with the aquarium filled with index matching fluid but no dosimeter. This test investigated the spatial independence within the DLOS system alone. In the second scenario, PSFs were measured on the central FOV for both unirradiated and irradiated dosimeters within the aquarium. This test investigated the robustness of the PSF in the presence of a dosimeter, in the event of any scatter originating within the irradiated dosimeter. Finally, PSFs were determined at off-axis positions through the dosimeter, including near the edge where maximum perturbation is expected due to refraction at the dosimeter fluid interfaces. These tests were a comprehensive set to ensure that a consistent, spatially invariant PSF will be realized in all imaging scenarios.
2.3.2. Implementation of the PSF
Once the PSF was obtained, a Matlab deconvolution algorithm based on the Richardson–Lucy method, an iterative-based deconvolution, was implemented for stray light removal (Biggs and Andrews 1997, Lucy 1974, Richardson 1972). The deconvolution was applied to all raw projection images, in order to remove stray light prior to reconstruction. The deconvolution algorithm maximizes the likelihood of pixel values being true detection values from the original image given Poisson statistics. Ten iterations were used in all deconvolution corrections. This method was chosen over that outlined in equation (1) as it produces fewer ringing artifacts. The additional reconstruction time is significant. Each projection image takes ~ 8.5 s to process with a computer equipped with a 2.5 GHz processor; for a typical scan with 360 projections an additional 1.5 h is added to the processing time which could come down with parallel computing with a multicore system.
2.4. Evaluation tests
Two phases of testing were performed on the correction method. First, the correction was applied to individual 2D projection images as described in section 2.4.1. In the second phase (section 2.4.2) the correction was applied to a full set of projections and the corresponding corrected 3D dose distributions were reconstructed. A multiple small field data set was chosen because this configuration is extremely sensitive to stray light effects. In addition, an accurate pre-existing commissioning beam data set was available for the Varian Novalis Tx used.
2.4.1. Projection images
Three test images were devised to evaluate the effectiveness of the stray light correction in projection images. The first is the light block shown in figure 2. This test is demanding because of the extreme nature of the light block (compared to a dosimeter which is never opaque) and because it evaluates stray light effects over fairly large regions. In the absence of stray light, the signal behind the block shown in figure 2 would be the dark current of the detector alone, and thus, ideally the deconvolution should remove the stray light contaminating the signal. It was expected that values near zero on raw images could be acquired where the opaque block stood. In the second test, a set of known ND filters (OD values of 0.2, 0.3, 0.5, 0.6, 2.0 and 3.0) mounted in an opaque filter wheel were imaged. The filter wheel test was designed to investigate quantitative accuracy when applying the deconvolution over the normal OD ranges of dosimeters. In the third test, the opaque filter wheel mount was removed to investigate any effect on the quantitative accuracy of enhanced surrounding light. The filter wheel without a mount provided a good test for simulating an actual dosimeter projection image with known ODs. For all of these tests, 25 images were averaged to improve the SNR in the projection images. For both the corrected and uncorrected images, regions of interest (ROIs) at the center of the ND filters were averaged and the values compared with the known values.
2.4.2. Small field irradiations
An ideal and useful application of 3D dosimetry is the measurement of small field output factors, because setup errors and volume effects are negligible and the dosimeters have no directional dependence. This has been demonstrated by Clift et al (2010) and Babic et al (2009). Clift et al measured small field output factors for the Novalis Tx using PRESAGE® dosimeters which had been imaged by the commercial scanning laser OCTOPUS optical-CT scanner, which is known to be insensitive to scattered light. In the present work we acquired the same small field output factors as reported in Clift et al, but used the DLOS to read out the data. This enabled a direct comparison of the DLOS against the OCTOPUS and the independent Gafchromic EBT film and commissioning data obtained by the Duke University Medical Center clinical physics team for the linear accelerator reported in Clift et al. The small field scenario presents a strong test for the stray light correction because small optically dense regions within the dosimeter are surrounded by large amounts of optically transparent regions making the configuration sensitive to stray light.
The small field irradiation experiment followed that described in Clift et al (2010) and illustrated here in figure 4. A 15 cm diameter, 10 cm tall, PRESAGE® dosimeter was irradiated with the same Novalis Tx unit (equipped with an HD-MLC120) and small field pattern as used in Clift et al. Six square field beams were delivered in a circular pattern around the periphery of the dosimeter with nominal side lengths of 40, 30, 20, 10, 5 and 5 mm to measure the total scatter factors. Each field was delivered 845 MU at a rate of 1000 MU min−1 with a 100 cm SSD setup. Circular ROIs in each field were taken to obtain the output factor. Pre- and post-irradiation scans were acquired with the same acquisition parameters enabling determination of the radiation induced change in OD (ΔOD). The scans were acquired over 360° with 600 projections, 25 images per projection, with the intention of downsizing to 1 mm voxel lengths to meet Nyquist sampling rates out to the edge of the dosimeter. The total acquisition time for each pre- and post-scan was 15 min. After deconvolution the projection images were run through a 5 × 5 kernel median filter and downsized. After the dosimeter was irradiated it was placed in the scanner in the same orientation as in the pre-scan by use of a registration mounting system. Pre- and post-irradiation projection images were then deconvolved, divided and placed into sinograms for reconstruction with the iradon transform (Mathworks, Inc.) using a Ram-Lak filter to obtain Δμ (change in attenuation coefficient, where attenuation coefficient can be found in the equation I = I0e−μx, proportional to ΔOD and dose delivered). Small field output factors were determined by normalizing all measurements to a 10 × 10 cm2 field through the 4 × 4 cm2 field. All values were corrected for cross contamination as detailed in Clift et al.
Figure 4.
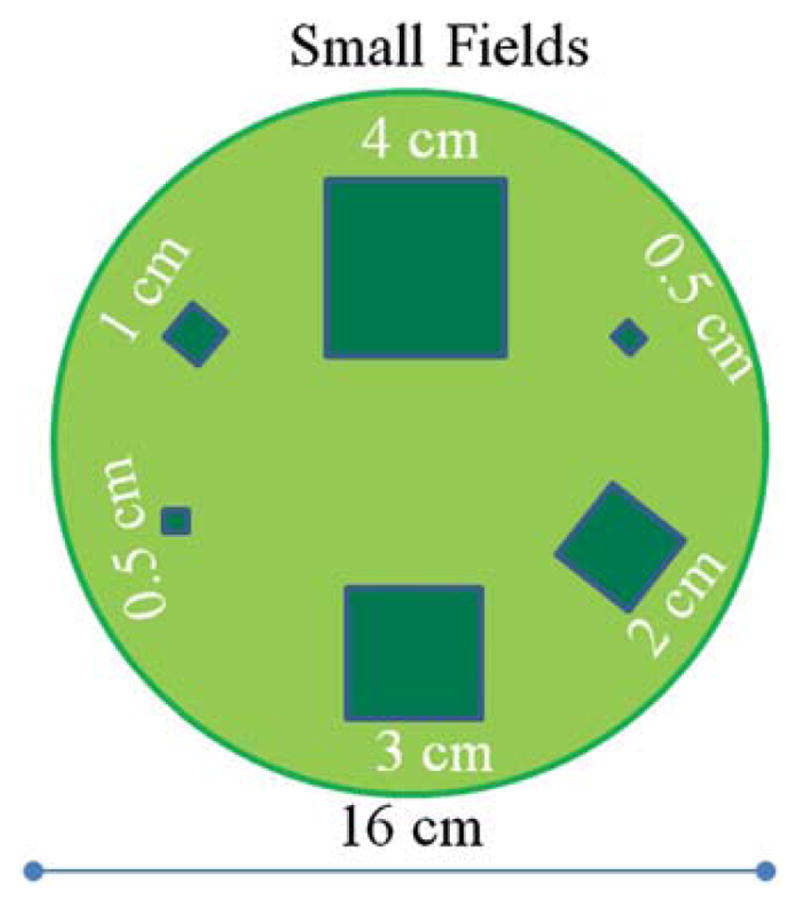
Top view of the small square field beam arrangement used to measure output factors. The fields are all normally incident on the top surface of a cylindrical dosimeter of diameter 16 cm and height 10 cm. Each field was delivered with 845 MU.
A second experiment was designed to investigate when the stray light correction becomes significant relative to the radiation induced ΔOD. A second dosimeter was irradiated with four 10 × 10 mm2 beams in a radial pattern having a 6 cm radius and 90° spacing. The fields received 1600, 3200, 6400 and 12 800 MU at 1000 MU min−1. After the data had been reconstructed a comparison was performed to determine the correlation of the magnitude of the stray light correction to the magnitude of the radiation induced ΔODs. The corrected and uncorrected ΔOD values versus the number of MUs delivered were plotted with the expectation of linearity upon stray light correction. This test allowed for an approximation to determine when the correction is significant.
3. Results and discussion
3.1. PSF measurements
Section 2.3 described the process of measuring the PSF for use in a deconvolution algorithm. This section will show the results from that process and show that spatial invariance is realized in the FOV tested.
3.1.1. PSF measurement along the central FOV
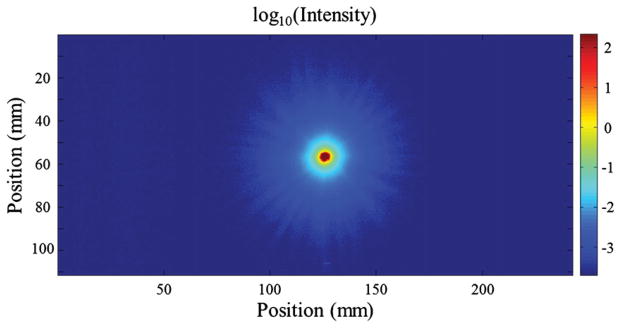
A high-dynamic-range image of the 5000 μm aperture with no dosimeter present in the aquarium is shown in figure 5. The plot shows a circularly symmetric stray light tail extending out several centimeters from the center of the aperture. Over five decades of data are realized indicating the advantage of the high-dynamic-range imaging technique. It is clear that the tail falls off steeply with increasing radius from the center of the aperture, but there is still a small contaminant stray light signal at greater than 2 cm distances corrupting measurements of neighboring pixels in the image.
Figure 5.
Image of the 5000 μm aperture acquired with increasing exposure time fused together to give a higher dynamic range image than that of the camera (~60 dB or three decades).
Figure 6 illustrates how individual aperture images were ‘stitched’ together to create a representative PSF. The figure shows the averaged profile through each individual aperture image after normalization. It is seen that the tails overlap with excellent consistency at radial distance of ~10–12 mm. At longer distances, there is no data from the small apertures because the noise floor is reached. Note the lack of discretized values observed in the curve despite being obtained with low pixel values (<20) on the 12-bit camera (max 4095). This is due to 400 images averaged together to raise the SNR and remove the inherent integer output from the camera. The tail can easily be extended however using the curves for the larger apertures. Constructing the extended tail in this way enables the measured PSF to extend out to much greater distances (~5 cm) than could be achieved with the small apertures alone given the dynamic range of the CCD array. Although the tail region now reflects averaged stray light data from a non-negligible aperture size, this approach represents an effective first-order approximation.
3.1.2. Verification of PSF spatial invariance and robustness
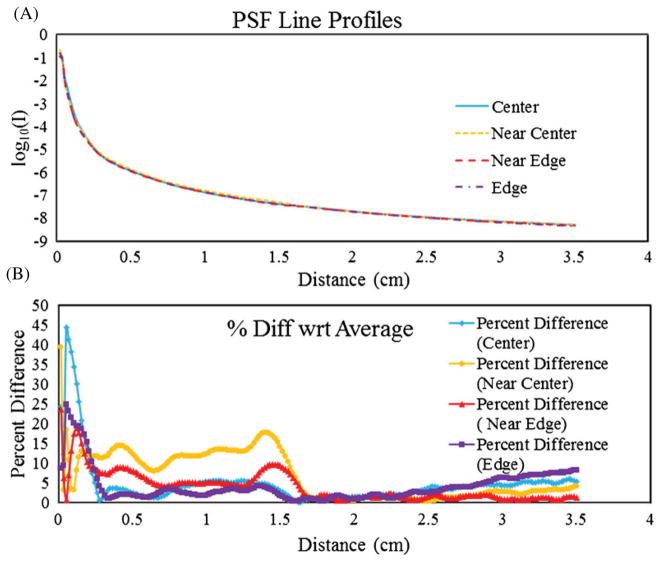
Stray light correction using PSF deconvolution is much simpler to implement if the PSF is spatially invariant. Spatial invariance was investigated by measuring the PSF at four positions starting from the bottom-right corner of the FOV of the scanner and moving radially toward the center. Figure 7(A) shows a series of line profiles of the PSF obtained at the locations tested. The plot is graphed on a logarithmic scale in order to see the slight variation from location to location. The percentage difference, , is plotted in figure 7(B). The biggest differences occur within the first 10 pixels which could be expected with the inherent difficulty in setting up the 200 μm aperture to cover a single pixel to prevent signal averaging over 2–4 pixels that inevitably took place. It is important to note that the significance of the measured differences in these curves is negligible, as is demonstrated in section 3.2 and figure 10.
Figure 7.
(A) Line profiles of PSFs acquired at different locations of the FOV starting near the right edge moving radially toward the center. (B) The percent difference between the values obtained in the PSFs with respect to the mean values in (A). The significance of variation is small as seen in figure 10.
Figure 10.
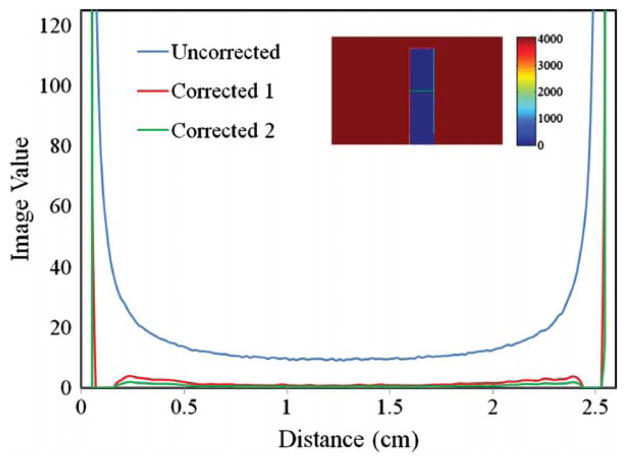
Comparison of line profiles taken along the green line in the inset image of the uncorrected and two corrected profiles; ‘corrected 1’ is the average of the measured PSFs, and ‘corrected 2’ is an extreme case of the measured PSF, reflecting the maximum difference due to the measurement uncertainties observed in figure 7. The inset images’ FOV is ~110 mm × 175 mm (640 × 1010 pixels).
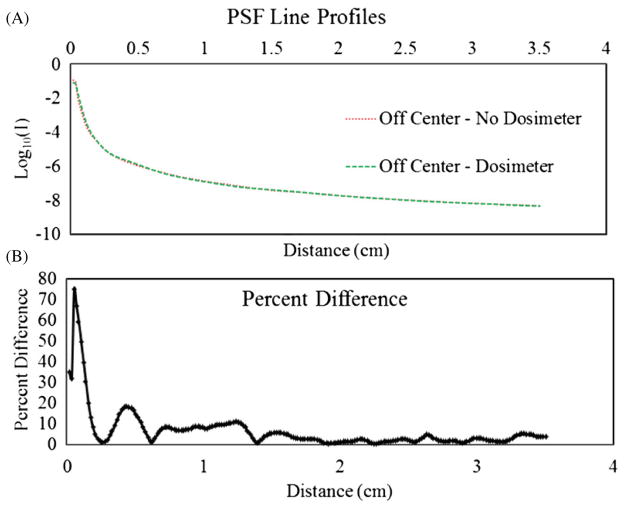
To investigate whether the PSF was altered when a dosimeter was placed in the aquarium, the PSF was re-measured at various locations with an unirradiated dosimeter present. Figure 8 shows the PSF acquired significantly off-axis, close to the edge of the dosimeter where refraction due to fluid–dosimeter interfaces has the greatest impact. Very little change is observed in the off-axis PSF through the unirradiated dosimeter.
Figure 8.
(A) PSF line profiles obtained at the same location through the index matching fluid and an off-center unirradiated dosimeter where extreme angles are present to maximize refraction at the fluid–dosimeter interfaces. (B) Percent differences of the two plots in (A) at each pixel location.
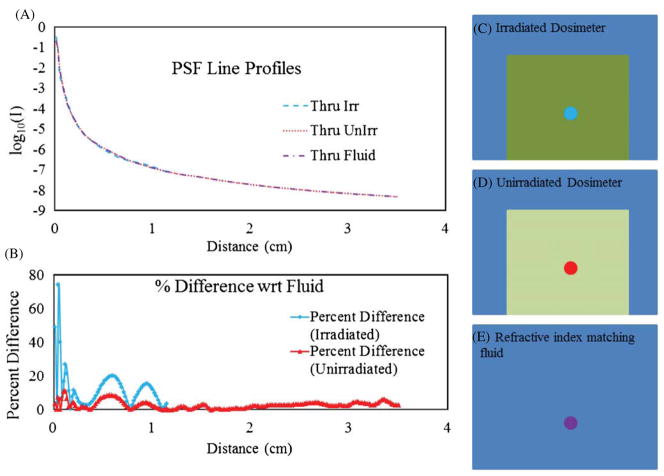
Figure 9 compares PSFs acquired through the center of an unirradiated dosimeter, an irradiated dosimeter and the fluid alone (no dosimeter present). The biggest differences again occur in the first 10 pixels of the measurement and are caused by setup and registration imperfections. The measured PSF tail through the irradiated dosimeter is significantly shorter than that through the unirradiated dosimeter because with the increased attenuation present, the maximum exposure time of the camera was reached sooner bringing the noise floor up after the normalization process. The irradiated dosimeter exhibited significantly more attenuation than the unirradiated dosimeter, limiting the usable dynamic range of the measurement. The good agreement between all measured PSFs regardless of position and presence of an irradiated or unirradiated dosimeter presents a strong case for the viability of stray light correction employing the deconvolution of a measured PSF. A recent report suggested a small increase in the component of stray light as the absorbed dose rises in PRESAGE® (Xu et al 2010). The present results do not support or contradict this finding, because any such increase in scatter would be removed by the telecentric lens and is therefore undetectable with the DLOS. This represents a distinct advantage of the telecentric approach. An additional, and potentially more significant advantage, is that it is likely that the radial symmetry and strong robustness of the PSF under all conditions (e.g. spatial invariance) also arise from the nature of telecentric imaging. We speculate that the narrow aperture stop in the imaging lens, which defines the 0.1° acceptance, facilitates this radial symmetry and spatial invariance.
Figure 9.
(A) Line profiles of the PSF when acquired under varying conditions: through the refractive index matching fluid alone, fluid plus an unirradiated dosimeter, and fluid plus an irradiated dosimeter with (B) the corresponding percent differences in the curves with respect to the fluid measurement. (C) Location of the PSF taken through the irradiated dosimeter. (D) Location of the PSF taken through the unirradiated dosimeter. (E) Location of the PSF taken through the refractive index matching fluid where the schematic represents the entire FOV.
3.2. Evaluation tests
3.2.1. Projection images
The similarity amongst all the PSF curves is notable considering that the variation is typically within 10% of over a range of seven decades. The question arises as to whether the variations in measured PSF correspond to small variations in the correction, such that the PSF can be considered spatially invariant. To answer this question, the correction method was applied to the stray light artifact shown in figure 2 featuring a 25 mm wide light block. The uncorrected image is compared to the corrected image in figure 2, where the line profiles run across the middle of the light block. Figure 10 shows that the variability in the measured PSF has only a very small effect on the correction. The green line labeled ‘corrected 1’ and the blue line labeled ‘corrected 2’ are from different deconvolutions representing extremes of the measured PSF. The green line is the highest PSF measurement taken (see the yellow dashed line in figure 7 labeled ‘near center’) while the blue curve is the averaged PSF taken from all the locations in the same figure. This indicates that the differences in the measured PSF curves are essentially negligible in regards to the performance of the correction, and thus from a practical perspective, can be considered spatially invariant. Figure 10 also shows that the deconvolution correction removed the vast majority of the stray light corrupting the initial reading. Ideally the signal would have gone to zero everywhere behind the block. However, considering the inherent noise in the image and uncertainties in the measured PSF (intended to be a first-order correction), the removal of the majority of stray light is considered a significant success. We also note that the opaque block test is much more extreme than any scenario that could be encountered in clinical application, and thus represents a worst case analysis. The effect of the stray light correction on noise was not negligible. The noise in the flood regions of the uncorrected and corrected images are at 0.09% and 0.20%, respectively. The cost of the correction is essentially a doubling of the noise. This penalty can be mitigated by post-processing and reconstruction. All projection images are downsized from a pixel length of ~175 μm to 1 or 2 mm diminishing a large fraction of the high frequency noise added by the deconvolution.
Filter wheel and ND filters
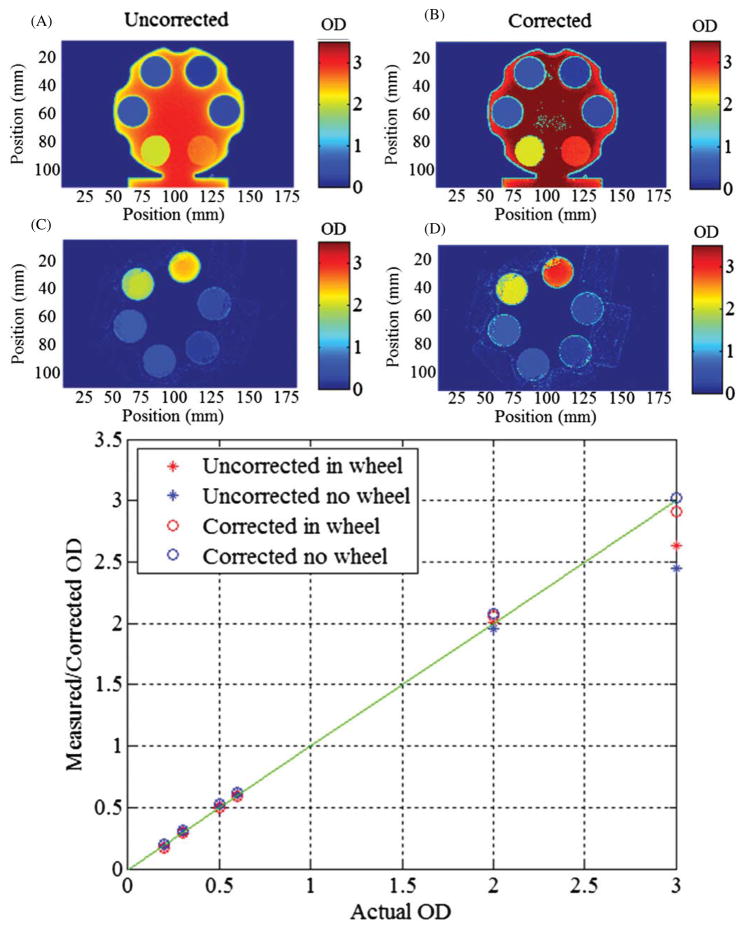
Tests for quantitative accuracy pertaining to the stray light corrections were conducted with ND filters. The filters were imaged simultaneously, and both in and out of an opaque filter wheel, in order to compare the measured OD with the nominal OD value of each filter. It should be noted here that the camera’s theoretical dynamic range based on manufacturer specified temporal dark noise, 9 electrons, and full well capacity, 18 000 electrons yields a theoretical dynamic range of 66 dB, or an OD of 3.3 for images acquired without averaging. This test approaches that limit as the maximum OD tested has a value of 3, but can be achieved regularly with image averaging and deconvolution. The image without the wheel is representative of a higher stray light fraction and similar to dosimetry projections while the image with the filter wheel in place tests an extreme where much less stray light was to be expected. Figure 11 displays both scenarios with uncorrected and corrected images and plots the measured OD versus the reported OD value. For these examples stray light becomes a significant problem after an OD of 2 (transmission of 0.01 or less). Since optical-CT reconstructs attenuation coefficients, a comparison to OD is appropriate as the sinogram requires the data to be in logarithmic form. Differences in OD will lead to inaccuracies in the sinogram and reconstruction. These differences can create situations where varying dose levels will not normalize appropriately at all dose levels.
Figure 11.
(A), (B) The stray light corrected and uncorrected images of the ND filters in the filter wheel, respectively. (C), (D) The corrected and uncorrected images of the ND filters alone, respectively. (E) A plot of the measured and corrected ND filter values versus the manufacturer reported ND values. Discrepancies begin to arise at an OD of 2, with the correction absolutely needed beyond an OD of 2.
3.3. Small field irradiations
The utility of the correction was investigated by application to the determination of small field output factor and linearity measurements. The small field scenario presents the strongest test for a stray light correction, as previously described in section 2.4.2.
3.3.1. Output factors
The measured small field output factors, both uncorrected and corrected, are given in table 1. The elegant feature of this experiment is that the correction affected each beam in different proportion depending on beam size. The larger beams are seen to have smaller corrections, which were expected given that the measurements are taken in the center of each field, meaning the ROIs are further from lower attenuating regions of the dosimeter. On any given projection angle during the scan, the center of a small field (e.g. 5 mm) was in closer proximity to the unirradiated portions of the dosimeter allowing for larger contamination with stray light. One small field had a larger correction than the other mainly due to the geometry of the irradiation. When imaging the 5 mm field placed between the 40 and 20 mm fields as depicted in figure 4, a larger fraction of projection images of the 5 mm field occurred, without an overlapping field, than occurred with the other 5 mm field. Thus a larger correction occurred on a larger fraction of the projection images. The small field irradiation gave a maximum OD of 1.58 (0.026 transmission) over all pixels and projection angles. However, even at this relatively high transmission, corrections of >3% were calculated, indicating that the correction is required when dosimetric accuracy of better than 3% is required. This shows that the correction is still significant at higher transmissions than suggested in the ND filter test (figure 11(E)).
Table 1.
Total scatter factors of a Novalis Tx linear accelerator as measured by the DLOS/PRESAGE® dosimetry system. The impact of the stray light correction on each field shows the most significant effects for the smaller fields. The final column represents the mean factor and standard deviation by which each field changed in each ln(pre/post) projection image due to the stray light correction.
| Field size (mm) | PRESAGE® (before correction) | PRESAGE® (after correction) | Percent change (reconstruction) | Mean factor in projections |
|---|---|---|---|---|
| 30 × 30 | 0.897 | 0.898 | 0.13% | 1.050 ± 0.009 |
| 20 × 20 | 0.886 | 0.890 | 0.44% | 1.068 ± 0.031 |
| 10 × 10 | 0.797 | 0.802 | 0.63% | 1.104 ± 0.056 |
| 5 × 5 | 0.607 | 0.624 | 3.45% | 1.156 ± 0.398 |
| 5 × 5 | 0.599 | 0.614 | 3.11% | 1.178 ± 0.263 |
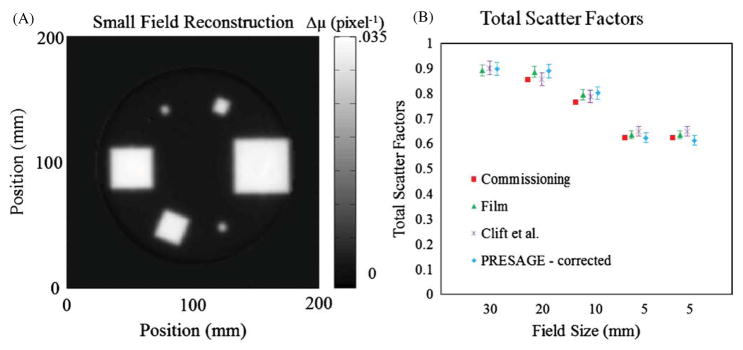
Figure 12 compares the DLOS measured output factors with those reported by Clift et al (2010). Each slice was reconstructed to a FOV of 18 cm represented by a 180 × 180 matrix. Deconvolution processing time is ~17 s per projection image. The figure includes the outputs determined during commissioning with micro-ion chamber, and independently with EBT film, and a prior PRESAGE® experiment where the data was acquired on a raster scanning laser system with negligible stray light. The accuracy of a measurement on a PRESAGE® dosimetry system has been shown to be 3% due to intra-dosimeter non-uniformity, inter-dosimeter differences and aging characteristics (Sakhalkar et al 2009). This value of 3% has been adopted even though the statistical uncertainty in the ROIs suggests that the error may be on the order of 1% or less.
Figure 12.
(A) Reconstructed slice at 5 cm depth used in determination of (B) corrected total scatter factors as shown in table 1 with the addition of the total scatter factors reported in Clift et al (2010) for comparison.
3.3.2. Stray light significance based on OD
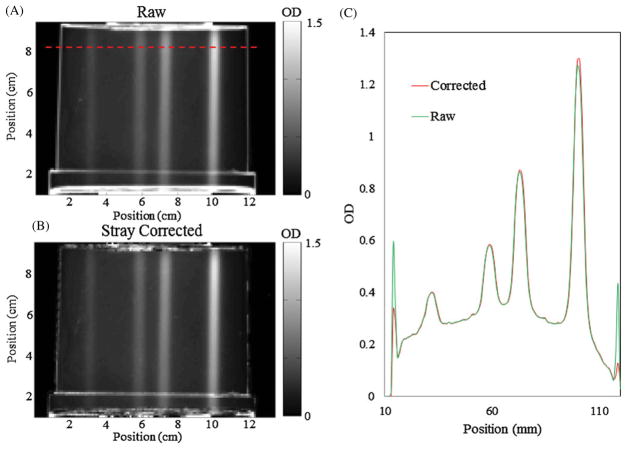
The second small field dosimeter was irradiated four times in different locations with the same field size, but dramatically different doses, in order to investigate when the stray light correction becomes significant relative to the magnitude of radiation induced ΔOD. A representative projection image cropped to 554 × 764 pixels then downsized to 1 mm pixels is shown in figure 13 in both the raw sinogram form and stray light corrected form. The figure shown is of the downsized projection showing the mitigation of the additional noise added from the deconvolution process as well as the differences in the magnitude of the correction for each field. The correction on the 80 Gy field is 2.0% while the correction on the 10 Gy field is only 0.5% in the projection image shown.
Figure 13.
(A) Typical projection image with no stray light correction applied and downsized to 1 mm pixels. (B) The same projection image after the deconvolution of the PSF was applied. (C) Line profile from the dashed line in (A) showing the magnitude of the correction higher for heavier attenuating regions of the dosimeter as well as the general additional noise created as a result of the deconvolution. No smoothing or median filtering was applied to the images and line profiles.
Figure 14 shows a reconstructed slice of the irradiated dosimeter. As the beam intensity increased the stray light correction was expected to increase, and this was observed as shown in figure 14(B). Figure 14(A) indicates typical image quality that we achieve with the DLOS. Excellent reduction of ring artifacts and low noise is achieved through a fluid filtration system and projection image averaging. The fluid is in continuous motion during the acquisition of the flood field and projections reducing the impact of any remaining particulates. The noise observed is on the order of 15 cGy for an 80 Gy delivery. A registration mount allows for the accurate registration and division of the pre- and post-irradiation scans. The registration enables an excellent reduction of the edge artifact associated with the sides of the dosimeter. The well-known linearity of PRESAGE® dose response is also confirmed out to 80 Gy, indicating wide application to treatments of varying dose levels. The data set shown was acquired from 600 projection angles with 25 images averaged per angle over a 360° scan with the data downsized to 1 mm pixel lengths. The reconstructed FOV was cropped to 12 cm and thus the slice shown is represented by a 120 × 120 matrix.
Figure 14.
(A) Optical-CT reconstruction of an irradiation with four 10 × 10 mm2 beams with increasing MUs delivered. Starting at the top and going clockwise 12 800 (80 Gy), 3200 (20 Gy), 1600 (10 Gy) and 6400 MUs (40 Gy) were delivered. (B) Line profile of the reconstruction in (A) passing through the 12 800 and 1600 MU fields showing extremely low noise relative to the contrast. (C) The measured and corrected Δμs for each beam respective to the number of MUs delivered. The correction plays a bigger role for optically denser fields. The blue fit line was created by placing a line through the means of the two lower dose fields.
The post-scan OD values in the projections ranged from 0.4 to 1.8 depending on the position and arrangement of the irradiated fields relative to the lenses. The noise level seen in the scans are 0.4% of the maximum intensity reconstructed value. Plotted in blue is a line fitted to the mean values for the two lower OD fields for corrected and uncorrected as there was very little change in the correction (<1.5%) relative to the two more intense fields. Reconstruction values were increased by 1.3%, 1.5%, 1.8% and 2.4% when stray light corrected as the beam intensity increased. Although the OD values in the scan were always less than 2 (commonly only 1.2 for the highest intensity field), the correction still shows a non-negligible change in the reconstructed value as compared to the noise level for the highest intensity field and should not be ignored.
4. Conclusion
The key advantage of broad-beam optical-CT systems is the dramatic increase in speed. Scan times with the DLOS for large dosimeters (16 cm diameter, with an isotropic resolution of 1 mm) are within 10 min, as opposed to many hours with the first generation systems (Gore et al 1996, Maryanski et al 1996). Hardware improvements could potentially increase these speeds even further. The cost to this increase in speed is a greater sensitivity to stray and scattered light, and this fact has limited the use of broad-beam configurations to date. This work demonstrates that when using a telecentric configuration in combination with a low-scattering radiochromic dosimeter, the deconvolution of a one-time measured PSF is an effective first-order correction for residual stray light. In the DLOS system almost all this stray light originates in the lenses and components of the optical chain, and not in the dosimeter or filtered fluid. The correction is possible because the telecentric lens removes stray light originating in the aquarium or dosimeter. The correction works by deconvolving a spatially invariant PSF for each projection image. Tests with known ODs were used to validate the PSF and deconvolution method out to an OD of 3, corresponding to 60 dB. This corresponds approximately to the dynamic range of the camera, and now the system as a whole, which is a substantial improvement over the prior limit of ~30 dB. The data presented here suggest that the correction is small (~3–4%) for lightly dosed dosimeters where the maximum OD is <1.5. The correction should be considered, however, for any dosimeter where very accurate dosimetry is required. The stray light correction will have the largest impact in heavily irradiated dosimeters (large ODs) coupled with high gradient regions, and corrections of >10% have been observed in extreme cases. The correction method has the ability to reduce stray light artifacts and make more accurate dosimetric measurements and may be extended to other broad-beam systems provided the PSF is spatially invariant and a low scatter, absorption contrast dosimeter is used.
References
- Adamovics J, Maryanski MJ. Characterisation of PRESAGE: a new 3-D radiochromic solid polymer dosemeter for ionising radiation. Radiat Prot Dosim. 2006;120:107–12. doi: 10.1093/rpd/nci555. [DOI] [PubMed] [Google Scholar]
- Andersen UL, et al. Progress in Optics. Amsterdam: Elsevier; 1999. [Google Scholar]
- Babic S, McNiven A, Battista J, Jordan K. Three-dimensional dosimetry of small megavoltage radiation fields using radiochromic gels and optical CT scanning. Phys Med Biol. 2009;54:2463–81. doi: 10.1088/0031-9155/54/8/014. [DOI] [PubMed] [Google Scholar]
- Bartles RH, Beatty JC, Barsky BA. An Introduction to Splines for use in Computer Graphics and Geometric Modelling. San Francisco, CA: Morgan Kaufmann; 1998. [Google Scholar]
- Biggs DS, Andrews M. Acceleration of iterative image restoration algorithms. Appl Opt. 1997;36:1766–75. doi: 10.1364/ao.36.001766. [DOI] [PubMed] [Google Scholar]
- Bosi SG, Brown S, Sarabipour S, De Deene Y, Baldock C. Modelling optical scattering artefacts for varying pathlength in a gel dosimeter phantom. Phys Med Biol. 2009;54:275–83. doi: 10.1088/0031-9155/54/2/007. [DOI] [PubMed] [Google Scholar]
- Bushberg JT, Seibert JA, Edwin J, Leidholdt M, Boone JM. The Essential Physics of Medical Imaging. 2. Baltimore, MD: Lippincott, Williams and Wilkins; 2002. [Google Scholar]
- Clift C, Thomas A, Adamovics J, Chang Z, Das I, Oldham M. Toward acquiring comprehensive radiosurgery field commissioning data using the PRESAGE/optical-CT 3D dosimetry system. Phys Med Biol. 2010;55:1279–93. doi: 10.1088/0031-9155/55/5/002. [DOI] [PMC free article] [PubMed] [Google Scholar]
- Fricke H, Morse S. The chemical action of Röntgen rays on dilute ferrosulfate solutions as a measure of dose. Am J Roentgenol. 1927;18:430. [Google Scholar]
- Gore JC, Ranade M, Maryanski MJ, Schulz RJ. Radiation dose distributions in three dimensions from tomographic optical density scanning of polymer gels: I. Development of an optical scanner. Phys Med Biol. 1996;41:2695–704. doi: 10.1088/0031-9155/41/12/009. [DOI] [PubMed] [Google Scholar]
- Guo PY, Adamovics JA, Oldham M. Characterization of a new radiochromic three-dimensional dosimeter. Med Phys. 2006;33:1338–45. doi: 10.1118/1.2192888. [DOI] [PMC free article] [PubMed] [Google Scholar]
- Kelly RG, Jordan KJ, Battista JJ. Optical CT reconstruction of 3D dose distributions using the ferrous-benzoic-xylenol (FBX) gel dosimeter. Med Phys. 1998;25:1741–50. doi: 10.1118/1.598356. [DOI] [PubMed] [Google Scholar]
- Krstajic N, Doran SJ. Focusing optics of a parallel beam CCD optical tomography apparatus for 3D radiation gel dosimetry. Phys Med Biol. 2006;51:2055–75. doi: 10.1088/0031-9155/51/8/007. [DOI] [PubMed] [Google Scholar]
- Lucy LB. An iterative technique for the rectification of observed distributions. Astron J. 1974;79:745–54. [Google Scholar]
- Lyon RG, Dorband JE, Hollis JM. Hubble space telescope faint object camera calculated point-spread functions. Appl Opt. 1997;36:1752–65. doi: 10.1364/ao.36.001752. [DOI] [PubMed] [Google Scholar]
- Maryanski MJ, Zastavker YZ, Gore JC. Radiation dose distributions in three dimensions from tomographic optical density scanning of polymer gels: II. Optical properties of the BANG polymer gel. Phys Med Biol. 1996;41:2705–17. doi: 10.1088/0031-9155/41/12/010. [DOI] [PubMed] [Google Scholar]
- Oldham M. Optical-CT scanning of polymer gels. J Phys : Conf Ser. 2004;3:122–35. doi: 10.1088/1742-6596/3/1/011. [DOI] [PMC free article] [PubMed] [Google Scholar]
- Pawley J. Handbook of Biological Confocal Microscopy. Berlin: Springer; 2006. [Google Scholar]
- Radon J. On the determination of functions from their integral values along certain manifolds. IEEE Trans Med Imaging. 1986;5:170–6. doi: 10.1109/TMI.1986.4307775. [DOI] [PubMed] [Google Scholar]
- Richardson WH. Bayesian-based iterative method of image restoration. J Opt Soc Am. 1972;62:55–9. [Google Scholar]
- Robertson MA, Borman S, Stevenson RL. Proc. Int. Conf. on Image Processing, ICIP 99; 1999. pp. 159–63. [Google Scholar]
- Sakhalkar HS, Adamovics J, Ibbott G, Oldham M. A comprehensive evaluation of the PRESAGE/optical-CT 3D dosimetry system. Med Phys. 2009;36:71–82. doi: 10.1118/1.3005609. [DOI] [PMC free article] [PubMed] [Google Scholar]
- Sakhalkar HS, Oldham M. Fast, high-resolution 3D dosimetry utilizing a novel optical-CT scanner incorporating tertiary telecentric collimation. Med Phys. 2008;35:101–11. doi: 10.1118/1.2804616. [DOI] [PMC free article] [PubMed] [Google Scholar]
- Savitzky A, Golay MJE. Smoothing and differentiation of data by simplified least squares procedures. Anal Chem. 1964;36:1627–39. [Google Scholar]
- Sondhi M. Image restoration: the removal of spatially invariant degradations. Proc IEEE. 1972;60:842–53. [Google Scholar]
- Thomas A, Pierquet M, Jordan K, Oldham M. A method to correct for spectral artifacts in optical-CT dosimetry. Phys Med Biol. 2011;56:3403–16. doi: 10.1088/0031-9155/56/11/014. [DOI] [PMC free article] [PubMed] [Google Scholar]
- Wolodzko JG, Marsden C, Appleby A. CCD imaging for optical tomography of gel radiation dosimeters. Med Phys. 1999;26:2508–13. doi: 10.1118/1.598772. [DOI] [PubMed] [Google Scholar]
- Xu Y, Adamovics J, Cheeseborough JC, Chao KS, Wuu CS. Light scattering in optical CT scanning of Presage dosimeters. J Phys : Conf Ser. 2010;250:012063. [Google Scholar]


