Abstract
Optical-computed tomography (CT) and optical-emission computed tomography (ECT) are recent techniques with potential for high-resolution multi-faceted 3D imaging of the structure and function in unsectioned tissue samples up to 1–4 cc. Quantitative imaging of 3D fluorophore distribution (e.g. GFP) using optical-ECT is challenging due to attenuation present within the sample. Uncorrected reconstructed images appear hotter near the edges than at the center. A similar effect is seen in SPECT/PET imaging, although an important difference is attenuation occurs for both emission and excitation photons. This work presents a way to implement not only the emission attenuation correction utilized in SPECT, but also excitation attenuation correction and source strength modeling which are unique to optical-ECT. The performance of the correction methods was investigated by the use of a cylindrical gelatin phantom whose central region was filled with a known distribution of attenuation and fluorophores. Uncorrected and corrected reconstructions were compared to a sectioned slice of the phantom imaged using a fluorescent dissecting microscope. Significant attenuation artifacts were observed in uncorrected images and appeared up to 80% less intense in the central regions due to attenuation and an assumed uniform light source. The corrected reconstruction showed agreement throughout the verification image with only slight variations (~5%). Final experiments demonstrate the correction in tissue as applied to a tumor with constitutive RFP.
1. Introduction
Optical-emission computed tomography (optical-ECT) was proposed by Sharpe et al (2002) as a tool for imaging gene expression in small (1–9 mm3) mouse embryos by means of fluorescently labeled proteins and antibodies. This imaging modality allowed for a high-resolution 3D image of an optically cleared embryo or other biological tissue. One limit to the imaging technique was a lack of quantitative accuracy of the fluorophore concentration being imaged due to remaining absorbers and scatterers attenuating the signal post clearing (Oldham et al 2008). This problem has been addressed by several authors (Kim et al 2008, Soubret et al 2005, Vinegoni et al 2009, Darrell et al 2008), but a complete correction has remained elusive. Initial work accounted for the attenuation of the emitted photons upon excitation as they traverse the tissue to be recorded by the optical-ECT imaging system (Kim et al 2008). This correction was incomplete as it did not account for either the attenuation of the excitation photons as they traversed the tissue to excite the fluorophore nor the spatial non-uniformities of the excitation light source. Reconstructed images using only the emission correction still resulted in what appeared to be attenuation artifacts typically seen in PET or SPECT imaging even though the emission correction had been modeled in the reconstruction algorithm. In order for optical-ECT images to be an accurate representation of the physical situation, an excitation correction algorithm needed to be applied. In this work we present the first complete attenuation correction algorithm with non-uniformities in the excitation source within an iterative reconstruction framework for parallel beam optical-ECT to obtain quantitatively accurate 3D images of a desired fluorophore concentration.
2. Methods
The optical-ECT imaging system is described in section 2.1. This system is an improved version of a prior system described in (Oldham et al 2007). There are three major improvements; two in relation to the light source and the last deals with the mounting of the sample. First, there are now two opposing excitation sources giving more uniform coverage and second, the light sources are now collimated making more efficient use of the light. Lastly, the sample is no longer placed within agarose gel or a glass vial. The sample is now glued to the stage for imaging. Modeling the physical characteristics of the imaging system to the parameters of the reconstruction algorithm is described in section 2.2. Section 2.3 details a phantom study designed to validate and verify the performance of the attenuation correction algorithm and section 2.4 introduces an application to tissue measuring the constitutive RFP distribution in a 4T1 xenograft breast tumor.
2.1. Optical CT/ECT imaging system
A schematic of the optical-computed tomography(CT)/ECT imaging system is shown in figure 1. An optically cleared tissue sample is placed on a rotating stage within an anti-reflection coated glass aquarium. The optical clearing process consists of fixing a tissue sample in increasing concentrations of ethanol/water solutions over a 1 week period until pure ethanol is reached. After fixing the sample in ethanol it is transferred to methyl salicylate for 48 h. This process replaces the low refractive index of ethanol with a higher refractive index of methyl salicylate which closely matches the refractive index of the remaining cellular tissue. The aquarium is filled with methyl salicylate such that the indices of refraction of the fluid and the tissue sample are matched to minimize the reflection and refraction distortions of incident light. As the sample rotates, projection images are mapped to a CCD array via a telecentric lens, which only utilizes light rays that are near parallel (variable from ~0.1° to ~10°) to the optic axis, set at ~2° (Wang and Wang 2007). The spatial resolution of the system is limited by the depth of field (DOF) of the imaging lens to approximately 1.4 times the resolution of each projection image. The DOF is a function of, among other attributes, the acceptance angle of the lens set by adjusting the aperture size. The projection images represent transmitted light in optical-CT and emitted light in optical-ECT after the appropriate filters are applied to the lens and light source. Generally, 360 projection images with three averages each are acquired in 1° increments. Each projection is then flood field and dark image corrected.
Figure 1.
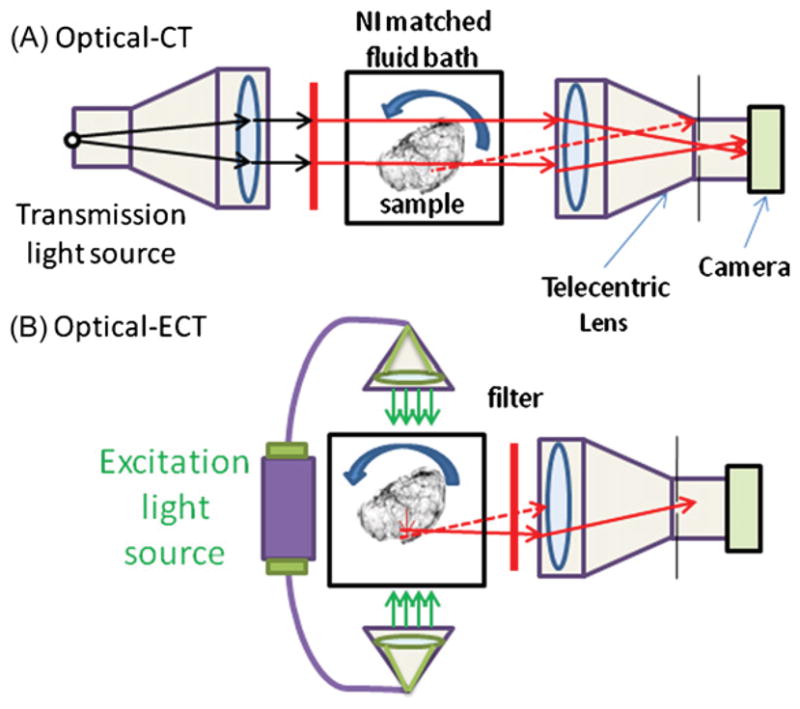
Schematic of optical-CT/ECT systems for imaging cleared tissue samples. The system makes use of a telecentric lens to reduce the number of scattered photons and to acquire accurate line integrals. Dashed lines represent possible light rays not traveling parallel to the optical axis and therefore rejected by the lens. (A) Optical-CT mode. A collimated light source is used to transmit a parallel beam through the sample and filter to acquire reconstructions at the desired wavelength. (B) Optical-ECT mode. Two excitation sources enter the tissue anti-parallel to each other and perpendicular to the image axis of the telecentric lens.
2.1.1. Optical-CT
Optical-CT images are acquired by placing a telecentric light source in line with a telecentric imaging lens. Light rays pass from the source and through the sample where they are differentially attenuated and continue through to the telecentric lens where they are imaged onto the 12 bit monochrome CCD array. The stage is then rotated 1° and the process repeated 360 times. The projection images are then processed through a filtered back projection algorithm.
2.1.2. Optical-ECT
To acquire optical-ECT data sets two matching illuminators are coupled to liquid optical fibers and then collimated to excite the sample on each side orthogonal to the optic axis. Excitation and emission filters are placed on the light source and telecentric lens to enable the imaging of the desired fluorophore. Like optical-ECT the stage is rotated in 1° increments and repeated until a 360° rotation is completed. Shutters are used to block the excitation light and prevent photo-bleaching in between imaging frames. An iterative reconstruction technique that corrects for the light source strengths, excitation attenuation and emission attenuation is then applied.
2.2. Optical-ECT corrections
The correction is performed by modeling photon excitation source strength, excitation attenuation, and emission attenuation to account for the spatial differences within the sample and imaging equipment. This work follows earlier work (Kim et al 2008) in which emission attenuation was modeled within a similar iterative framework. The above optical emission imaging system can be described as follows:
| (1) |
where Mi is the expected number of photons detected at CCD pixel i, Bi is the background number of photons detected at CCD pixel i, nvox is the number of image voxels, Sj is the expected number of excitation photons to reach voxel j, λj is the expected number of emission photons emitted from voxel j per excitation photon reaching voxel j, and Pij is the probability that a photon emitted from voxel j is detected at pixel i. Signal output from the CCD is treated as a value proportional to the number of photons detected since the CCD chip collects electric charge as electrons generated from the photoelectric effect are collected within a capacitor making no distinction between high and low energy photons. This statement disregards the quantum efficiency at each wavelength, however, filters between the imaging sample and detector result in an approximately monoenergetic spectrum at the detector. The aim is to obtain a map of λj as it is proportional to the concentration of the desired fluorophore in voxel j.
The image reconstruction is based on a log likelihood function l that measures the agreement between measured and expected values in the projections. Because the detected photons are essentially mono-energetic, noise in the measured projection data can be described via a simple Poisson model. The log likelihood is defined as
| (2) |
where npix is the number of projection pixels, and Mi and Yi are, respectively, the expected and measured number of photons at CCD detector pixel i. The measured number of photons Yi is obtained from the detector signal Di at pixel i as Yi = Di/α, where α is the detector signal per photon.
Equation (1) has the same formal structure as system models for SPECT, with Sjλj in equation (1) corresponding to λj in SPECT. Consequently, an optical-emission EM algorithm for increasing the log likelihood given by equations (1) and (2) can be obtained by replacing λj in the SPECT EM algorithm of Shepp and Vardi (1982), Lange and Carson (1984) with Sjλj. Setting that optical-emission EM algorithm into ordered subsets form then gives an optical-emission analog to the SPECT OSEM algorithm of Hudson and Larkin (1994). An optical-emission OSEM algorithm for increasing the log likelihood given by (1) and (2) is thus
| (3) |
where n is the iteration number, h specifies a subset of the projection data, (n, h)+ is the iteration and subset following (n, h).
Herein the above model is implemented with a rotating projector. The model incorporates measured values for excitation attenuation, for emission attenuation, and, for unattenuated excitation-light intensity, and , where nfixed is the number of voxels on the fixed grid and the superscript f refers to the fixed grid. Here and are the linear attenuation coefficients per voxel length for voxel j at the excitation and emission wavelengths. The attenuation maps Mex and Mem—respectively for excitation and emission wavelengths—are obtained by optical-CT. For each rotation angle of the sample, Mex, Mem, and currently estimated Λ = {λk:k = 1, nvox} are interpolated onto a fixed grid, as illustrated in figure 2. The quantity is then computed
Figure 2.
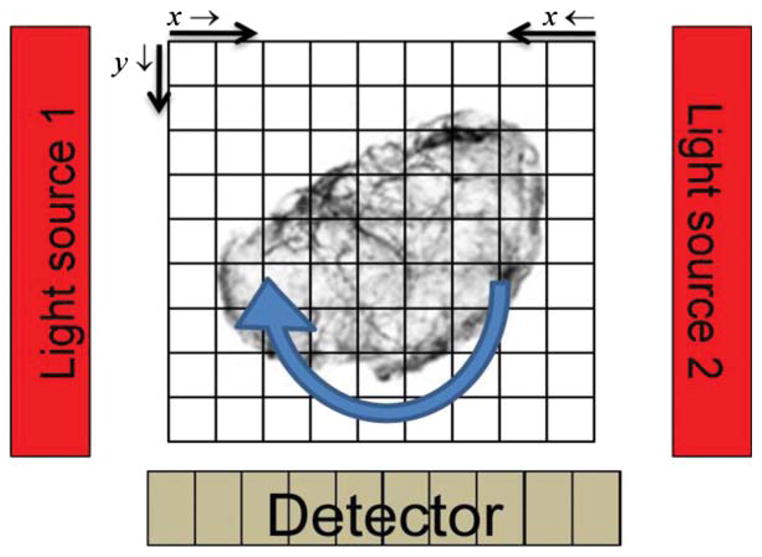
Illustration showing the use of a rotating projector placed on a fixed image reconstruction grid denoting the orientation of the indices in equations (4)–(6).
| (4) |
and the attenuation of emission photons is factored into by
| (5) |
where is the unattenuated number of excitation photons from each respective source. x is the column number and y is the row number. In both equations (4) and (5) the arrows indicate the voxel path direction of summation for each variable and are illustrated in figure 2. η is the quantum and geometric efficiency of the CCD for the detection wavelength. Given the physical relationship between the detector and the source it can be seen that the expected number of non-background photons from any given fixed-grid voxel should be
| (6) |
The non-uniformity of the excitation source can also be modeled through Sj. Since Pij is only modeling the emission attenuation it is now possible to input the beam intensity in different regions of space by imaging the unattenuated excitation source with the telecentric lens and CCD array and placing those values directly into the terms. Emission images λ = {λj:j = 1, nvox} can be reconstructed more accurately with measurements of the terms for the unattenuated flux of excitation photons into all fixed voxels j. Attenuation j maps of μex and μem are obtained through optical-CT imaging at the respective wavelengths for attenuation modeling. Incorporating these measurements into the system model makes excitation attenuation, emission attenuation and excitation intensity corrections based on directly measured data for the specimen and imaging system.
2.3. Validation of attenuation correction
The attenuation correction model was tested using a phantom of known attenuation and fluorescence characteristics. The phantom was designed to undergo optical-ECT imaging followed by an independent measurement for comparison and verification of the fluorophore distribution. The phantom consisted of an optically transparent cylindrical 9% gelatin mass 1 cm high and 3.1 cm in diameter (figure 3). The center of the phantom was approximately cuboidal (12 × 12 mm2 cross section) in shape doped with India ink, Texas Red, and gelatin, such that there was uniform attenuation (μ ~ 2 cm−1) and fluorescence. The phantom’s doped ink center attenuated both the incoming excitation photons as well as the exiting emission photons creating a situation where severe attenuation artifacts would be expected in traditional filtered back projection reconstructions.
Figure 3.
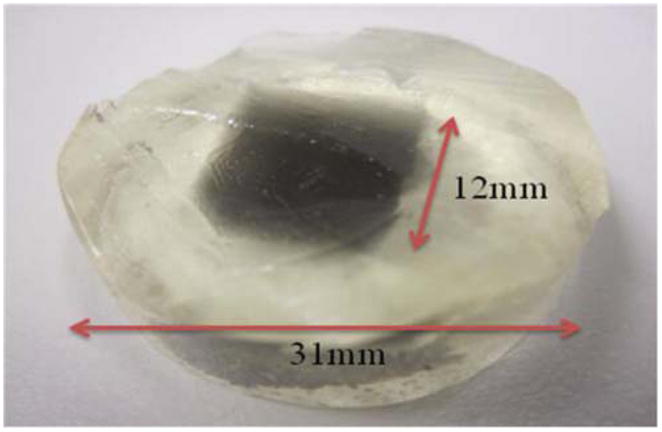
Photograph of the gelatin phantom with an ink and Texas Red doped cuboidal core.
The phantom was fabricated by pouring a 65 °C mixture of 7 g of gelatin and 75 mL of water in a cylindrical vial 3.1 cm inner diameter with an optical cuvette placed in the center displacing where the ink doped center would eventually be located. During the solidification, ink was added to a 10 mL solution of the same gelatin/water concentration to give an attenuation coefficient of 2 cm−1 which was verified with a spectrophotometer. The optical cuvette was then removed by pouring hot water in it, thus melting the edges of the gelatin allowing for the cuvette to slide out. A mixture of gelatin/ink/fluorescent dye was then added to the center cuboidal region where the cuvette was previously occupied and allowed to solidify. Finally, the glass vial containing the phantom was placed in warm water to melt the edges of the phantom allowing it to slide out of the glass container.
The phantom was placed on the imaging system’s rotation stage in an index matching fluid consisting of a 50% glycerol–water mixture. The excitation filters were matched 545 nm ± 10 nm bandwidths and the emission filter had a 630 nm ± 30 nm acceptance window. At 1° increments, 360 optical-ECT projections were acquired with four snapshots per projection averaged together to increase the SNR in each projection. Successive 180 projection, 180° optical-CT scans were acquired at the emission and excitation wavelengths to produce the attenuation maps required for attenuation correction. Camera integration times were 0.125s, 0.005 s and 0.004 s for the red emission, red attenuation and green attenuation scans, respectively. Fifty flood and dark images were taken and averaged for each data set to correct each projection for detector variability and offset.
The projection images were acquired with a 0.25 × lens and downsized by a factor of 4 for reduced computation time. These factors bring the spatial resolution to 300 μm for the reconstructed data set. The attenuation maps were formed using Matlab’s iradon transformation and the optical-ECT image was reconstructed using a Matlab based OSEM function with the modeled parameters and physical characteristics discussed in section 2.2. The reconstruction consisted of 3 iterations and 36 subsets.
Due to the uncertainty in homogeneity of the fluorescent dye, the phantom was sliced to create a transverse plane and imaged for fluorescent dye distribution verification using a Zeiss fluorescent microscope with a DSRed filter set using an axioCam camera. This image represented a measurement of the actual fluorescent distribution and was used to compare with the corresponding reconstructed image slice.
2.4. Tissue imaging applications
The complete correction method is illustrated by application to a 4T1 breast tumor with constitutive RFP with independent imaging comparisons.
2.4.1. Tissue preparation
The 4T1 breast tumor cells were transfected with reporter genes for constitutive RFP expression. The tumor was grown in the hind leg of a nude mouse. Before the tumor could be imaged optical clearing was necessary. The tissue was fixed in increasing ethanol/water solutions for 7 days followed immediately by its placement into a 100% solution of methyl salicylate for completion of the clearing process while preserving the fluorescence signal. Optical-ECT images of the tumor would yield regions of viable tumor cells as the necrotic tissue would not express RFP.
2.4.2. Tissue optical-ECT imaging
The sample was fixed to the rotation stage with glue and the aquarium was filled with methyl salicylate for refractive index matching. The sample was imaged three times: once for emission and twice for transmission (once each at both the excitation and emission wavelengths). Over 360° of rotation, 360 projections were acquired for the emission and both attenuation image sets. Each projection was acquired three times and averaged together for SNR improvement in the projections. The filter set used consisted of two matching 540 ± 20 nm excitation filters and one 600 ± 25 nm emission filter for RFP imaging. Camera integration times were 0.211 s, 0.011 s, and 0.014 s for the red emission, red attenuation, and green attenuation scans, respectively. The data were acquired using a 1 × lens and downsized by a factor of 4 for an imaging resolution of 80 μm. The iterative reconstruction consisted of 5 iterations with 36 subsets. Uncorrected and fully corrected images were reconstructed for comparison.
2.4.3. Tissue fluorescent microscopy imaging
Upon completion of optical-ECT imaging, the tumor was rehydrated in sucrose + PBS. The tumor was sliced into 30 μm slices and the central slice was used for validation. The sample was then imaged under a fluorescent dissecting microscope for validation.
3. Results and discussion
3.1. Phantom study
Representative projections of the phantom utilizing both optical-CT and optical-ECT are shown in figure 4. In the optical-CT projection, the ink doped core is attenuating a significant portion of photons as they traverse through it creating the dark center, while the outer regions have little to no attenuation present. This is in contrast to the optical-ECT projection where the ink doped core is bright indicating the presence of the fluorescent dye. The remainder of the projection is very dark as no fluorescence was placed in the clear portion of the phantom.
Figure 4.
Representative (A) attenuation and (B) emission projections of the gelatin phantom taken during the data acquisition process with a DS Red filter set. The ink doped center of the phantom is dark in (A) as well as noticeable edge artifacts at the phantom’s boundary. Only the ink doped core is visible in the emission projection. The edges of the core appear more intense due to the attenuation of the excitation light as it travels from the edges to the center. The majority of the fluorophores present appear toward the top of the phantom due to imperfect mixing and the non-uniform light source.
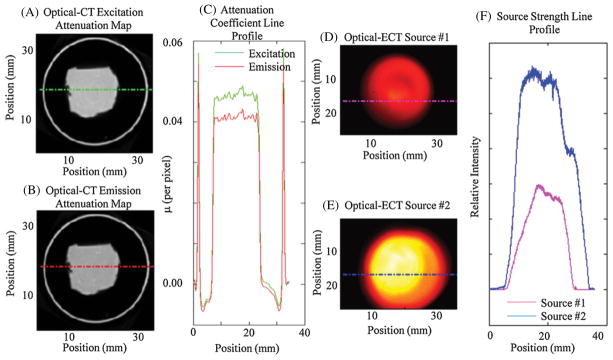
The emission and excitation attenuation maps that are used directly in the calculation of the probability matrix are shown in figure 5. The optical-CT reconstructed pixel values represent the linear attenuation coefficient per pixel length for the respective emission/excitation wavelength. As expected, the excitation attenuation map has slightly higher values than the emission map. Also shown in figure 5 are the measured source strengths for each slice and line profiles.
Figure 5.
(A) and (B) The excitation and emission attenuation maps. The rings surrounding the inked core are edge artifacts representing the boundary of the phantom which are common to optical-CT images. (C) The line profile accompanying the red dashed line on the attenuation maps showing a higher attenuation coefficient for the lower wavelength photons with noticeable edge artifacts (e.g. rings surrounding the inked core). (D) and (E) The source strength maps acquired to model the variation in source strength over the emission projections. (F) The corresponding line profiles in (D) and (E). The data from (A), (B), (D) and (E) represent the input data at which the reconstructed slice shown in figure 6 was utilized for reconstruction.
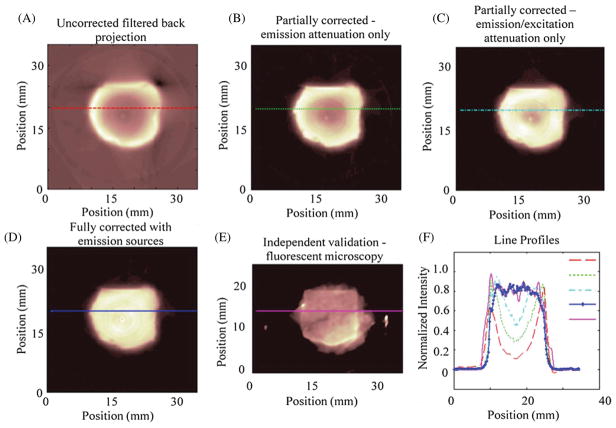
Figure 6 shows a representative reconstructed slice from the phantom in an uncorrected state using filtered back projection, an emission corrected state using OSEM with 3 iterations and 36 subsets, a uniform source assumption excitation/emission corrected state, a non-uniform source excitation/emission corrected state, and a fluorescent snapshot showing the measured distribution acquired using a Leica MZFlIII with a DS Red filter set illuminated by an Exfo Excite PC120 and captured with an Axiocam mrm. A line profile was taken to show the reconstructed versus measured values. Depressions in the central regions of the reconstructions without full correction range from 50% to 80% deviation from the actual distribution relative to the edges. The fully corrected results are consistent to the expected and measured values and emphasize the importance of complete attenuation correction and accounting for non-uniformities in the source strength.
Figure 6.
(A) An uncorrected image reconstructed using filtered back projection. (B) An emission attenuation corrected image. (C) An excitation and emission corrected image assuming uniform source strength. (D) An excitation and emission corrected image with measured source strengths also modeled. (E) A verification image of a sectioned slice taken with a fluorescent dissecting microscope showing the actual fluorophore distribution within the sample. (E) A plot of the line profiles through the lines on the images (A)–(E). Notice the significant depressions that result from incomplete modeling of the imaging system.
3.2. Tissue imaging
An optical-ECT image was obtained to verify the algorithm works as well in tissue as it does in engineered phantoms. Figure 7 shows projections of the same angle of both optical-ECT and optical-CT for the tumor. Bright spots in the optical-ECT images represent the fluorophores being excited and imaged by the detector. Bright spots in optical-CT represent line integrals of least attenuation and the dark spots indicate regions of intense attenuation, most likely due to any remaining blood within the sample at the time of death as the clearing process does not clear pigments within the tissues. The dashed red line in figure 7 represents the central slice used for validation. Figure 8 shows the comparison of fluorescent microscopy with an optical-ECT corrected image and an overlay of the two images. The sliced image shows good general correlation with the corrected image despite its slight disfiguration. However, the corrected image is not perfect, as evidenced by the hot spots that are absent in the validation image.
Figure 7.
(A) A transmission projection of the 4T1 tumor. Dark areas represent highly attenuating line integrals. (B) An emission projection of the 4T1 tumor where bright areas represent measured fluorescence along the path perpendicular to the detector.
Figure 8.
4T1 tumor verification RFP image set. (A) A fully corrected RFP emission image. (B) A verification RFP image windowed to show the outline of the tumor with the bright central region of the tumor representing the signal. (C) A false color corrected tumor image from (A) overlaid onto the verification image in (B) showing agreement in the elevated core of the tumor.
4. Conclusion
Comprehensive modeling of the physical processes in optical-ECT, including the attenuation of both emission and excitation photons as well as non-uniformities in source strength, was successfully implemented allowing for quantitatively accurate emission image reconstructions. We have shown the importance of modeling these significant aspects of the imaging process to reconstructing accurate fluorescent images. The performance of the method was verified by a phantom study to predict how the technique would extend to extract quantitatively meaningful images from tissue samples. This work represents the first successful attempt, that we are aware off, to include such a complete set of corrections to optical-ECT imaging. This method lays the groundwork for more widespread applications of the imaging technique and provides a compelling reason to use optical-ECT for obtaining a combination of quantitatively accurate functional and structural images in 3D.
References
- Darrell A, Meyer H, Marias K, Brady M, Ripoll J. Weighted filtered backprojection for quantitative fluorescence optical projection tomography. Phys Med Biol. 2008;53:3863–81. doi: 10.1088/0031-9155/53/14/010. [DOI] [PubMed] [Google Scholar]
- Hudson HM, Larkin RS. Accelerated image reconstruction using ordered subsets of projection data. IEEE Trans Med Imaging. 1994;13:601–9. doi: 10.1109/42.363108. [DOI] [PubMed] [Google Scholar]
- Kim E, Bowsher J, Thomas AS, Sakhalkar H, Dewhirst M, Oldham M. Improving the quantitative accuracy of optical-emission computed tomography by incorporating an attenuation correction: application to HIF1 imaging. Phys Med Biol. 2008;53:5371–83. doi: 10.1088/0031-9155/53/19/007. [DOI] [PMC free article] [PubMed] [Google Scholar]
- Lange K, Carson R. EM reconstruction algorithms for emission and transmission tomography. J Comput Assist Tomogr. 1984;8:306–16. [PubMed] [Google Scholar]
- Oldham M, Sakhalkar H, Oliver T, Johnson GA, Dewhirst M. Optical clearing of unsectioned specimens for three-dimensional imaging via optical transmission and emission tomography. J Biomed Opt. 2008;13:021113. doi: 10.1117/1.2907968. [DOI] [PMC free article] [PubMed] [Google Scholar]
- Oldham M, Sakhalkar H, Wang YM, Guo P, Oliver T, Bentley R, Vujaskovic Z, Dewhirst M. Three-dimensional imaging of whole rodent organs using optical computed and emission tomography. J Biomed Opt. 2007;12:014009. doi: 10.1117/1.2709858. [DOI] [PubMed] [Google Scholar]
- Sharpe J, Ahlgren U, Perry P, Hill B, Ross A, Hecksher-Sorensen J, Baldock R, Davidson D. Optical projection tomography as a tool for 3D microscopy and gene expression studies. Science. 2002;296:541–5. doi: 10.1126/science.1068206. [DOI] [PubMed] [Google Scholar]
- Shepp LA, Vardi Y. Maximum likelihood reconstruction for emission tomography. IEEE Trans Med Imaging. 1982;1:113–22. doi: 10.1109/TMI.1982.4307558. [DOI] [PubMed] [Google Scholar]
- Soubret A, Ripoll J, Ntziachristos V. Accuracy of fluorescent tomography in the presence of heterogeneities: study of the normalized Born ratio. IEEE Trans Med Imaging. 2005;24:1377–86. doi: 10.1109/tmi.2005.857213. [DOI] [PubMed] [Google Scholar]
- Vinegoni C, Razansky D, Figueiredo JL, Nahrendorf M, Ntziachristos V, Weissleder R. Normalized Born ratio for fluorescence optical projection tomography. Opt Lett. 2009;34:319–21. doi: 10.1364/ol.34.000319. [DOI] [PMC free article] [PubMed] [Google Scholar]
- Wang Y, Wang RK. Optimization of image-forming optics for transmission optical projection tomography. Appl Opt. 2007;46:6815–20. doi: 10.1364/ao.46.006815. [DOI] [PubMed] [Google Scholar]


