Abstract
The relation between the respiratory activity of resting honeybees and ambient temperature (Ta) was investigated in the range of 5–40 °C. Bees were kept in a temperature controlled flow through respirometer chamber where their locomotor and endothermic activity, as well as abdominal ventilatory movements was recorded by infrared thermography.
Surprisingly, true resting bees were often weakly endothermic (thorax surface up to 2.8 °C warmer than abdomen) at a Ta of 14–30 °C. Above 33 °C many bees cooled their body via evaporation from their mouthparts. A novel mathematical model allows description of the relationship of resting (standard) metabolic rate and temperature across the entire functional temperature range of bees. In chill coma (<11 °C) bees were ectothermic and CO2 release was mostly continuous. CO2 release rate (nl s−1) decreased from 9.3 at 9.7 °C to 5.4 at 5 °C. At a Ta of >11 °C CO2 was released discontinuously. In the bees’ active temperature range mean CO2 production rate (nl s−1) increased sigmoidally (10.6 at 14.1 °C, 24.1 at 26.5 °C, and 55.2 at 38.1 °C), coming to a halt towards the upper lethal temperature. This was primarily accomplished by an exponential increase in gas exchange frequency (0.54 and 3.1 breaths min−1 at 14.1 and 38.1 °C) but not in released CO2 volume per respiratory cycle (1487 and 1083 nl cycle−1 at 14.1 and 38.1 °C). Emission of CO2 bursts was mostly (98%) accompanied by abdominal ventilation movements even in small CO2 bursts. Larger bursts coincided with a longer duration of active ventilation. An increased amount of CO2 expelled per unit time of ventilation indicates a higher efficiency of ventilation at high ambient temperatures.
Keywords: Honeybee, Respiration, Resting metabolism, Temperature, Respirometry, Thermography
1. Introduction
The energy turnover in insects depends on body temperature, ambient temperature and activity. Honeybees (Apis mellifera L.) which are widespread from tropical to cool temperate regions are heterothermic insects with a distinct ability of endothermy (e.g., Heinrich, 1979; Schmaranzer and Stabentheiner, 1988; Stabentheiner et al., 1995, 2002). The respiration of an insect living under such different ecological conditions and its ability of high energetic performance was subject to various investigations (e.g., Harrison and Hall, 1993; Moffat, 2001; Stabentheiner et al., 2003a; Woods et al., 2005). However, in a summer colony as well as in a winter cluster many bees are at rest. The resting metabolic rate of animals is the baseline of the metabolic power output and important for the comparison with bees during exercise (active metabolic rate). As in other insects the gas exchange of resting honeybees above chill coma temperatures (>10 °C in bees) occurs in discontinuous cycles which are accompanied by abdominal ventilation movements (Lighton and Lovegrove, 1990). The energy turnover of resting bees increases with ambient temperature (Allen, 1959; Rothe and Nachtigall, 1989; Schmolz et al., 2002; Stabentheiner et al., 2003a). We report here how this increase is accomplished, whether there is an increase in respiratory frequency, a higher amount of CO2 release per respiration cycle, or extended ventilation.
In previous reports, rest in bees has been defined as follows: the bees show no visible signs of activity, and they were assumed to be in an ectothermic state (Rothe and Nachtigall, 1989; Stabentheiner et al., 2003a). However, body temperature has rarely been measured simultaneously with gas exchange (Lighton and Lovegrove, 1990) and then only at lower air temperatures. Therefore, we recorded the bees’ body surface temperature without disturbance of the bees by means of infrared thermography in addition to observing their activity.
Since the heat of resting bees contributes considerably to social thermoregulation (Stabentheiner et al., 2003b) it is important to know the resting energy turnover exactly. There have been several reports on the resting metabolism of honeybees (Kosmin et al., 1932; Allen, 1959; Rothe and Nachtigall, 1989; Lighton and Lovegrove, 1990; Goller and Esch, 1991; Fahrenholz et al., 1992; Crailsheim et al., 1999; Stabentheiner et al., 2003a). Though a positive correlation between resting metabolic rate and ambient temperature was obtained in all studies investigating a broader range of ambient temperatures variability in measurements of adult bees (worker age) was considerable (see Table 1 in Rothe and Nachtigall, 1989; Stabentheiner et al., 2003a; Petz et al., 2004). Stabentheiner et al. (2003a) observed that young bees have a lower resting metabolic rate at medium to high ambient temperature than adult bees (Rothe and Nachtigall, 1989; Schmolz et al., 2002). Since it was not clear whether these differences originated from physiological variation or methodical differences a reinvestigation of adult bees’ resting metabolism was necessary.
Mathematical descriptions of the temperature dependence of metabolism either use a simple exponential approach, based on the Arrhenius activation energy (Q10) concept (e.g., Hadley and Hill, 1969; Lighton and Bartholomew, 1988; Lighton, 1989), or polynomial functions (Lighton and Bartholomew, 1988; Vogt and Appel, 1999). Growth and respiration of ectotherms, however, can also be described by sigmoidal (logistic) functions (see Schwerdtfeger, 1977; Petz et al., 2004). Our comprehensive investigation allowed development of this concept, leading to the definition of a mathematical description of resting metabolic rate in the whole range of ambient temperatures which individual honeybees are likely to experience throughout their life.
2. Materials and methods
2.1. Animals and CO2 measurements
Forager honeybees (A. mellifera carnica Pollmann) were caught on an artificial feeding place or at the hive entrance (returning bees with pollen), or bees were picked from a winter cluster and transferred into a flow through respirometer chamber where they were allowed to move freely. Since they stayed overnight in the chamber they were provided with 1.5 M sucrose solution. The brass chamber (outer dimension: 6×10×4 cm; inner dimension: 3×3×2 cm; volume = 18 ml) was immersed in a water bath (Julabo F33) for temperature control to the nearest 0.1 °C. The relative humidity (rH) was maintained at 40–55% above 12 °C, 66% at 10 °C, 78% at 7.5 °C and 93% at 5 °C by saturating the air with water vapour. This was accomplished by passing the air through two flasks with distilled water that was immersed in a water bath prior to the respirometer chamber. The temperature of this water bath was adjusted to the dew point temperature that corresponded to the desired rH at the temperature inside the measurement chamber. The incubation temperature for the bees was varied from 5 to 38 °C in steps of about 2.5 or 5 °C. Because the chamber had a plastic film top window and was not completely submersed the temperature inside the chamber deviated from the temperature of the water bath. Therefore, actual air temperature was calibrated with a thermocouple or a thermistor for each experimental incubation temperature.
Carbon dioxide production of the bees was determined with a differential infrared carbon dioxide gas analyzer (DIRGA) (URAS 14, 0–250 ppm, computer controlled with digital read-out above 12 °C; URAS 4, 0–100 ppm below 12 °C; Hartmann and Braun, ABB), with an accuracy of 0.5 or 0.2 ppm CO2, respectively. In order to maximize the system sensitivity (<0.2 ppm) the air was taken from outside the laboratory. Before it entered the reference tube of the DIRGA, the air was pumped through a 10 l container to dampen fluctuations in CO2 content, passed the pump and mass flow controllers (Brooks 5850 S, automatically switching between 0 and 100 ml min−1 or 0 and 1000 ml min−1; or MKS 1179, 0–200 ml min−1), and then passed another container (5 l) for additional fluctuation and pressure damping. The air was dried by passing it through 2 peltier-driven cool traps (~7.5 °C) before it entered the URAS reference and measurement tubes (where it was heated to 60 °C), respectively. The airflow in the system was set to 150 ml min−1 for temperatures above 12 °C and 80 ml min−1 for temperatures below 12 °C. The volumes (nl) of CO2 production reported in this paper refer to standard (STPS) conditions (0 °C, 101.32 kPa 760 = Torr). The CO2 production was recorded at 1 s intervals. At the beginning and at the end of each experimental run or at least every 3 h in longer lasting experiments, the gas analyzers were calibrated automatically in zero and end point by the use of the internal calibration cuvettes, and the data were corrected for any remaining drift or offset.
2.2. Activity, body temperature and calculation of respiration parameters
The top of the measurement chamber was covered by a plastic film that allowed us to film the bees with an infrared thermography camera (AGA 782 SW or ThermaCam SC2000 NTS; FLIR). The plastic film was transparent in the infrared range from 3 to 13 μm and thus allowed us to record both the activity and the bees’ body surface temperature. The body temperature was calibrated to the nearest 0.7 °C using an infrared emissivity of 0.97 of the honeybee cuticle and a self-constructed peltier driven reference source or an AGA1010 reference radiator of known temperature and emissivity (for details see Stabentheiner and Schmaranzer, 1987; Schmaranzer and Stabentheiner, 1988). Evaluation of infrared data was done with custom-made software for the AGA 782 or with AGEMA Research (FLIR) for the ThermaCam controlled by a custom made Excel macro. Data were stored on videotape with the AGA 782 (25 frames s −1) and digitally (2 or 10 frames s −1) with the ThermaCam. The surface temperatures of head (Thd), thorax (Tth) and abdomen (Tab) were evaluated after the measurements from the tapes or files. The infrared video sequences allowed quantification of even small levels of endothermy of resting bees without behavioural impairment. The thorax temperature excess (Tth–Tab) was used as a measure to judge endothermy.
Our definition of resting was: no or only small visible signs of activity, i.e. only movements of antennae or single legs allowed (according to Crailsheim et al., 1999; Stabentheiner and Crailsheim, 1999; Stabentheiner et al., 2003a). The initial intention was to include only completely ectothermic bees in our analysis. To our surprise, however, this condition was not always applicable (see Fig. 9). For this report, the body temperature measurements showed that we had to include weakly endothermic bees as long as they were quiet, and therefore we defined “rest” in terms of lack of visible activity.
Fig. 9.
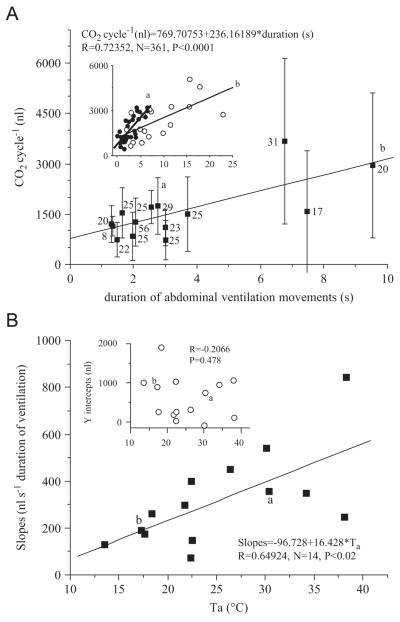
(A) CO2 emission per cycle of resting honeybees as a function of duration of abdominal ventilation movements (means of individual bees with SD). Inset shows samples of the relation in individual bees at 30 °C (a) and 17 °C (b). Numbers indicate N. (B) Slopes (main graph) and y intercepts (inset) of the dependence of CO2 emission per cycle on ventilation duration of individual bees from A in dependence on ambient temperature (Ta). a and b indicate origin of sample curves in A (inset).
For calculation of the respiration parameters the activity of the bees on the infrared video sequences was analysed, and resting phases were divided into 10 min intervals. For these intervals, the mean CO2 production rate (VCO2, MCO2) and the frequency (f) of the respiration cycles were determined. A respiration cycle was defined from the beginning of one burst of CO2 release until the next one. The CO2 release volume for each respiration cycle was calculated by integration of single bursts. Data analysis and statistics were done with custom-made peak-finding formulas, Excel sheets and macros (Microsoft Corporation), and Origin software (OriginLab Corporation). In the figures mean values are given with their standard deviations (SD).
2.3. Abdominal ventilation movements
The duration of abdominal ventilatory pumping movements was measured from infrared sequences recorded at 10 frames s−1 where the abdomen was well visible for a longer resting period. The duration was determined for all detected CO2 bursts (peaks) in this period with exception of those bursts that were accompanied by additional movements of the whole body.
3. Results
3.1. Activity and body temperature
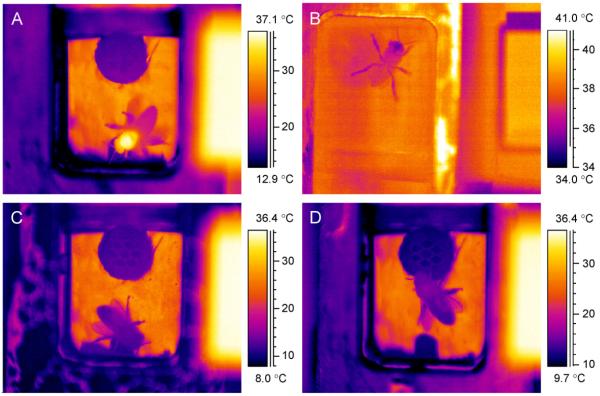
The Fig. 1(A)–(D) show thermograms of bees inside the respirometer chamber in different thermic states. After the transfer of the bees to the chamber they were aroused, active and endothermic (Fig. 1A). The CO2 production was very high during this time. However, after some time they calmed down and stayed more or less motionless while the metabolic rate decreased. There was a great individual and temperature dependent variation in the behaviour. At ambient temperatures below 10 °C the bees soon switched to the ectothermic state and fell into chill coma, with cessation of motoric activity. At temperatures above 35 °C they were very active with only short phases of rest. Since the bees remained in the respirometer chamber overnight, we were able to record sufficient periods of rest to compare resting metabolism with respiratory parameters. The bee in Fig. 1(B) had a cool head which resulted from evaporative cooling with water droplets which could often be observed at ambient temperatures above 35 °C. The wet mouthparts cooled not only the head but to some extent also the thorax, which resulted in partially negative differences between thorax and abdomen (Fig. 2; in contrast to Fig. 1(B) actual body surface temperature measurements were done from the dorsal view).
Fig. 1.
Typical thermograms of bees inside the measurement chamber in different thermic states. (A) Active endothermic bee with a warm thorax (ambient temperature Ta = 14.7 °C); (B)–(D) resting bees: (B) ectothermic bee with cool head and mouthparts (Ta = 38.4 °C), (C) ectothermic bee with all body parts at the same temperature (Ta = 14.7 °C) and (D) weakly endothermic bee with slightly elevated thorax temperature (Ta = 14.6 °C). Rectangles on the right side of thermograms: peltier-driven reference radiator for infrared camera calibration (accuracy: 0.4 °C).
Fig. 2.
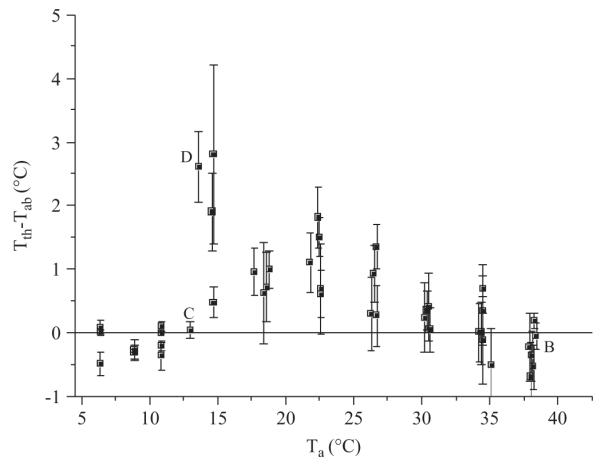
Temperature difference of thorax and abdomen (Tth–Tab) in resting bees at different ambient temperatures (Ta). The letters B–D indicate the origin of the corresponding thermograms in Fig. 1(B)–(D). Shown are the means of 43 bees with their SD (N = 1048 measurements).
It was a surprising result that resting bees were not always ectothermic like the bees in Fig. 1(B), (C). At ambient temperatures between 15 and 30 °C most of them had a more or less elevated thorax temperature (Fig. 1D, 2). Endothermic heat production was highest at 14–15 °C. However, variation of the thoracic temperature excess was also highest at these temperatures. Below 14 °C all bees were ectothermic. The sometimes negative difference between thorax and abdomen resulted from slight temperature gradients within the measurement chamber and the orientation and position of the bees in them, which probably also explains part of the variation at other temperatures. Only bees as seen in Fig. 1(B)–(D) which were resting for longer periods were taken for evaluation of resting metabolism (n = 1048 measurements, 43 bees).
3.2. Respiration
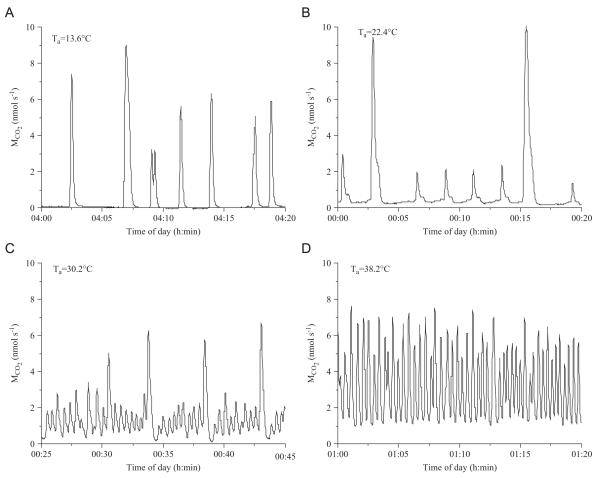
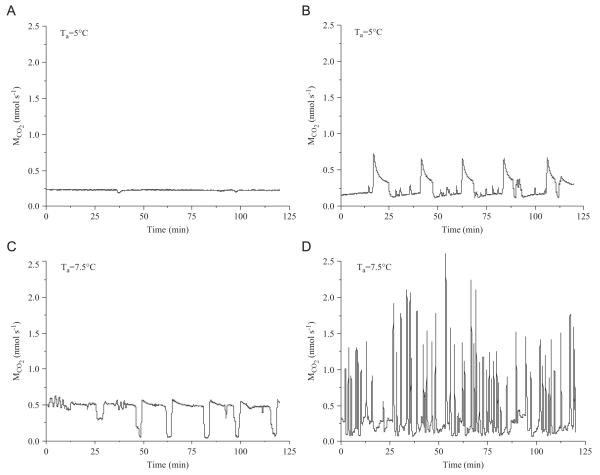
The typical discontinuous gas exchange cycles (DGC) of bees at ambient temperatures (Ta) higher than 12 °C are shown in Fig. 3. At low temperatures the intervals between bursts were long (Fig. 3A). The burst frequency increased with rising temperature. Between 20 and 30 °C we observed both small and large bursts of CO2 release (Fig. 3B, C). Above about 30 °C the respiration patterns became increasingly cyclic, and CO2-release did no longer go back to the baseline (Fig. 3D). However, no distinct flutter phase was detected. Sometimes small “ripples” appeared in the baseline or it increased slightly before the next burst (Fig. 3A, B). At ambient temperatures below 12 °C the bees soon fell into chill coma. The respiration changed from convective discontinuous to diffusive continuous in most cases (Fig. 4A). Only in a few bees and in restricted periods of time were deviations from the continuous form observed (Fig. 4B–D). Then the bees tried to close the otherwise opened spiracles (Fig. 4C) or they opened an additional single spiracle with patterns like a flutter phase between bursts (Fig. 4B). Fig. 4(D) shows a more ‘erratic’ pattern of respiration.
Fig. 3.
Examples of typical CO2-release patterns of resting honeybees measured at different ambient temperatures (Ta).
Fig. 4.
Examples of: (A) continuous CO2-release, typical for honeybees in chill coma, and (B–D) of less frequently observed CO2-release patterns, at ambient temperatures (Ta) <10 °C.
The rate of CO2 production increased steeply with ambient temperature (Fig. 5). At 5 °C it was 5.4±1.48 nl s−1 (0.47 nmol s−1) and reached 55.2±6.61 nl s−1 (2.46 nmol s−1) at 38 °C (for numbers of values and bees see legend of Fig. 5). At about 10–15 and 17–23 °C there were plateaus in the relation between CO2 production and temperature. Below 10 °C the VCO2 pointed towards zero around Ta = 0 °C (Fig. 5). The following function was fitted to the data:
| (1) |
where VCO2 is the CO2 production rate (nl s−1) and T is the temperature ( °C). Part (A) stands for the sigmoid (logistic) part of the function (with constants a–d), whereas part (B) describes the supposed decline of respiration towards the upper lethal temperature (TL = 51.8 °C; Ken et al., 2005), and part (C) describes the probable decline of respiration to nearly zero towards 0 °C (estimated as 0.2 nl s−1 for the fit procedure, small black dot in Fig. 5; with constants f and TX). The range of validity is 0 °C to <TL. The parameters a = 47.7497, b = 0.26935, 0.02268 c = 8.6047, d = 0.26935, f = 0.02268 and TX = −12.4505 are the calculated constants for the whole range of individual honeybee existence (0 °C to the lethal temperature, continuous lines in Fig. 5; R = 0.99889). The inflexion point of the sigmoid part is at 31.87 °C. The maximum VCO2 was extrapolated to be in the range of 44–50 °C. If the curve was only calculated for non-chill coma temperatures (>11 °C) by using only parts (A) and (B) of Eq. (1) (compare Petz et al., 2004) the constants were a = 10.37987, b = 58.12058, c = 6.76962 and d = 0.21051; R = 0.99869), with the inflexion point at 32.19 °C.
Fig. 5.
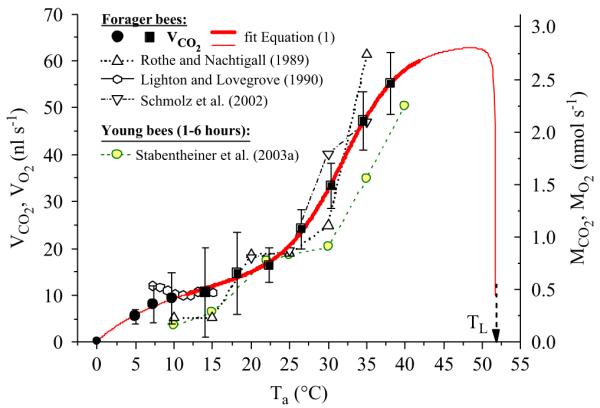
Mean metabolic rate of resting honeybees in dependence on ambient temperature (Ta). Filled circles, winter bees; filled squares, summer bees. Vertical bars indicate SD. Range of validity of fitted Eq. (1) parts (A–C): 0–51.75 °C. Bold line: main range of honeybee activity. TL = upper lethal temperature (51.8 °C; Ken et al., 2005). Number of values (10 min intervals)/bees: 5.0 °C: 757/11, 7.3 °C: 398/12, 9.7 °C: 145/10, 14.1 °C: 166/5, 18.2 °C: 180/5, 22.4 °C: 101/5, 26.5 °C: 167/4, 30.4 °C: 127/4, 34.5 °C: 217/6, 38.1 °C: 177/6. Additional curves of forager bees from (Rothe and Nachtigall (1989), Warburg O2 manometry); (Lighton and Lovegrove (1990), flow through CO2 respirometry) and (Schmolz et al. (2002), calorimetry), and of young bees from (Stabentheiner et al. (2003a), Warburg O2 manometry).
For comparison of our data with CO2 production, O2 consumption or heat production from adult and young bees data from (Rothe and Nachtigall (1989), Warburg O2 respirometry), (Lighton and Lovegrove (1990), flow through CO2 respirometry), (Schmolz et al. (2002), calorimetry) and (Stabentheiner et al. (2003a), Warburg O2 respirometry) are also included in Fig. 5.
The CO2-release frequency (cycles min−1) increased steeply with ambient temperature, from 0.5±0.36 cycles min−1 at 14.1 °C to 3.1±0.61 cycles min−1 at 38 °C (Fig. 6). The correlation between cycle frequency and temperature can be described by a simple exponential function like f (min−1) = 0:18803 * 1:07437Ta (R = 0.8432, N = 1130). With Eq. (1) the decline of the respiratory frequency to zero towards the chill coma temperature can also be described, with the parameters a = 0.56356, b = 550713.07, c = 15.55597, d = 0.08701, f = 1 = const., TL = 51.8 = const. and TX = 6.24527 (calculated through means with frequency = 0 at Ta = 10 °C; R = 0.98427, N = 8). Both methods delivered similar results in the range of Ta = 13–38 °C (Fig. 6). By contrast, foraging water collectors, which are intensely endothermic (Schmaranzer, 2000), breathe at a much higher frequency of 148±14.1 min−1 (2.47±0.23 Hz; 15 bees; Ta = 17.5 °C, relative humidity = 43.8%, global radiation = 65W m−2).
Fig. 6.
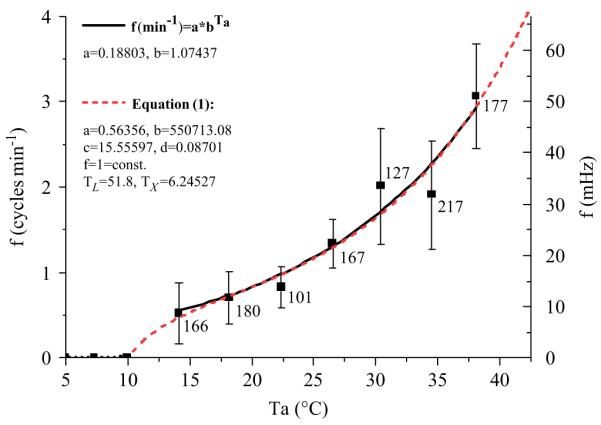
CO2-release frequency of resting honeybees as a function of ambient temperature (Ta). Curves: fits with a simple exponential function or Eq. (1) without ‘ln’ in part (C). Below 14 °C respiration changed from discontinuous to continuous. Vertical bars indicate SD. Numbers indicate evaluated 10 min intervals.
Because of continuous carbon dioxide release at ambient temperatures below 12 °C no values could be determined there and therefore a dotted line shows the estimated course of the frequency curve in this range (Fig. 6). Between frequency and CO2 turnover there was a linear correlation: f (min−1) = 0:19471 + 0:04408 × VCO2 (nl s−1) (R = 0.79965, N = 1130, P<0.0001). The amount of CO2 released per cycle decreased slightly with ambient temperature from 1484.4±1690.1 nl at 14 °C to 976.8±705.8 nl at 30 °C (Fig. 7). The correlation explains only 0.3% of the total variation. There was, however, a significant decrease in variability (SD) with increasing ambient temperature (R = −0.94201, N = 7, P<0.002). Below 12 °C the animals’ respiratory behaviour changed from discontinuous convective to continuous diffusive CO2 release, and therefore no amount of CO2 per cycle could be determined.
Fig. 7.
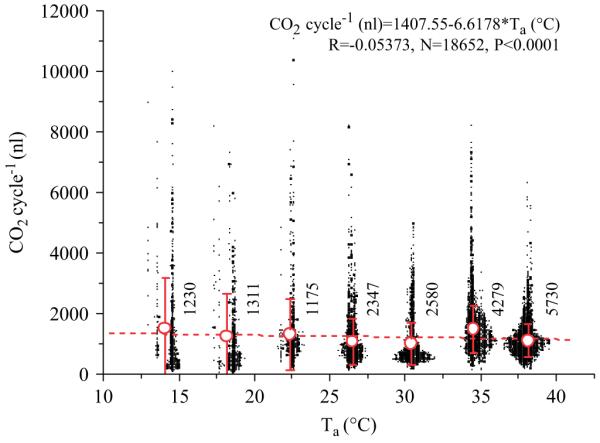
CO2 released per cycle in resting honeybees (black symbols, overlapping values shifted horizontally) at different ambient temperatures (Ta). Circles indicate mean with SD, numbers indicate cycles.
3.3. Abdominal ventilation movements
The infrared video sequences revealed long and short pulsations of the abdomen that coincided with the CO2 release, indicating a ventilation driven convective CO2 exchange. The longer lasting abdominal ventilation movements were composed of sequences with a series of short movements. In 98% of all CO2 bursts, large and small ones (see Fig. 3), the typical movements of the abdomen could be observed. The average duration was in a small range (1.3–3.7 s) except in three bees at about 18 °C with higher values (6.8, 7.5, 9.5 s; Fig. 8). The duration of the pulsations correlated negatively with ambient temperature (R = −0.3381, N = 361, P<0.0001). However, this was caused by the three bees at about 18 °C with a huge variation. Above 20 °C the correlation was much weaker (Fig. 8). The CO2 release per cycle correlated positively with the duration both throughout all experiments (Fig. 9A), and in all individual bees (R = 0.43566–0.91934, N = 17–56 cycles, 13 bees, P<0.05–<0.0001) but one where variation of duration was too low (R = 0.08544, N = 8, P = 0.8407). The dependence of CO2 emission per cycle on duration of individual bees (slope of the regression lines) was steeper at higher temperatures (inset in Fig. 9A, B). The y-intercepts of the individual bees’ regressions were not temperature dependent (R = −0.2066, P = 0.4785; inset in Fig. 9B).
Fig. 8.
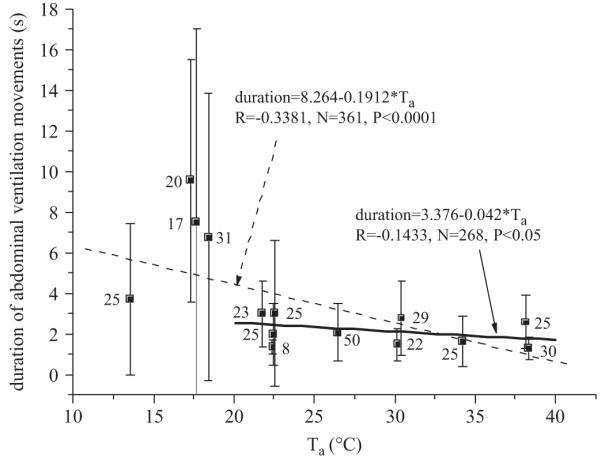
Duration of abdominal ventilation movements of individual resting honeybees (means with SD) as a function of ambient temperature (Ta). Numbers indicate N.
4. Discussion
4.1. Activity and body temperature
The body temperature and not the ambient temperature is the decisive parameter for the energy turnover (and metabolism) of resting ectothermic animals. A premise for our calculation of resting (standard) metabolism had been that only ectothermic bees should be taken. However, because there were only few really ectothermic bees in a temperature range between 14 and 30 °C, we had to include slightly endothermic bees in our analysis which was probably similar in the other studies quoted in Fig. 5 except in Lighton and Lovegrove (1990) and Stabentheiner et al. (2003a). Slight endothermy seems to be a common phenomenon in resting and idle honeybees. Even on exposed surfaces of winter clusters at least 8% of bees are weakly endothermic though any heat produced under these conditions is immediately lost to the surrounding air (Stabentheiner et al., 2003b). At ambient temperatures above 34 °C several bees showed efforts to cool their body by regurgitated fluid droplets on their mouthparts to prevent their body from overheating (Figs. 1B and 2). Interestingly, similar observations were made in a small parasitic wasp (Pimpla turionellae, Ichneumonidae; Kroder et al., 2007). Idling animals exhibited increasing endothermy (up to 1.2 °C on average) when ambient temperature decreased from 18 to 10 °C. At higher temperatures (up to 30 °C) Pimpla switched to evaporative cooling with the mouthparts like the bees. This was in contrast to the thoracic temperature excess during vibrational host location (0.2–0.4 °C) that was not temperature dependent.
4.2. Metabolic rate and temperature
We could confirm the results of other authors (Allen, 1959; Rothe and Nachtigall, 1989; Schmolz et al., 2002; Stabentheiner et al., 2003a) that the resting metabolic rate increases steeply with ambient temperature (Fig. 5). The values of Schmolz et al. (2002) for adult bees resemble ours quite well (20–35 °C; Fig. 5). The data of Rothe and Nachtigall (1989) are below ours in the lower temperature range (10–15 °C) and above ours at 35 °C. These differences may in part have been caused by differences in the calculation method of mean respiration. They only averaged values up to five-fold of the observed minimum. Our measurements are well comparable with those of Lighton and Lovegrove (1990) at 15–10 °C (Fig. 5). Below 10 °C our measurements on winter bees were lower than their measurements on summer bees. It remains to be investigated in detail whether winter and summer bees differ in their resting metabolism. In young bees (1–7 h after emergence) which are not yet capable of endothermy (Vollmann et al., 2004) Stabentheiner et al. (2003a) observed mostly a lower resting metabolism than we did in adult bees (Fig. 5). As our adult bees were weakly endothermic in the range of 14–30 °C (Fig. 2) a good comparison is only possible at 10 °C and above 30 °C. An explanation for the lower metabolism of the young bees may be that their flight muscles and enzymatic systems are not yet completely developed (Sakagami and Maruyama, 1956; Herold and Borei, 1963; Herold, 1965; Hersch et al., 1978; Moritz, 1988).
Eq. (1) enables calculation of the resting (standard) metabolism by one single function in close agreement with experimental data, in the whole range of local ambient temperatures honeybees usually experience in their life (Fig. 5). The amount of CO2 release per time unit does not increase exponentially as is known from the enzymatic level but in a sigmoidal (logistic) shape above 12 °C (according to part (A) of Eq. (1)). This sigmoidal shape, which is also present in honeybee larvae (Petz et al., 2004), is also typical for the effect of temperature on growth in ectothermic animals (Schwerdtfeger, 1977). On the combs of breeding honeybee summer colonies the body temperature of most bees is above the inflexion point of 31.87 °C of this curve (Mandl, 2005). This way the metabolism even of resting bees is high, and contributes considerably to colonial heat production. In a broodless winter cluster, by contrast, many bees are cooler than the inflexion temperature (Stabentheiner et al., 2003b), and this way heat production is reduced to a minimum. The sigmoidal flattening of the standard metabolic curve at high temperatures (Fig. 5) was observed similarly at the mitochondrial level, with increasing inactivation at temperatures above 41 °C, and a maximum beyond 50 °C (Leonhard and Crailsheim, 1999).
However, our measurements and literature data show deviations from the course of a sigmoidal curve. The ‘plateau’ observed in the range of 17–27 °C was also reported by other investigators (Fig. 5), and in other species, e.g., in ants by Lighton and Bartholomew (1988) and Lighton (1989), and in scorpions by Hadley and Hill (1969). This plateau was smallest in our measurements. Its meaning remains to be enlightened. With the extension part (B) of Eq. (1) and the upper lethal temperature of honeybees (51.8 °C; Ken et al., 2005) we calculated that metabolism very quickly grinds to a halt at ambient temperatures above 50 °C. The maximum of CO2 emission is estimated to occur between 45 °C and 50 °C. This is also the upper limit of body temperature observed in honeybees under natural conditions (Cooper et al., 1985; Stabentheiner et al., 2002, 2007). However, we are not sure that resting phases exist at all above about 43 °C, because towards the upper end of our experimental temperature range the bees became generally more active with shorter phases of rest. Below 10 °C, where respiration fails, the sigmoidal part (A) of Eq. (1) is also no longer valid and the addition of part (C) is needed to describe the decrease of experimental data (Fig. 5). Modifications of the denominators of parts (B) and (C) allow adaptation to experimental data at the low and high end of the range of validity. The denominator T–TX (or T–TL), for example, describes a sharp decline towards a liminal temperature, while f*(T–TX) produces a smoother decrease (Fig. 6). An even smoother decline may be fitted by using f*ln (T–TX). This approach (or variants of it) should be tested for its general usability to describe nonlinear whole-animal thermal relations in insect physiological studies.
4.3. Respiratory patterns
The bees showed the typical rhythmic patterns of DGC as found in many other resting insects (e.g., Lighton and Lovegrove, 1990; Hadley, 1994; Lighton, 1994, 1996; Beekman and Stratum, 1999; Sláma, 1999; Vogt and Appel, 1999, 2000; Chown and Davis, 2003; Hetz and Bradley, 2005). At 14 °C we measured a similar respiration frequency (8.8 mHz) than Lighton and Lovegrove (1990) (7.8 mHz) in the range of 12–15 °C. Analysis of the respiratory patterns revealed that the increased oxygen demand according to the sigmoid (logistic) increase of the resting metabolic rate above 12 °C (Fig. 5) was met by an exponential increase of the gas exchange frequency (Fig. 6) like in fire ants (Solenopsis invicta, Formicidae; Vogt and Appel, 2000). In bees, however, even the highest resting gas exchange frequency is far from the maximum. In endothermic water foragers, for example, we determined an abdominal pumping frequency of 2–3 Hz, compared to a resting level of about 8–51 mHz, to meet the needs of their high metabolic turnover (see e.g., Harrison and Hall, 1993; Moffatt, 2001; Stabentheiner et al., 2003a; Woods et al., 2005). In contrast to the respiration frequency the amount of gas exchanged per cycle by resting bees is not altered much with increasing temperature (Fig. 7). This is in good agreement with Klok and Chown (2005). Schneiderman and Williams (1955) discussed the trigger for the opening period to be the accumulation of a certain amount of carbon dioxide during the interburst period. As a consequence, the burst frequency has to increase at higher turnover rates (Schneiderman, 1960).
In insects the size of a honeybee, active ventilation, which accompanies the open period of a respiratory cycle (Lighton and Lovegrove, 1990; Wasserthal, 1996), may be necessary for a sufficient gas exchange (Hadley, 1994). In the tok-tok beetle, Psammodes striatus (Tenebrionidae), the volume of expelled CO2 correlates positively with the number of abdominal ventilatory pulsations (Lighton, 1988). We found a good correlation between the total duration of ventilatory abdominal movements and the amount of emitted CO2 (Fig. 9). However, bees do not extend but reduce the duration of ventilation in order to eliminate the CO2 accumulating faster at higher ambient temperatures (Fig. 8). One reason that makes this possible may be that at higher temperatures they are able to emit more CO2 per time unit of ventilation (Fig. 9), which indicates that ventilation is more effective. The higher efficiency of ventilation may be caused by a faster liberation of CO2 from the buffers in the tissues and body fluids (conversion of to CO2), the lower CO2 solubility, the higher speed of CO2 diffusion, and a better performance of abdominal ventilatory muscles. However, the increase in ventilatory efficiency is only in part reflected in a reduction of ventilatory duration. While the amount of expelled CO2 per time unit increased by a factor of 2.42 between 18 and 38 °C (Fig. 9B) the duration of ventilation decreased only by a factor of 0.67 (0.41 expected; Fig. 8). To clarify this question the ventilation volume (‘intensity’ of abdominal pumping movements), and the temporal coincidence of ventilation and duration of spiracle opening would have to be investigated.
Schneiderman (1960) argued from observations in diapausing pupae that the discontinuity of respiratory gas exchange should become more pronounced with falling metabolic rate or falling temperature (see also Schneiderman and Williams, 1955). In honeybees this is the case only down to 12 °C (Fig. 3). Below 12 °C they change from discontinuous convective to continuous diffusive respiration (Lighton and Lovegrove, 1990; Figs. 4(A) and 6). We suggest that respiration does not switch but breaks down because of low body temperature. At these low temperatures resting honeybees are truly ectothermic (Fig. 2). If their body temperature falls below 11 °C they fall into chill coma (Free and Spencer-Booth, 1960), and part (C) of Eq. (1) is needed to describe the decline of the metabolic rate (Fig. 5). For proper flight muscle performance a thorax temperature of more than 11 °C is necessary (Esch, 1988; Goller and Esch, 1991; Hosler et al., 2000). Hosler et al. (2000) suggested the failure of membrane pumps (Na+/K+) that maintain a proper resting potential to be responsible for muscular inexcitability in chill coma. We suggest that proper control of spiracular function and active abdominal ventilation movements also underlie these physiological constraints. The rather rare examples where some discontinuity had remained below 11 °C pronounce the troubles the bees had with spiracular control (Fig. 4B–D), which was reversible after acquisition of heat from the environment (see also Esch, 1988; Hetz et al., 1999). We do not know of reports whether the same would have to be suggested for the neural control of respiration.
From the 10 pairs of spiracles in honeybees the first pair on the thorax works with a closing muscle, the second pair (thorax) has no muscles at all, whereas the last 8 pairs (1 on the thorax and 7 on the abdomen) work with the supply of an active closing and opening muscle each (Snodgrass, 1984). If the closing muscles are not able to maintain a minimum tension to keep the spiracles closed (Fig. 4), the tracheal system could be flushed with air leading to an exceptionally high oxygen partial pressure at a low oxygen demand which in turn could lead to oxygen poisoning effects. Hetz and Bradley (2005) have argued that the cyclic spiracular closing prevents the tracheae from high oxygen concentrations. A continuous gas exchange may also lead to a higher water loss from the tracheal system (Chown et al., 2006). It seems not to be a limitation of oxygen delivery which leads to the collapse of respiration in chill coma (<11 °C), as had been suggested as a principal mechanism leading to lower and upper critical thermal limits in aquatic animals (Pörtner, 2001). Experiments by Sinclair et al. (2004) strongly suggest that the efficient oxygen delivery via a tracheal system makes oxygen limitation of thermal tolerance, at a whole organism level, unlikely in insects. In the honeybee, the sudden breakdown of muscular function between 11 and 10 °C (Esch, 1988; Hosler et al., 2000) make oxygen delivery limitations additionally improbable as the source of the respiratory collapse.
Because of differences in chill coma temperature the lower temperature limit of active respiration differs between species. In contrast to honeybees, strongly endothermic Eupsilia devia winter moths (Cuculiinae, Noctuidae), for instance, may keep the flight muscles working at least in part down to muscle temperatures of 1 °C (Esch, 1988). Ectothermic Operophthera moths (Geometridae) are able to fly with muscle temperatures as low as −3 °C (Heinrich and Mommsen, 1985), which implies that respiration still works.
Considerable intra- and inter-individual variation in the respiration patterns was observed. Between 20 and 30 °C small and large peaks of CO2 release alternated (Fig. 3). The same was observed by Beekman and Stratum (1999) for pre-diapause queens of the bumblebee Bombus terrestris (Apidae) measured at an ambient temperature of 18 °C. The post-diapause queens showed no small peaks but a more frequent occurrence of large peaks. Chown (2001) illustrated variations in the gas exchange patterns in several species of South-African beetles. In resting cockroaches (Perisphaeria sp., Blaberidae) Marais and Chown (2003) also found three very different patterns of gas exchange at the same ambient temperature (20 °C). The variation of these patterns may thus be more common than previously thought.
A typical discontinuous respiratory cycle of insects consists of three parts. During the open phase CO2 is emitted, followed by a closed phase during which the spiracles are tightly closed and CO2 is enriched in the body. In the following flutter phase during which the spiracles will partly open or close in rapid succession the CO2 is released in short, small pulses (e.g., Lighton, 1994; Hetz and Bradley, 2005). The small bursts in honeybees (Fig. 3C) which differed between bees and temperatures, however, do not represent a flutter phase because they were always accompanied by active ventilation. A true flutter phase was not unambiguously visible in our measurements even at long interburst intervals (Fig. 3A, B), which coincides with the finding of Lighton and Lovegrove (1990). We suggest that the strongly reduced or even absent flutter phase of bees is a direct result of their high basic metabolic rate (397 nmol g −1 min−1 at 15 °C). The metabolic rate in pupae of Attacus atlas (Saturniidae), which show a pronounced flutter phase (Hetz and Bradley, 2005), is about 36 times lower (about 11 nmol g−1 min−1 at 15 °C, range 8–22). The tok-tok beetle (P. striatus; Lighton, 1988), which occasionally shows a flutter phase, has an intermediate metabolism (119 nmol g−1 min−1 at 20 °C, compared to 516 nmol g−1 min−1 in honeybees). Concerning the gas exchange frequency, the honeybee is not easily comparable with low-turnover insects like Attacus pupae. If one just counts the open phase CO2 release, bees show an at least 60 times higher frequency (36 h−1 at 15 °C) than Attacus pupae (0.55 h−1 at 15 °C) at an about 36 times higher resting metabolism. The many small peaks in the flutter phase of Attacus pupae cannot be included in this comparison easily. As honeybee metabolism increases with temperature, CO2 accumulates so fast in the animals that the next breath is released before the CO2 concentration in the respirometer chamber can reach the baseline. The result of this technical limitation of flow through respirometry (Gray and Bradley, 2006) is that gas exchange patterns then show a transition from discontinuous to cyclic (Fig. 3D).
Acknowledgements
Supported by the Austrian Fonds zur Förderung der Wissenschaftlichen Forschung (FWF, P16584), and the Austrian Bundesministerium für Land- und Forstwirtschaft, Umwelt und Wasserwirtschaft. We greatly appreciate the help with electronics and software by G. Stabentheiner, with data acquisition by A. Wobschall, and with data evaluation by M. Maderbacher, M. Mandl and B. Maurer.
References
- Allen MD. Respiration rates of worker honeybees of different ages and at different temperatures. Journal of Experimental Biology. 1959;36:92–101. [Google Scholar]
- Beekman M, van Stratum P. Respiration in bumblebee queens: effect of life phase on the discontinuous ventilation cycle. Entomologia Experimantalis et Applicata. 1999;92:295–298. [Google Scholar]
- Chown SL. Physiological variation in insects: hierarchical levels and implications. Journal of Insect Physiology. 2001;47:649–660. doi: 10.1016/s0022-1910(00)00163-3. [DOI] [PubMed] [Google Scholar]
- Chown SL, Davis ALV. Discontinuous gas exchange and the significance of respiratory water loss in scarabaeine beetles. Journal of Experimental Biology. 2003;206:3547–3556. doi: 10.1242/jeb.00603. [DOI] [PubMed] [Google Scholar]
- Chown SL, Gibbs AG, Hetz SK, Klok CJ, Lighton JRB, Marais E. Discontinuous gas exchange in insects: a clarification of hypotheses and approaches. Physiological and Biochemical Zoology. 2006;79:333–343. doi: 10.1086/499992. [DOI] [PubMed] [Google Scholar]
- Cooper PD, Schaffer WM, Buchmann SL. Temperature regulation of honey bees (Apis mellifera) foraging in the Sonoran desert. Journal of Experimental Biology. 1985;114:1–15. [Google Scholar]
- Crailsheim K, Stabentheiner A, Hrassnigg N, Leonhard B. Oxygen consumption at different activity levels and ambient temperatures in isolated honeybees (Hymenoptera: Apidae) Entomologia Generalis. 1999;24:1–12. [Google Scholar]
- Esch H. The effects of temperature on flight muscle potentials in honeybees and cuculiinid winter moths. Journal of Experimental Biology. 1988;135:109–117. [Google Scholar]
- Fahrenholz L, Lamprecht I, Schricker B. Calorimetric investigations of different castes of honey bees, Apis mellifera carnica. Journal of Comparative Physiology B. 1992;162:119–130. [Google Scholar]
- Free JB, Spencer-Booth Y. Chill-coma and cold death temperatures of Apis mellifera. Entomologia Experimentalis et Applicata. 1960;3:222–230. [Google Scholar]
- Goller F, Esch H. Oxygen consumption and flight muscle activity during heating in workers and drones of Apis mellifera. Journal of Comparative Physiology B. 1991;161:61–67. [Google Scholar]
- Gray EM, Bradley TJ. Evidence from mosquitoes suggests that cyclic gas exchange and discontinuous gas exchange are two manifestations of a single respiratory pattern. Journal of Experimental Biology. 2006;209:1603–1611. doi: 10.1242/jeb.02181. [DOI] [PubMed] [Google Scholar]
- Hadley NF. Water Relations of Terrestrial Arthropods. Academic Press; San Diego, CA: 1994. [Google Scholar]
- Hadley NF, Hill RD. Oxygen consumption of the scorpion Centruroides sculpturatus. Comparative Biochemistry and Physiology. 1969;29:217–226. [Google Scholar]
- Harrison JF, Hall HG. African-European honeybee hybrids have low intermediate metabolic capacities. Nature. 1993;363:258–260. [Google Scholar]
- Heinrich B. Thermoregulation of African and European honeybees during foraging, attack, and hive exits and returns. Journal of Experimental Biology. 1979;80:217–229. [Google Scholar]
- Heinrich B, Mommsen TP. Flight of winter moths near 0 °C. Science. 1985;228:177–179. doi: 10.1126/science.228.4696.177. [DOI] [PubMed] [Google Scholar]
- Herold RC. Development and ultrastructural changes of sarcosomes during honey bee flight muscle development. Developmental Biology. 1965;12:269–286. doi: 10.1016/0012-1606(65)90031-x. [DOI] [PubMed] [Google Scholar]
- Herold RC, Borei H. Cytochrome changes during honeybee flight muscle development. Developmental Biology. 1963;8:67–79. doi: 10.1016/0012-1606(63)90026-5. [DOI] [PubMed] [Google Scholar]
- Hersch MI, Crewe RM, Hepburn HR, Thompson P, Savage N. Sequential development of glycolytic competence in the muscles of worker honeybees. Comparative Biochemistry and Physiology. 1978;61B:427–431. [Google Scholar]
- Hetz SK, Bradley TJ. Insects breathe discontinuously to avoid oxygen toxicity. Nature. 2005;433:516–519. doi: 10.1038/nature03106. [DOI] [PubMed] [Google Scholar]
- Hetz SK, Stabentheiner A, Wobschall A, Crailsheim K. Zoology 102-Supplement 1*** (DZG 91.1) 1999. Honeybees in chill coma; p. 65. [Google Scholar]
- Hosler JS, Burns JE, Esch HE. Flight muscle resting potential and species-specific differences in chill-coma. Journal of Insect Physiology. 2000;46:621–627. doi: 10.1016/s0022-1910(99)00148-1. [DOI] [PubMed] [Google Scholar]
- Ken T, Hepburn HR, Radloff SE, Yusheng Y, Yiqiu L, Danyin Z, Neumann P. Heat-balling wasps by honeybees. Naturwissenschaften. 2005;92:492–495. doi: 10.1007/s00114-005-0026-5. [DOI] [PubMed] [Google Scholar]
- Klok CJ, Chown SL. Temperature- and body mass-related variation in cyclic gas exchange characteristics and metabolic rate of seven weevil species: Broader implications. Journal of Insect Physiology. 2005;51:789–801. doi: 10.1016/j.jinsphys.2005.03.007. [DOI] [PubMed] [Google Scholar]
- Kosmin NP, Alpatov WW, Resnitschenko MS. Zur Kenntnis des Gaswechsels und des Energieverbrauches der Biene in Beziehung zu deren Aktivität. Zeitschrift für vergleichende Physiologie. 1932;17:408–422. [Google Scholar]
- Kroder S, Samietz J, Stabentheiner A, Dorn S. Body temperature of the parasitic wasp Pimpla turionellae (Hymenoptera) during host location by vibrational sounding. Physiological Entomology. 2007 doi: 10.1111/j.1365-3032.2007.00595.x. in press. [DOI] [PMC free article] [PubMed] [Google Scholar]
- Leonhard B, Crailsheim K. Temperature dependency of the oxygen consumption by a thorax homogenate of worker honeybees (Hymenoptera: Apidae) Entomologia Generalis. 1999;24:31–36. [Google Scholar]
- Lighton JRB. Simultaneous measurements of oxygen uptake and carbon dioxide emission during the discontinuous ventilation in the tok-tok beetle, Psammodes striatus. Journal of Insect Physiology. 1988;34:361–367. [Google Scholar]
- Lighton JRB. Individual and whole-colony respiration in an African formicine ant. Functional Ecology. 1989;3:523–530. [Google Scholar]
- Lighton JRB. Discontinuous ventilation in terrrestrial insects. Physiological Zoology. 1994;67:142–162. [Google Scholar]
- Lighton JRB. Discontinuous gas exchange in insects. Annual Review of Entomology. 1996;41:309–324. doi: 10.1146/annurev.en.41.010196.001521. [DOI] [PubMed] [Google Scholar]
- Lighton JRB, Bartholomew GA. Standard energy metabolism of a desert harvester ant, Pogonomyrmex rugosus: effects of temperature, body mass, group size, and humidity. Proceedings of the National Academy of Science. 1988;85:4765–4769. doi: 10.1073/pnas.85.13.4765. [DOI] [PMC free article] [PubMed] [Google Scholar]
- Lighton JRB, Lovegrove BG. A temperature-induced switch from diffusive to convective ventilation in the honeybee. Journal of Experimental Biology. 1990;154:509–516. [Google Scholar]
- Mandl M. Diploma Thesis. Karl-Franzens-Universität Graz; Austria: 2005. Thermoregulation im brütenden Bienenvolk. [Google Scholar]
- Marais E, Chown SL. Repeatability of standard metabolic rate and gas exchange characteristics in a highly variable cockroach, Perishaeria sp. Journal of Experimental Biology. 2003;206:4565–4574. doi: 10.1242/jeb.00700. [DOI] [PubMed] [Google Scholar]
- Moffatt L. Metabolic rate and thermal stability during honeybee foraging at different reward rates. Journal of Experimental Biology. 2001;204:759–766. doi: 10.1242/jeb.204.4.759. [DOI] [PubMed] [Google Scholar]
- Moritz RFA. Biochemical changes during honey bee flight muscle development. Biona-Report. 1988;6:51–64. [Google Scholar]
- Petz M, Stabentheiner A, Crailsheim K. Respiration of individual honeybee larvae in relation to age and ambient temperature. Journal of Comparative Physiology B. 2004;174:511–518. doi: 10.1007/s00360-004-0439-z. [DOI] [PubMed] [Google Scholar]
- Pörtner HO. Climate change and temperature-dependent biogeography: oxygen limitation of thermal tolerance in animals. Naturwissenschaften. 2001;88:137–146. doi: 10.1007/s001140100216. [DOI] [PubMed] [Google Scholar]
- Rothe U, Nachtigall W. Flight of the honeybee, IV. Respiratory quotients and metabolic rates during sitting, walking and flying. Journal of Comparative Physiology B. 1989;158:739–749. [Google Scholar]
- Sakagami SF, Maruyama K. Aktivitätsänderungen der Adenosintriposphatase im Flügelmuskel der Bienenarbeiterinnen während ihres ersten Imaginallebens. Zeitschrift für vergleichende Physiologie. 1956;39:21–24. [Google Scholar]
- Schmaranzer S. Thermoregulation of water collecting honey bees (Apis mellifera) Journal of Insect Physiology. 2000;46:1187–1194. doi: 10.1016/s0022-1910(00)00039-1. [DOI] [PubMed] [Google Scholar]
- Schmaranzer S, Stabentheiner A. Variability of the thermal behavior of honeybees on a feeding place. Journal of Comparative Physiology B. 1988;158:135–141. [Google Scholar]
- Schmolz E, Hoffmeister D, Lamprecht I. Calorimetric investigations on metabolic rates and thermoregulation of sleeping honeybees (Apis mellifera carnica) Thermochimica Acta. 2002;382:221–227. [Google Scholar]
- Schneiderman HA. Discontinuous respiration in insects-role of the spiracles. Biological Bulletin. 1960;119:494–528. [Google Scholar]
- Schneiderman HA, Williams CM. An experimental analysis of the discontinuous respiration of the Cecropia Silkworm. Biological Bulletin. 1955;109:123–143. [Google Scholar]
- Schwerdtfeger F. Autökologie-Die Beziehungen zwischen Tier und Umwelt. Paul Parey; Hamburg, Berlin: 1977. [Google Scholar]
- Sinclair BJ, Klok CJ, Chown SL. Metabolism of the sub-Antarctic caterpillar Pringleophaga marioni during cooling, freezing and thawing. Journal of Experimental Biology. 2004;207:1287–1294. doi: 10.1242/jeb.00880. [DOI] [PubMed] [Google Scholar]
- Sláma K. Active regulation of insect respiration. Annals of the Entomological Society of America. 1999;92:916–929. [Google Scholar]
- Snodgrass RE. Anatomy of the honey bee. Cornell University Press Ltd.; London: 1984. [Google Scholar]
- Stabentheiner A, Crailsheim K. The effect of activity level and ambient temperature on thermoregulation in isolated honeybees (Hymenoptera: Apidae) Entomologia Generalis. 1999;24:13–21. [Google Scholar]
- Stabentheiner A, Schmaranzer S. Thermographic determination of body temperatures in honey bees and hornets: calibration and applications. Thermology. 1987;2:563–572. [Google Scholar]
- Stabentheiner A, Kovac H, Hagmüller K. Thermal behavior of round and wagtail dancing honeybees. Journal of Comparative Physiology B. 1995;165:433–444. [Google Scholar]
- Stabentheiner A, Kovac H, Schmaranzer S. Honeybee nestmate recognition: the thermal behaviour of guards and their examinees. Journal of Experimental Biology. 2002;205:2637–2642. doi: 10.1242/jeb.205.17.2637. [DOI] [PubMed] [Google Scholar]
- Stabentheiner A, Kovac H, Schmaranzer S. Thermal behaviour of honeybees during aggressive interactions. Ethology. 2007;113 doi: 10.1111/j.1439-0310.2007.01403.x. in press, doi:10.1111/j.1439-0310.2007.01403.x. [DOI] [PMC free article] [PubMed] [Google Scholar]
- Stabentheiner A, Vollmann J, Kovac H, Crailsheim K. Oxygen consumption and body temperature of active and resting honeybees. Journal of Insect Physiology. 2003a;49:881–889. doi: 10.1016/S0022-1910(03)00148-3. [DOI] [PubMed] [Google Scholar]
- Stabentheiner A, Pressl H, Papst Th., Hrassnigg N, Crailsheim K. Endothermic heat production in honeybee winter clusters. Journal of Experimental Biology. 2003b;206:353–358. doi: 10.1242/jeb.00082. [DOI] [PubMed] [Google Scholar]
- Vogt JT, Appel AG. Standard metabolic rate of the fire ant, Solenopsis invicta Buren: effects of temperature, mass, and caste. Journal of Insect Physiology. 1999;45:655–666. doi: 10.1016/s0022-1910(99)00036-0. [DOI] [PubMed] [Google Scholar]
- Vogt JT, Appel AG. Discontinuous gas exchange in the fire ant, Solenopsos invicta Buren: caste differences and temperature effects. Journal of Insect Physiology. 2000;46:403–416. doi: 10.1016/s0022-1910(99)00123-7. [DOI] [PubMed] [Google Scholar]
- Vollmann J, Stabentheiner A, Kovac H. Die Entwicklung der Endothermie bei Honigbienen (Apis mellifera carnica Pollm.) Mitteilungen der deutschen Gesellschaft für allgemeine und angewandte Entomologie. 2004;14:467–470. [Google Scholar]
- Wasserthal LT. Interaction of circulation and tracheal ventilation in holometabolus insects. Advances in Insect Physiology. 1996;26:298–351. [Google Scholar]
- Woods WA, Heinrich B, Stevenson RD. Honeybee flight metabolic rate: does it depend upon air temperature? Journal of Experimental Biology. 2005;208:1161–1173. doi: 10.1242/jeb.01510. [DOI] [PubMed] [Google Scholar]


