

Abstract
Molecular dynamics simulations that combine many μs trajectories have recently predicted that a very fast-folding protein like lambda repressor fragment λ6–85 D14A could have a millisecond kinetic phase. We investigated this possibility by detecting temperature jump relaxation to 5 ms. While λ6–85 D14A has no significant slow phase, two even more stable mutants do. A slow phase of λ6–85 D14A does appear in mild denaturant. The experimental data and computational modeling together suggest the following hypothesis: λ6–85 takes only microseconds to reach its native state from an extensively unfolded state, while the latter takes milliseconds to reach compact beta-rich traps. λ6–85 is not only thermodynamically, but also kinetically protected from reaching such “intramolecular amyloids” while folding.
Small proteins have become important benchmarks for folding theory1 and simulation.2 Single- and multi-trajectory simulations now make easily testable predictions about folding rates and stabilities.2–4 Lambda repressor fragments, originally a paradigm for stability measurements5 and later adapted for NMR and T-jump kinetics, 6,7 have become the largest `small' platforms for computational studies:2,8 80 amino acids in 5 helices for λ6–85 fragment. Experimentally, slower-folding mutants are assigned as apparent two-state folders,6,9 whereas sub-20 μs mutants are assigned as downhill or incipient downhill folders.7,10 The latter assignment is based on the 2 μs `molecular phase' observed only when the native state is stabilized, and attributed to direct observation of the barrier crossing.7,11 A recent long-trajectory simulation confirms the low barriers determined experimentally (1.5 kBT for λD14A in table 1).8
Table 1.
λ-repressor nomenclature, mutations from wild type, and melting temperature determined by fluorescence wavelength shift and rounded to the nearest degree.
| Name | Mutations | Tm °C |
|---|---|---|
| λQ33Y | Y22W, Q33Y, G46A, G48A | 70±0.5 |
| λsQ33Y | Y22W, Q33Y | 70±0.5 |
| λD14A | D14A, Y22W,Q33Y,G46A, G48A | 68±0.5 |
| λnQ33Y | Y22W, Q33Y, A37G, A49G | 53±0.5 |
| λsA49G | Y22W, A37G, A49G | 48±0.5 |
Experimental analysis of two reaction coordinates9 and multiple probes12 using alanine-rich and alanine-poor mutants of λ6–85 demonstrated that even apparent two-state folders will require ≥2 reaction coordinates and >2 states for a full description. In addition, λ6–85 has a propensity for extended structure (here abbreviated PP/β because it is found in polyproline helices or beta strands) at high temperature and in mild denaturant.13
Indeed, rich energy landscape structure has been predicted by a Markov state analysis of multiple λ6–85 folding trajectories.2 For the λD14A mutant (Table 1), Bowman et al. carried out relaxation simulations starting with equal populations in the denatured microstates. They found two <10 μs phases in general agreement with T-jump experiments, but also a much slower ≥1 ms phase. The slow phase is present in simulations without denaturant; it is associated with compact beta-rich denatured states; it disappears only when the beta structural ensemble is removed from the calculation.
Bowman et al. offered several possible explanations for the calculated slow phase: it may have been missed by laser T-jump experiments, which usually extend to <0.5 ms; the slow phase may represent very slow folding of λ6–85 in denaturant, previously seen by experiment;14 or the force field they used may overemphasize β-sheet stability.
We continue the experiment-simulation dialog by carrying out new 5 ms T-jump measurements on alanine-rich and -poor mutants of λ6–85. We show that all the above explanations apply: We detected no significant slow phase for λD14A, so the force field or the equal population initial condition overestimates β-sheet propensity for this mutant. However, we detected a slow phase for two even more stable λ6–85 mutants, λQ33Y and λsQ33Y, proving that slow interconversion between structural ensembles of λ6–85 can occur without denaturant. Moreover, in mild denaturant λD14A also begins to show a slow phase. The computational suggestion that compact beta-rich traps result in slow dynamics is thus plausible, although λ6–85 still refolds in microseconds from the extensively unfolded state if it can avoid such traps. Our result highlights once again the importance of thermodynamic tuning when comparing experiment and computation, because small free energy discrepancies δG that can produce large population differences ~e−δG/RT.
λ6–85 mutant stability differs by fluorescence and CD detection
We selected a set of λ-repressor mutants that span a wide range of stabilities (Table 1). Nominal melting temperatures Tm were determined from two-state fits with linear baselines (Figure 1). We reproduced the CD melting temperatures (see SI).9 New measurements of Tm by fluorescence wavelength shift, better correlated with tryptophan fluorescence detected during T-jumps, yielded a different stability ranking. λD14A is ranked most stable by CD,9 but less stable than λQ33Y and λsQ33Y by wavelength shift (Figure 1). Such differences indicate breakdown of two state behavior.
Figure 1.
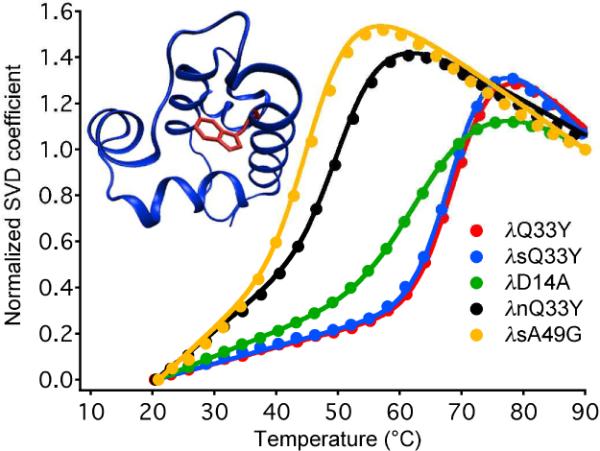
Thermal denaturation of λ-repressor mutants in table 1. The singular value decomposition (SVD) shown here represents the wavelenght shift of the W22 fluorescence spectrum (raw data see SI). The inset shows W22 in the crystal structure of λQ33Y.15
Mutants were divided into three categories by fluorescence-detected thermal stability. λQ33Y and λsQ33Y were the most stable variants with melting temperatures of 70 °C. The broader melting curve of λD14A occupies an intermediate stability range. λnQ33Y and λsA49G mutants were the least stable of the studied proteins.
Only the two most stable λ-repressor fragments have a significant slow phase amplitude
We studied the slow relaxation phase of λ-repressor variants by collecting ~5 ms of tryptophan fluorescence decays after the T-jump. The tryptophan decay lifetime is sensitive to folding. Individual decays with ca 3 ns lifetime were sampled at 100 ps intervals for 12.5 ns per decay, yielding a total of ~400 000 decays per kinetic trace. Each jump was then reproduced 60 times. Figure 2 shows combined results for three of the mutants binned into 1.25 μs intervals. χ(t) normalizes the trypotphan fluorescence decay time as a folding probe from χ=1 (shorter lifetime for all Y33 mutants) to χ=0 (longer lifetime for all Y33 mutants). All data at t>1 μs was fitted by a double exponential function, with the baseline fixed at 0. With that constraint and the signal-to-noise ratio, slow phases < 10% of the fast phase amplitude and slower than a few ms would not be discernible in our experiments. The fast initial phase has been discussed in detail elsewhere.7,15,16 The largest slow phases (e.g. Figure 2A) could be fitted by observed relaxation times ranging from τ=1.2 to 1.6 ms, and this range also provided good fits for small amplitude slow phases, if any, of other mutants. For more information (including correction of baselines for recooling and tryptophan photobleaching) refer to SI.
Figure 2.
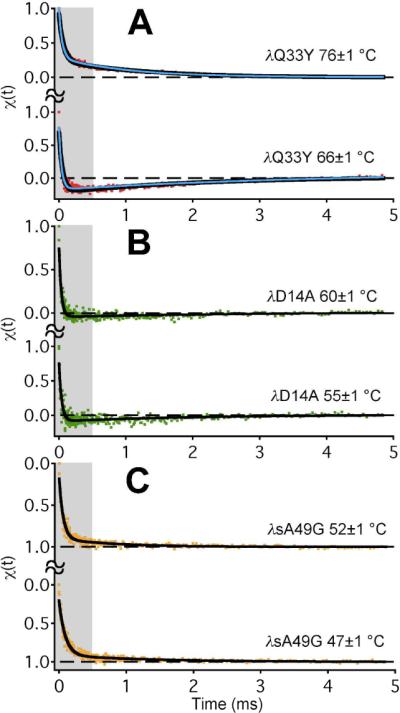
Temperature jump kinetics of λ-repressor mutants detected by tryptophan fluorescence decay, with double exponential fits in black. The global model fits are shown as blue curves in panel A. Traces were normalized from 1 (fast fluorescence decay) to 0 (slow decay). The fast phase was investigated previously (greyed out areas),7,9,16 so the ms scale is emphasized here.
λD14A, investigated by Bowman et al. computationally, showed only a ≤10% slow phase amplitude, nearly within experimental error (Figure 2B, Table 2). The more stable λQ33Y and λsQ33Y (by fluorescence melt) had by far the largest Aslow/Afast ratio of all studied mutants (Figure 1A, Table 2 and SI). Moreover, the amplitude of the slow phase switches sign when the temperature is increased. This can be explained by a model with at least two non-native states having different tryptophan lifetimes (see below). The glycine-rich and least stable variants λsA49G and λnQ33Y, showed ≤10% slow phases, within experimental error (Figure 2C, Table 2 and SI).
Table 2.
Ratios of amplitudes of slow and fast folding phases in λ-repressor mutants of different stabilities.
| Name | T (±1 °C) | Aslow/Afast |
|---|---|---|
| λQ33Y | 76 | 0.37±0.02 |
| 66 | −0.27±0.03 | |
| λD14A | 60 | −0.08±0.08 |
| 55 | −0.11±0.09 | |
| λsA49G | 52 | 0.1±0.4 |
| 47 | 0.1±0.2 |
Denaturant produces a slow phase in the D14A mutant
Bowman et al. proposed that the simulation might mimic mild denaturant conditions. T-jump experiments were also conducted at low concentrations of GuHCl, previously reported to induce the formation of PP/β structure in λ-repressor fragments.13 Our kinetics experiments show that 0.5 M GuHCl destabilizes the λ6–85 series by about 10 °C. The range of the slow to fast amplitude ratio Aslow/Afast does not increase in GuHCl for the most stable mutants; they are `maxed out.' However, λD14A shows an increased range of Aslow/Afast in 1 M GuHCl, which begins to resemble the more stable mutants (Figure 3). The least stable mutant λsA49G does not completely fold at room temperature in just 0.5 M GuHCl (see SI). Thus addition of the denaturant does produce slow kinetics for the mutants of intermediate stability, consistent with Bowman et al.'s suggestion that force field error in the all-atom simulations may correspond to experimental conditions in mild denaturant.
Figure 3.
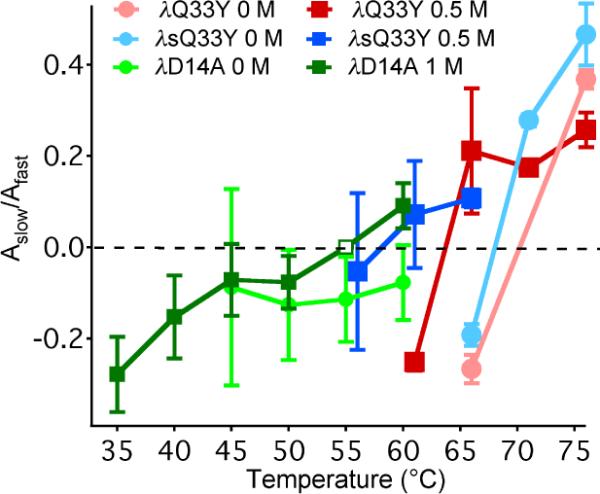
The dependence of the slow to fast amplitude ratio on temperature with and without GuHCl. (Open square: fixed.)
The small ms phase of λD14A when compared to λQ33Y and λsQ33Y turns out to be a genuine indicator that slow dynamics is less important in λD14A, not simply a result of tryptophan fluorescence not always being sensitive to slow phases. There is strong evidence that W22 fluorescence can monitor the slow phase whenever it is present in these three mutants. Oas and coworkers suggested that the Q33Y mutation substantially increases quenching of tryptophan upon folding, and the Y33-W22 interaction in the native state has been verified by X-ray crystallography of the λQ33Y mutant.15 The Y33-W22 interaction is equally present in all three mutants, based on the large fluorescence changes observed upon melting (Figure 1 and SI).
A low-resolution landscape model
The unusual result is that the most highly stabilized forms of λ6–85 are most likely to get stuck in beta-sheet traps, assuming that our slow experimental phase has the same origin as the ≥1 ms phases simulated by Bowman et al. With two very different time scales (≈10 μs vs. ≈ 1 ms for the most stable mutants), our data can be explained by a low-resolution model with ≥3 states. We will focus on a simple global model consistent with all experimental and computational observations so far. The model suggests a specific new hypothesis for future testing.
λ6–85 with oxidized methionines has been used to mimic the denatured state under native conditions.17 It exhibits strong helical propensity for residues 6–20 (centered on helix 1), and reduced flexibility for residues 50–83 (centered on helix 4), but no evidence for stable PP/β structure. Thus the unfolded lambda repressor does not necessarily form the compact sheet structure proposed by simulation under native solvent conditions. On the other hand, we recently reported several new mini-proteins containing only lambda repressor helices 1 and 4 connected by a linker.18 One (λblue1) has a CD spectrum, denaturation curve, and T-jump kinetics consistent with a cooperatively folding two-helix bundle. The slightly different λblue3 sequence has a CD spectrum peaked at 215 nm, consistent with beta sheet content.18 We also observed a CD signature consistent with PP/β structure in several lambda repressor fragments subjected to combinations of high temperature and mild denaturant.13 Thus PP/β structure is not much higher in free energy than the native alpha-helical secondary structure.
We fitted the data in Figure 2A with several three-state models (see SI). The free energy landscape most consistent with experiment (observed tryptophan lifetime changes) and thermodynamic expectations (extensively unfolded states should have lower free energy than compact states at high temperature) is shown in Figure 4A, and is depicted as a kinetic scheme in Figure 4B. The NET model is consistent with both experiment and simulation. The global model fits (blue curves in Figure 2A) closely match the experimental kinetics. The computed structure we suggest as representative for E in Figure 4A has a 0.99 computed probability of reaching N before reaching T.2 This is consistent with a rate ratio of 100:1 or a relaxation time ratio of 10 μs:1 ms, close to experimental observation.
Figure 4.
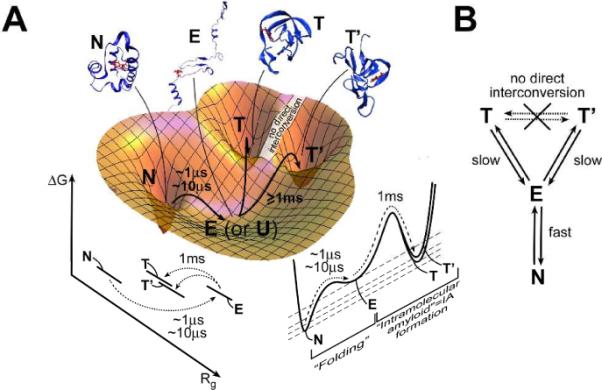
Folding of λ6–85 mutants along reaction coordinates related to compactness (Rg) and non-native secondary structure content. A The folding process per se, from an extensively unfolded state E (or U) to N, is fast. E can also convert slowly to compact non-native states T and T'. Suggested structures from refs.2,15 (N). B T and T' interconvert indirectly through E, which is in rapid equilibrium with N.
In the NET model, the extensively unfolded state E interconverts in microseconds with the native alpha-helical state N. This process is what one ordinarily considers protein folding. In addition, E interconverts in milliseconds with traps such as T or T'. We fitted such traps as a single kinetic state because our fluorescence probe does not distinguish them.
Kinetic traps of various types are known for many proteins,19 but the simulations of Bowman et al. make very specific structural predictions in addition to predicting a ms relaxation time: Different traps T and T' resemble each other in compactness and high beta-sheet content, but they differ in the detailed arrangement of sheets. The slow interconversion of T and T' is thus explained because their non-native secondary structure has to be unmade via the extensively unfolded state E. Once E is reached, it very rapidly interconverts with N. Therefore N is sampled many times on the time scale of T and T' interconversion. In our view, the native state N is thus not so much a `hub,' but simply easily reached from E, if we distinguish the N Ä E “folding process proper” from the E Ä T, T′ misfolding process.
Hypothesis
We suggest the following hypothesis to explain the structures seen by Bowman et al. as well as the slow phase observed experimentally only for the most stable λ6–85 mutants: Proteins whose hydrophobic interactions strongly favor compact states are prone to forming compact beta-rich traps or “intramolecular amyloids” (IAs). There is evidence for PP/β structure in monomeric denatured states of many proteins.13,20 Such non-native secondary structure could get locked-in when proteins rapidly become compact during folding, especially under mildly denaturing conditions. In particular, large proteins with many non-local options for hydrophobic contacts and beta strand formation might be more likely to form IAs in need of rescue by chaperones. Direct structural evidence for IAs could come from 2D-IR kinetics studies. IAs are complementary to a phenomenon observed for some proteins with a beta-rich native state: formation of non-native helical traps facilitated by favorable local interactions.21
Proteins have some kinetic and thermodynamic protection from IAs: Kinetically, the extensively unfolded state E converts much more rapidly to N than to T, in analogy to the large barrier separating real amyloid aggregates from denatured proteins and native states. Thermodynamically, T still ends up higher in free energy than N (unlike real amyloid aggregates; see model fit in SI). From an energy landscape perspective, one would say that fast folding lambda repressors have a glass transition temperature Tg dangerously close to the folding temperature Tf,22 but still end up getting stuck in traps only temporarily.
Supplementary Material
ACKNOWLEDGMENT
Funding was provided by NIH grant R01 GM093318. MBP was also supported by a Chemistry Department Fellowship. We thank G. R. Bowman and V. Pande for comments and additional simulation data.
ABBREVIATIONS
- 2D-IR
2-dimensional infrared spectroscopy
- CD
circular dichroism
- GuHCl
guanidine hydrochloride
- IA
intramolecular amyloid analog
- PP/β
extended structure
- T-jump
temperature jump
Footnotes
Supporting Information. Methods, additional figures showing data for all mutants, and tables containing fitting parameters.
Author Contributions The manuscript was written through contributions of all authors. All authors have given approval to the final version of the manuscript.
REFERENCES
- (1).Portman JJ, Takada S, Wolynes PG. J. Chem. Phys. 2001;114:5069. [Google Scholar]
- (2).Bowman GR, Voelz VA, Pande VS. Journal of the American Chemical Society. 2011;133:664. doi: 10.1021/ja106936n. [DOI] [PMC free article] [PubMed] [Google Scholar]
- (3).Piana S, Sarkar K, Lindorff-Larsen K, Guo M, Gruebele M, Shaw DE. J. Mol. Biol. 2011;405:43. doi: 10.1016/j.jmb.2010.10.023. [DOI] [PubMed] [Google Scholar]
- (4).Noé F, Schütte C, Vanden-Eijnden E, Reich L, Weikl TR. Proc. Nat. Acad. Sci. USA. 2009;106:19011. doi: 10.1073/pnas.0905466106. [DOI] [PMC free article] [PubMed] [Google Scholar]
- (5).Hecht MH, Sturtevant JM, Sauer RT. Proc. Nat. Acad. Sci. USA. 1984;81:5685. doi: 10.1073/pnas.81.18.5685. [DOI] [PMC free article] [PubMed] [Google Scholar]
- (6).Huang GS, Oas TG. Biochemistry. 1995;34:3884. doi: 10.1021/bi00012a003. [DOI] [PubMed] [Google Scholar]
- (7).Yang WY, Gruebele M. Nature. 2003;423:193. doi: 10.1038/nature01609. [DOI] [PubMed] [Google Scholar]
- (8).Lindorff-Larsen K, Piana S, Dror RO, Shaw DE. Science. 2011;334:517. doi: 10.1126/science.1208351. [DOI] [PubMed] [Google Scholar]
- (9).Yang WY, Gruebele M. Biochemistry. 2004;43:13018. doi: 10.1021/bi049113b. [DOI] [PubMed] [Google Scholar]
- (10).DeCamp SJ, Naganathan AN, Waldauer SA, Bakajin O, Lapidus LJ. Biophysical Journal. 2009;97:1772. doi: 10.1016/j.bpj.2009.07.003. [DOI] [PMC free article] [PubMed] [Google Scholar]
- (11).Liu F, Gruebele M. J. Chem. Phys. 2009;131:195101. doi: 10.1063/1.3262489. [DOI] [PubMed] [Google Scholar]
- (12).Ma H, Gruebele M. Proc. Nat. Acad. Sci. USA. 2005;102:2283. doi: 10.1073/pnas.0409270102. [DOI] [PMC free article] [PubMed] [Google Scholar]
- (13).Yang W, Larios E, Gruebele M. J. Am. Chem. Soc. 2003;125:16220. doi: 10.1021/ja0360081. [DOI] [PubMed] [Google Scholar]
- (14).Yang WY, Gruebele M. Phil. Trans. Royal Soc. London B. 2005;43:13018. [Google Scholar]
- (15).Liu F, Gao Y-G, Gruebele M. J. Mol. Biol. 2009;397:789. doi: 10.1016/j.jmb.2010.01.071. [DOI] [PMC free article] [PubMed] [Google Scholar]
- (16).Yang W, Gruebele M. Biophys. J. 2004;87:596. doi: 10.1529/biophysj.103.039040. [DOI] [PMC free article] [PubMed] [Google Scholar]
- (17).Chugha P, Oas TG. Biochemistry. 2007;46:1141. doi: 10.1021/bi061371g. [DOI] [PMC free article] [PubMed] [Google Scholar]
- (18).Prigozhin MB, Sarkar K, Law D, Swope WC, Gruebele M, Pitera J. J. Phys. Chem. B. 2011;115:2090. doi: 10.1021/jp110175x. [DOI] [PubMed] [Google Scholar]
- (19).Oliveberg M, Wolynes PG. Quarterly Reviews of Biophysics. 2005;38:245. doi: 10.1017/S0033583506004185. [DOI] [PubMed] [Google Scholar]
- (20).Fitzkee NC, Rose GD. Proc. Nat. Acad. Sci. USA. 2004;101:12497. doi: 10.1073/pnas.0404236101. [DOI] [PMC free article] [PubMed] [Google Scholar]
- (21).Hamada D, Segawa S, Goto Y. Nat. Struct. Biol. 1996;3:868. doi: 10.1038/nsb1096-868. [DOI] [PubMed] [Google Scholar]
- (22).Socci ND, Onuchic JN, Wolynes PG. Proteins Struct. Funct. Genetics. 1998;32:136. [PubMed] [Google Scholar]
Associated Data
This section collects any data citations, data availability statements, or supplementary materials included in this article.