

Abstract
BACKGROUND
Lens epithelium-derived growth factor p75 (LEDGF/p75) is a stress survival transcription co-activator and autoantigen that is overexpressed in tumors, including prostate cancer (PCa). This oncoprotein promotes resistance to cell death induced by oxidative stress and chemotherapy by mechanisms that remain unclear. To get insights into these mechanisms we identified candidate target stress genes of LEDGF/p75 using pathway-specific gene expression profiling in PCa cells.
METHODS
A “Human oxidative stress and antioxidant defense” qPCR array was used to identify genes exhibiting significant expression changes in response to knockdown or overexpression of LEDGF/p75 in PC-3 cells. Validation of array results was performed by additional qPCR and immunoblotting.
RESULTS
Cytoglobin (CYGB), Phosphoinositide-binding protein PIP3-E/IPCEF-1, superoxidase dismutase 3 (SOD3), thyroid peroxidase (TPO), and albumin (ALB) exhibited significant transcript down- and up-regulation in response to LEDGF/p75 knockdown and overexpression, respectively. CYGB gene was selected for further validation based on its emerging role as a stress oncoprotein in human malignancies. In light of previous reports indicating that LEDGF/p75 regulates peroxiredoxin 6 (PRDX6), and that PRDXs exhibit differential expression in PCa, we also examined the relationship between these proteins in PCa cells. Our validation data revealed that changes in LEDGF/p75 transcript and protein expression in PCa cells closely paralleled those of CYGB, but not those of the PRDXs.
CONCLUSIONS
Our study identifies CYGB and other genes as stress genes potentially regulated by LEDGF/p75 in PCa cells, and provides a rationale for investigating their role in PCa and in promoting resistance to chemotherapy- and oxidative stress-induced cell death.
Keywords: LEDGF/p75, prostate cancer, oxidative stress, gene profiling, peroxiredoxin, cytoglobin
INTRODUCTION
Prostate cancer (PCa) is the most frequently diagnosed cancer in men and the second leading cause of male cancer deaths in the U.S.A [1]. This growing public health challenge is aggravated by the documented disparities in the incidence and mortality of PCa affecting African–American (AA) men [2]. The identification of reliable markers that are predictive of PCa and influence tumor survival mechanisms is essential for the development of more effective therapeutic interventions for advanced stage PCa, and the elimination of health disparities associated with this disease.
Emerging evidence suggests that an augmented state of cellular oxidative stress contributes to the etiology and progression of PCa by inducing the upregulation of stress and redox proteins that protect cells against oxidative damage and promote tumor progression [3-6].
Lens epithelium-derived growth factor of 75 kDa (LEDGF/p75), also known as dense fine speckled autoantigen of 70 kD (DFS70), transcription coactivator p75 (TCP75), and PC4 and SFRS1 interacting protein (PSIP), is a stress-regulated survival protein that protects mammalian cells against oxidative stress and other environmental stressors [7-12]. LEDGF/p75 has been implicated in autoimmunity, inflammation, neuroprotection, HIV-1 replication, and cancer [13-23]. Our group demonstrated previously that LEDGF/p75 is an autoantigen in PCa that is overexpressed in prostate tumor cells and tissues [22]. Recent studies by our group demonstrated that this protein is also upregulated in other major human cancers [Basu and colleagues, unpublished data]. The overexpression of LEDGF/p75 in PCa cells and other tumor cell types attenuates lysosomal membrane permeabilization in the presence of chemotherapeutic drugs, thus promoting chemoresistance [23-26].
The mechanisms by which LEDGF/p75 promotes resistance to cell death induced by oxidative stress and chemotherapy remain largely unknown, although it has been proposed that this protein transactivates stress, antioxidant, and cancer-associated genes via interaction with heat shock elements (HSE) and stress response elements (STRE) in promoter regions [27-29]. Specific genes known to be transactivated by LEDGF/p75 are heat shock protein 27 (Hsp27), peroxiredoxin 6 (PRDX6), involucrin, alcohol dehydrogenase, aldehyde dehydrogenase, αB-crystallin, gamma-glutamylcysteine synthetase, vascular endothelial growth factor C (VEGF-C), and interleukin 6 (IL-6) [27-35]. There is also evidence that LEDGF/p75 interacts with specific transcription factors to facilitate the transactivation of stress and cancer-related genes. For instance, LEDGF/p75 binds to and tethers the MYC-binding protein JPO2 to chromatin, suggesting that it plays a role in the MYC-regulatory network [36,37]. LEDGF/p75 also interacts with the menin/mixed lineage leukemia (MLL) transcription complex to facilitate the expression of cancer associated target genes and leukemic transformation [38]. Previous studies by our group demonstrated that the transcriptional and stress-survival activities of LEDGF/p75 are regulated by alternative splicing and caspase-mediated disruption of its N- and C-terminal domains [15,30].
This study was undertaken to identify candidate target genes regulated by LEDGF/p75 using stress gene expression profiling analysis in PC-3 prostate tumor cells depleted of this protein or overexpressing it. Since LEDGF/p75 transcriptionally activates PRDX6 in COS-7 and lens epithelial cells [33], and members of the PRDX family are upregulated in PCa [6], we also investigated its influence on the expression of the PRDXs in PCa cells.
MATERIALS AND METHODS
Prostate Cell Lines and Antibodies
RWPE-1, RWPE-2, DU 145, PC-3, LNCaP, MDA PCa 2b, and 22Rv1 cell lines were purchased from American Type Culture Collection. BRF-41T and BRF-55T were purchased from AthenaES. PrEC and PrSC were obtained from Clonetics, Lonza. Cell lines were cultured as recommended by the suppliers in a humidified incubator with 5% CO2 at 37°C. The following antibodies were used: Mouse monoclonals anti-β-actin (Sigma-Aldrich), and anti-CYGB (1:200, Abnova); rabbit polyclonals anti-PRDX1 (1:1,000, Abcam), anti-PRDX2 (1:10,000, Abcam), anti-PRDX3 (1:5,000, Abcam), anti-PRDX4 (1:1,000, Abcam), anti-PRDX5 (1:1,000, Santa Cruz Biotechnology), anti-PRDX6 (1:3,000, Abcam), anti-LEDGF/p75 (1:1,000, Novus Biologicals); and horseradish peroxidase (HRP)-labeled secondary IgG antibodies (Zymed).
RNA Interference-Mediated Knockdown of LEDGF/p75
Transient knockdown of LEDGF/p75 in PC-3 cells was carried out using the Amaxa Nucleofection method (Amaxa, Lonza) according to the manufacturer’s protocol. Briefly, 1 × 10⁶ cells per sample were transfected with 380 nM small inhibitory RNAs (siRNA) using Amaxa solution-V and program T-13. LEDGF/p75 siRNA (siLEDGF/p75) and the scrambled siRNA duplex (siSD, negative control) were designed as described by Maertens et al. [39] and synthesized by Integrated DNA Technologies (IDT). The siLEDGF/p75 sequence corresponded to nucleotides 1,340–1,360 (5′-AGACAGCAUGAGGAAGCGAdTdT-3′) with respect to the first nucleotide of the start codon of the LEDGF/p75 open reading frame. The sequence for siSD was 5′-GCGCGCUUUGUAGGAUUCGdTdT-3′. In parallel, transfection without a siRNA duplex was performed as a mock control using only the nucleofection solution and these cells are referred to as “Nuc” transfected. Total RNA and proteins were extracted from siLEDGF/p75, siSD and “Nuc” trans-fected PC-3 cells 5 days post-transfection.
PC-3 cells with stable knockdown of LEDGF/p75 were a generous gift from Dr. Eric M. Poeschla (Mayo Clinic, Rochester, MN). These cells were generated using intensified lentiviral vector-based RNA interference as reported previously [40]. Short hairpin (sh) RNA1340 was used to stably knockdown LEDGF/p75 while shSCR served as the non-interfering shRNA control. PC-3 cells were transfected with vectors harboring shSCR control or shRNA1340.
Generation of PC-3 Cells With Stable Overexpression of LEDGF/p75
PC-3 cells stably overexpressing LEDGF/p75 were generated by transduction of the cells using retroviral vectors encoding the full-length LEDGF/p75. Briefly, PC-3 cells were seeded in a 96 well-plate at 30,000 cells per well. Next day, the RPMI medium was removed and was replaced by medium containing serial dilutions of the LEDGF/p75-vector or empty vector. Transduced cells were selected with blasticidin. LEDGF/p75 expression in selected clones was assessed by immunoblotting and immunofluorescence microscopy.
Docetaxel Resistant PC-3 and DU145 Cells
Docetaxel (DTX) resistant PC-3 (PC-3-DR) and DU 145 (DU 145-DR) cell lines were generous gifts from Dr. Julie Djeu (Moffit Cancer Center, Tampa, FL). These cell lines were developed by culturing PC-3 and DU 145 cells in the presence of DTX in a dose-escalation manner [41]. Cells that survived the initial culture in 1 nM DTX were passaged four times prior to increasing the concentration of DTX to 5.5 nM and subsequently to 11 nM. Resistant cells were maintained continuously in 11 nM DTX.
Pathway Specific Gene Expression Profiling
For stress gene profiling analysis, RNA was extracted from PC-3 cells with LEDGF/p75 knockdown or overexpression, and corresponding controls, using the RNeasy plus mini kit (Qiagen). RNA (0.5 μg) was reverse transcribed into cDNA using the RT2 first strand kit (SA Biosciences, Qiagen). The “Human Oxidative Stress and Antioxidant Defense” real time profiler qPCR-array (SA Biosciences, Qiagen) was used to quantify changes in gene expression in PC-3 cells with transient or stable knockdown, or overexpression of LEDGF/p75. This qPCR-array contains 84 genes involved in cellular stress response and redox control and includes all the six members of PRDX family. QPCR was performed on the MyiQ real-time PCR detection system (Bio-Rad) using RT2 Real Time™ SYBR Green/fluorescein PCR master-mix (SA Biosciences, Qiagen) according to the manufacturer’s protocol. Briefly, a total volume of 25 μl of PCR mixture, which included 12.5 μl of master mix, 11.5 μl of double distilled water, and 1 μl of cDNA was loaded into each of the 96 wells of the qPCR-array. PCR amplification was conducted at 95°C for 10 min, followed by 40 cycles of 95°C for 15 sec and 60°C for 1 min. The mRNA expression for each gene was normalized using the average expression of five housekeeping genes: β-2-microglobulin (β2M), hypoxanthine phosphoribosyltransferase 1 (HPRT1), ribosomal protein L13a (RPL13A), glyceraldehyde-3-phosphate dehydrogenase (GAPDH) and β-actin (ACTB). Gene profiling analyses were performed a minimum of three times in independent experiments. The ΔΔCt method was used for data analysis. Fold changes were calculated for each gene as the difference in gene expression between LEDGF/p75-depleted or -overexpressing cells and their corresponding controls using the RT Profiler qPCR-array data analysis software.
Independent qPCR Gene Validation
For confirmation of LEDGF/p75 depletion or overexpression, and in house independent validation of differentially regulated genes, total RNA was extracted from PC-3 cells with LEDGF/p75 knockdown or overexpression, and corresponding controls, using the RNeasy plus mini kit (Qiagen). RNA was also extracted from PC-3-DR and DU 145-DR cells using the same kit. RNA (0.5 μg) was reverse transcribed into cDNA using iScript cDNA synthesis kit (Biorad). QPCR was performed on the MyiQ real-time PCR detection system (Bio-Rad) using iQ SYBR Green Supermix (Bio-Rad) according to the manufacturer’s recommendations. Primer sequences for gene validation were designed using the Primer3 software and were commercially synthesized by IDT (Table I). Target mRNA values were normalized using GAPDH mRNA and data were expressed relative to normalized values of corresponding controls. Samples were analyzed in three independent experiments in triplicates.
TABLE I. Sequences of Primers Used for qPCR.
| Gene | Forward sequence (5′ to 3′) | Reverse Sequence (5′ to 3′) |
|---|---|---|
| LEDGF/p75 | TCAAGTCAACAGGCAGCAAC | TAGCTGCAGGTCGTCCTCTT |
| ALB | GAGCTTTTTGAGCAGCTTGG | GGTTCAGGACCACGGATAGA |
| CYGB | CTTCAGCCAGTTCAAGCACA | AGTACACCGGTTCCACCTTG |
| PIP3-E | GCCTGAGTGGAACGTCGTAT | ATGAACTTGCACAGCAAACG |
| SOD3 | CTGGGTGCAGCTCTCTTTTC | ACATGTCTCGGATCCACTCC |
| TPO | CCACTGTGTCCAACGTGTTC | ATGTCCATGGGCTGAAGAAA |
| GAPDH | CGAGATCCCTCCAAAATCAA | TTCACACCCATGACGAACAT |
Immunoblotting Analysis
Procedures were carried out essentially as described previously [22]. Briefly, total proteins from prostate cells were separated by SDS–PAGE (NuPAGE 4–12%, Invitrogen) followed by transfer to polyvinyl difluoride (PVDF) membranes (Millipore). Membranes were blocked with 5% dry milk solution in TBS-T buffer (20 mM Tris-HCl, pH 7.6, 140 mM NaCl, 0.1% Tween 20) for 1 hr and probed with primary antibodies. After several washes with TBS-T, membranes were incubated with horseradish peroxidase (HRP)-conjugated secondary antibodies for 30 min and then washed again with TBS-T. Protein bands were detected by enhanced chemiluminescence (Amersham).
Statistical Analysis
The Student’s t-test (two-tailed) was used to evaluate the significance of changes in mRNA expression between control and experimental groups. Probability values P < 0.05 were considered statistically significant.
RESULTS
Verification of LEDGF/p75 Knockdown and Overexpression in PC-3 Cells
Confirmation of transient and stable knockdown, as well as stable overexpression of LEDGF/p75, was performed by qPCR and immunoblotting (Fig. 1). QPCR in PC-3 cells with transient knockdown showed that LEDGF/p75 expression was depleted to 30.3% of its siSD control levels (Fig. 1A). PC-3 cells with stable LEDGF/p75 knockdown exhibited a 31.6% residual LEDGF/p75 transcript expression relative to the shSCR control (Fig. 1B). PC-3 cells stably overexpressing LEDGF/p75 showed 211% net transcript increase over empty vector control (Fig. 1C). Immunoblotting analysis confirmed the loss and gain of LEDGF/p75 protein expression in the knockdown and overexpressing cells, respectively (Fig. 1A-C, lower panels). Three biological RNA replicates of each sample were selected for subsequent oxidative stress-focused gene expression profiling analysis.
Fig. 1.

Verification of LEDGF/p75 depletion and overexpression in PC-3 cells. Real-time PCR (qPCR) and immunoblotting were used to determine the levels of LEDGF/p75 transcript (upper panels) and protein (lower panels), respectively, in PC-3 cells with transient knockdown (A), stable knockdown (B), and stable overexpression (C) of LEDGF/p75. Cells were transfected with siLEDGF/p75, shLEDGF/p75, and retroviral vector harboring full-length LEDGF/p75 to induce transient knockdown, stable knockdown, and stable overexpression, respectively. PC-3 cells with mock transfection (Nuc) or transfection with small interfering scrambled RNA duplex (siSD), short hairpin scrambled RNA (shSCR), and empty vector (Vector) served as corresponding controls. LEDGF/p75 mRNA levels were normalized to GAPDH mRNA levels and expressed relative to normalized corresponding control values respectively. *P < 0.01; **P < 0.001. P values were determinedwith two-tailed Student’s t-test.
Changes in Oxidative Stress Gene Expression in Response to Knockdown or Overexpression of LEDGF/p75
In light of the documented role of LEDGF/p75 as a transcription co-activator that transcriptionally upregulates stress response and antioxidant genes, we examined the expression of 84 oxidative stress-related genes in PC-3 cells with transient and stable LEDGF/p75 knockdown (Table II). Thirteen genes were differentially regulated (P < 0.05, fold change ≥ 2) in cells with transient knockdown relative to siSD control (Fig. 2A, Table II). Of these genes, nine were downregulated and four were upregulated. The number of differentially regulated (P < 0.05, fold change ≥ 2) genes in transiently LEDGF/p75-depleted PC-3 cells increased to 23 when compared with the nucleofection (Nuc) control cells (Table II). Of these, only four were upregulated and the rest showed significant downregulation. Eleven genes showed differential regulation in LEDGF/p75-knockdown cells when compared to both siSD and Nuc controls (Table II).
TABLE II. Changes in Gene Expression in “Oxidative Stress and Antioxidant Defense” qPCR Gene Microarray in Response to Knockdown or Overexpression of LEDGF/p75 in PC3 Cells.
| Transient KD |
Stable KD |
Stable OE |
|||||||
|---|---|---|---|---|---|---|---|---|---|
| KD vs. SD |
KD vs. Nuc |
KD vs. SCR |
OE vs. Vec |
||||||
| Gene | Description | Fold change |
P value |
Fold change |
Gene | Description | Fold change |
P value |
Fold change |
| ALB | Albumin | −2.74 | 0.002 | −3.28 | 0.001 | 1.77 | 0.060 | 2.89 | 0.036 |
| ALOX12 | Arachidonate 12-lipoxygenase | −1.39 | 0.044 | −1.53 | 0.002 | −1.83 | 0.454 | 1.47 | 0.018 |
| ANGPTL7 | Angiopoietin-like 7 | 1.71 | 0.017 | 1.04 | 0.820 | −2.06 | 0.000 | 1.22 | 0.116 |
| AOX1 | Aldehyde oxidase 1 | 2.14 | 0.002 | 2.12 | 0.001 | −1.58 | 0.008 | −1.43 | 0.000 |
| APOE | Apolipoprotein E | 2.87 | 0.000 | 2.23 | 0.000 | 1.21 | 0.286 | 2.40 | 0.185 |
| ATOX1 | ATX1 antioxidant protein 1 homolog | −1.19 | 0.072 | −1.38 | 0.016 | −1.52 | 0.064 | 1.19 | 0.041 |
| BNIP3 | BCL2/adenovirus E1B 19kDa interacting protein 3 |
−1.87 | 0.002 | −1.73 | 0.001 | 1.02 | 0.970 | −1.03 | 0.859 |
| CAT | Catalase | −1.63 | 0.059 | −1.56 | 0.041 | 1.24 | 0.683 | 2.36 | 0.000 |
| CCL5 | Chemokine (C-C motif) ligand 5 | 1.05 | 0.806 | −2.53 | 0.338 | −1.83 | 0.047 | 1.62 | 0.308 |
| CCS | Copper chaperone for superoxide dismutase |
−1.72 | 0.010 | −2.13 | 0.000 | 1.04 | 0.883 | 1.63 | 0.008 |
| CSDE1 | Cold shock domain containing E1, | 1.51 | 0.053 | 1.22 | 0.257 | −1.05 | 0.906 | 1.32 | 0.036 |
| CYBA | Cytochrome b-245, alpha polypeptide | −1.78 | 0.024 | −1.38 | 0.044 | −1.58 | 0.417 | 2.40 | 0.185 |
| CYGB | Cytoglobin | −2.51 | 0.000 | −6.13 | 0.000 | 1.51 | 0.029 | 7.35 | 0.001 |
| DGKK | Diacylglycerol kinase, kappa | −1.39 | 0.044 | −1.53 | 0.002 | −1.58 | 0.417 | 2.40 | 0.185 |
| DHCR24 | 24-dehydrocholesterol reductase | −1.02 | 0.806 | −1.20 | 0.068 | −1.03 | 0.937 | −1.32 | 0.145 |
| DUOX1 | Dual oxidase 1 | −1.37 | 0.053 | −2.09 | 0.000 | −1.05 | 0.876 | 2.14 | 0.016 |
| DUOX2 | Dual oxidase 2 | −1.37 | 0.019 | −2.20 | 0.000 | −1.05 | 0.925 | 2.40 | 0.185 |
| DUSP1 | Dual specificity phosphatase 1 | 1.13 | 0.026 | 1.04 | 0.482 | −2.03 | 0.002 | −1.51 | 0.009 |
| EPHX2 | Epoxide hydrolase 2, cytoplasmic | −1.72 | 0.000 | −2.36 | 0.000 | −1.42 | 0.792 | 2.01 | 0.201 |
| EPX | Eosinophil peroxidase | −1.37 | 0.115 | −2.28 | 0.001 | 1.51 | 0.268 | 6.11 | 0.003 |
| FOXM1 | Forkhead box M1 | 1.74 | 0.023 | 2.08 | 0.006 | −1.47 | 0.159 | −1.59 | 0.010 |
| GLRX2 | Glutaredoxin 2 | 1.01 | 0.782 | 1.04 | 0.543 | −1.02 | 0.917 | 1.23 | 0.010 |
| GPR156 | G protein-coupled receptor 156 | −1.11 | 0.551 | −1.14 | 0.447 | −1.81 | 0.009 | 1.13 | 0.697 |
| GPX1 | Glutathione peroxidase 1 | 1.07 | 0.882 | 1.24 | 0.533 | 1.08 | 0.961 | 1.20 | 0.043 |
| GPX2 | Glutathione peroxidase 2 | −1.09 | 0.598 | −1.70 | 0.021 | 1.01 | 0.977 | 1.69 | 0.224 |
| GPX3 | Glutathione peroxidase 3 (plasma) | −1.30 | 0.017 | −2.06 | 0.000 | 1.18 | 0.243 | 1.91 | 0.018 |
| GPX4 | Glutathione peroxidase 4 | 1.25 | 0.099 | 1.02 | 0.839 | −1.18 | 0.474 | 1.64 | 0.013 |
| GPX5 | Glutathione peroxidase 5 | −1.84 | 0.073 | −1.51 | 0.167 | −1.58 | 0.417 | 2.40 | 0.185 |
| GPX6 | Glutathione peroxidase 6 (olfactory) | −1.39 | 0.044 | −1.53 | 0.002 | −1.58 | 0.417 | 2.40 | 0.185 |
| GPX7 | Glutathione peroxidase 7 | −1.94 | 0.003 | −2.86 | 0.005 | −1.27 | 0.642 | 2.40 | 0.185 |
| GSR | Glutathione reductase | −1.04 | 0.874 | −1.16 | 0.376 | −1.21 | 0.834 | 1.16 | 0.563 |
| GSS | Glutathione synthetase | −1.04 | 0.827 | −1.16 | 0.518 | −1.11 | 0.754 | 1.47 | 0.003 |
| GSTZ1 | Glutathione transferase zeta 1 | −2.19 | 0.000 | −2.62 | 0.000 | 1.01 | 0.984 | 1.82 | 0.001 |
| GTF2I | General transcription factor II, i | −1.30 | 0.040 | −1.76 | 0.000 | 1.24 | 0.466 | 2.27 | 0.001 |
| KRT1 | Keratin 1 (epidermolytic hyperkeratosis) | −1.39 | 0.044 | −1.89 | 0.008 | −1.54 | 0.436 | 2.40 | 0.185 |
| LPO | Lactoperoxidase | −1.39 | 0.044 | −1.53 | 0.002 | −1.58 | 0.417 | 2.40 | 0.185 |
| MBL2 | Mannose-binding lectin (protein C) 2 | −2.15 | 0.042 | −2.49 | 0.013 | −1.05 | 0.908 | 1.92 | 0.222 |
| MGST3 | Microsomal glutathione S-transferase 3 | −1.47 | 0.021 | −1.70 | 0.000 | 1.14 | 0.214 | 1.22 | 0.135 |
| MPO | Myeloperoxidase | −1.60 | 0.185 | −1.31 | 0.340 | −1.58 | 0.417 | 2.40 | 0.185 |
| MPV17 | MpV17 transgene, | −1.13 | 0.073 | −1.61 | 0.001 | 1.03 | 0.954 | 1.46 | 0.020 |
| MSRA | Methionine sulfoxide reductase A | −1.28 | 0.186 | −1.61 | 0.008 | 1.58 | 0.042 | 1.26 | 0.031 |
| MT3 | Metallothionein 3 | −1.39 | 0.044 | −1.53 | 0.002 | −1.58 | 0.417 | 2.40 | 0.185 |
| MTL5 | Metallothionein-like 5, testis-specific | −1.78 | 0.001 | −2.62 | 0.000 | 1.53 | 0.250 | 1.14 | 0.170 |
| NCF1 | Neutrophil cytosolic factor 1 | −1.17 | 0.544 | −1.95 | 0.007 | −1.36 | 0.578 | 1.65 | 0.033 |
| NCF2 | Neutrophil cytosolic factor 2 | 1.80 | 0.012 | 1.98 | 0.003 | −2.06 | 0.009 | −1.84 | 0.001 |
| NME5 | Non-metastatic cells 5, | 2.21 | 0.001 | 1.66 | 0.019 | −1.36 | 0.551 | 2.09 | 0.199 |
| NOS2A | Nitric oxide synthase 2A | 1.01 | 0.959 | −2.24 | 0.186 | −1.49 | 0.489 | 2.40 | 0.185 |
| NOX5 | NADPH oxidase, EF-hand calcium bind- ing domain 5 |
1.14 | 0.452 | −1.03 | 0.809 | −1.39 | 0.287 | 2.57 | 0.012 |
| NUDT1 | Nudix (nucleoside diphosphate linked moiety X)-type |
1.48 | 0.019 | 2.05 | 0.000 | 2.72 | 0.418 | 1.37 | 0.512 |
| OXR1 | Oxidation resistance 1 | 1.09 | 0.470 | −1.33 | 0.005 | 1.41 | 0.122 | 1.55 | 0.009 |
| OXSR1 | Oxidative-stress responsive 1 | 1.27 | 0.003 | −1.01 | 0.873 | −1.11 | 0.423 | 1.29 | 0.114 |
| PDLIM1 | PDZ and LIM domain 1 (elfin) | −1.52 | 0.001 | −2.20 | 0.000 | −1.71 | 0.001 | 1.71 | 0.000 |
| PIP3-E | Phosphoinositide-binding protein PIP3-E | −4.08 | 0.015 | −6.57 | 0.002 | −1.14 | 0.572 | 2.24 | 0.010 |
| PNKP | Polynucleotide kinase 3′-phosphatase | 1.14 | 0.338 | 1.02 | 0.878 | 1.07 | 0.841 | 2.57 | 0.030 |
| PRDX1 | Peroxiredoxin 1 | −1.08 | 0.719 | −1.27 | 0.201 | −1.18 | 0.819 | −1.21 | 0.042 |
| PRDX2 | Peroxiredoxin 2 | 1.14 | 0.459 | −1.01 | 0.951 | 1.16 | 0.582 | 1.76 | 0.003 |
| PRDX3 | Peroxiredoxin 3 | 1.14 | 0.110 | 1.16 | 0.083 | −1.28 | 0.734 | −1.47 | 0.389 |
| PRDX4 | Peroxiredoxin 4 | 1.25 | 0.054 | 1.14 | 0.493 | −1.36 | 0.283 | 1.08 | 0.305 |
| PRDX5 | Peroxiredoxin 5 | −1.30 | 0.021 | −1.51 | 0.014 | −1.17 | 0.676 | 1.75 | 0.006 |
| PRDX6 | Peroxiredoxin 6 | 1.46 | 0.010 | 1.47 | 0.098 | −1.44 | 0.254 | 1.07 | 0.076 |
| PREX1 | Phosphatidylinositol 3,4,5-trisphosphate- dependent RAC exchanger 1 |
−1.06 | 0.521 | −1.01 | 0.824 | 1.04 | 0.942 | 1.54 | 0.231 |
| PRG3 | Proteoglycan 3 | −1.39 | 0.044 | −1.53 | 0.002 | −1.58 | 0.417 | 2.40 | 0.185 |
| PRNP | Prion protein (p27-30) | 1.07 | 0.562 | −1.03 | 0.787 | −1.30 | 0.373 | 1.57 | 0.280 |
| PTGS1 | Prostaglandin-endoperoxide synthase 1 | −1.37 | 0.237 | −1.10 | 0.649 | −1.59 | 0.189 | 2.40 | 0.185 |
| PTGS2 | Prostaglandin-endoperoxide synthase 2 | 2.21 | 0.001 | 1.91 | 0.019 | −1.61 | 0.367 | 2.68 | 0.055 |
| PXDN | Peroxidasin homolog (Drosophila) | −1.37 | 0.002 | −1.95 | 0.000 | 1.12 | 0.679 | 2.39 | 0.003 |
| PXDNL | Peroxidasin homolog-like (Drosophila) | −1.42 | 0.049 | −1.92 | 0.058 | −2.01 | 0.200 | 2.81 | 0.090 |
| RNF7 | Ring finger protein 7 | −1.13 | 0.448 | −1.45 | 0.046 | −1.39 | 0.232 | 1.18 | 0.062 |
| SCARA3 | Scavenger receptor class A, member 3 | −1.49 | 0.053 | −1.33 | 0.072 | −1.10 | 0.561 | 1.45 | 0.216 |
| SELS | Selenoprotein S | −1.13 | 0.372 | −1.64 | 0.002 | −1.14 | 0.634 | 1.93 | 0.001 |
| SEPP1 | Selenoprotein P, plasma, 1 | −2.56 | 0.000 | −4.18 | 0.000 | 1.41 | 0.576 | 1.07 | 0.839 |
| SFTPD | Surfactant, pulmonary-associated protein D |
−1.21 | 0.342 | 1.08 | 0.574 | −1.03 | 0.944 | 2.60 | 0.130 |
| SGK2 | Serum/glucocorticoid regulated kinase 2 | −1.57 | 0.021 | −2.36 | 0.002 | 1.33 | 0.028 | 2.59 | 0.050 |
| SIRT2 | Sirtuin 2 | 1.09 | 0.506 | −1.38 | 0.006 | 1.14 | 0.290 | 2.93 | 0.008 |
| SOD1 | Superoxide dismutase 1, soluble | 1.01 | 0.860 | −1.08 | 0.302 | 1.10 | 0.758 | −1.03 | 0.666 |
| SOD2 | Superoxide dismutase 2, mitochondrial | −1.11 | 0.160 | −1.31 | 0.027 | −1.33 | 0.288 | 1.32 | 0.014 |
| SOD3 | Superoxide dismutase 3, extracellular | −3.15 | 0.002 | −5.43 | 0.000 | −1.22 | 0.929 | 4.12 | 0.000 |
| SRXN1 | Sulfiredoxin 1 homolog (S. cerevisiae) | 1.16 | 0.510 | 1.20 | 0.369 | −1.49 | 0.053 | 1.54 | 0.158 |
| STK25 | Serine/threonine kinase 25 | 1.07 | 0.634 | −1.33 | 0.060 | −1.11 | 0.702 | 1.81 | 0.035 |
| TPO | Thyroid peroxidase | −2.31 | 0.012 | −5.33 | 0.000 | 1.30 | 0.662 | 10.68 | 0.001 |
| TTN | Titin | −2.15 | 0.012 | −2.71 | 0.002 | 1.12 | 0.568 | 1.52 | 0.025 |
| TXNDC2 | Thioredoxin domain containing 2 | −1.69 | 0.030 | −1.29 | 0.224 | −1.63 | 0.316 | 2.40 | 0.185 |
| TXNRD1 | Thioredoxin reductase 1 | −1.17 | 0.248 | −1.10 | 0.453 | −1.10 | 0.820 | −1.03 | 0.958 |
| TXNRD2 | Thioredoxin reductase 2 | 1.11 | 0.482 | 1.02 | 0.804 | −1.42 | 0.561 | −1.12 | 0.485 |
Numbers in bold denote ≥2-fold changes with statistically significant P values (P < 0.05). Fold change values represent the average of at least three independent experiments in triplicates. KD, knockdown; SD, scrambled duplex siRNA; SCR, scrambled shRNA; Nuc, nucleofection; OE, overexpression; Vec, empty vector control.
Fig. 2.

Identification of stress genes potentially regulated by LEDGF/p75. A human oxidative stress and antioxidant defense qPCR-array was used to identify genes exhibiting significant up- or down-regulation of transcript levels in PC-3 cells with transient knockdown (A), stable knockdown (B), and stable overexpression (C) of LEDGF/p75. Messenger RNA levels were normalized using the average expression of five housekeeping genes (β2M, HPRT1, RPL13A, GAPDH, β-actin) and expressed relative to normalize dmRNA values of respective controls. Gene expression displaying significant differential regulation (fold-change ≥ 2; *P < 0.05, **P < 0.01; ***P < 0.001) was represented graphically. P values were determined with two-tailed Student’s t-test.
In PC-3 cells with stable LEDGF/p75 knockdown, only three genes exhibited significant downregulation (P < 0.05, fold change ≥ 2) relative to shSCR control cells (Fig. 2B). These were angiopoietin-like 7 (ANGPTL7), dual specificity phosphatase 1 (DUSP1), and neutrophil cytosolic factor 2 (NCF2). However, neither of these genes were significantly downregulated in cells with transient depletion of LEDGF/p75, nor significantly upregulated in cells overexpressing this protein (Table II).
The relative expression of the same 84 stress and antioxidant genes was also evaluated in PC-3 cells with stable LEDGF/p75 overexpression (Table II). Fourteen genes were significantly upregulated (P < 0.05, fold change ≥ 2) in cells overexpressing LEDGF/p75 relative to vector control cells (Fig. 2C). We did not detect any genes that were significantly downregulated beyond a 2-fold level in the overexpressing cells.
We observed that several genes exhibited significant expression changes in response to both knockdown and overexpression of LEDGF/p75, but the fold-change values did not reach the 2-fold change cut-off in at least one of these two categories (Table II). These genes included CCS (copper chaperone for superoxide dismutase), FOXM1 (forkhead box M1), GSTZ1 (glutathione transferase zeta 1), PDLIM1 (PDZ and LIM domain 1), SGK2 (serum/glucocorticoid regulated kinase 2), and TTN (titin).
Selection and Validation of Candidate Target Genes of LEDGF/p75 in PC-3 Cells
Common genes that were both significantly down-regulated when LEDGF/p75 was transiently knocked down, and upregulated when LEDGF/p75 was stably overexpressed were selected for further validation (Table III). There were five such genes: Albumin (ALB), cytoglobin (CYGB), phosphoinositide-binding protein (PIP3-E, commonly known as IPCEF-1), superoxide dismutase 3 (SOD3), and thyroid peroxidase (TPO). All these five genes exhibited a ≥2-fold down-regulation in transient knockdown and upregulation in overexpressing cells when compared to corresponding controls. Transcript expression of these genes was validated by additional qPCR (Table III) using our own primers, listed in Table I. The direction and magnitude of the fold changes were consistent with those detected in the qPCR-array.
TABLE III. Candidate Target Genes of LEDGF/p75 Selected for Additional Validation by qPCR.
| Transient KD vs. SD |
Stable OE vs. vec |
||||||||
|---|---|---|---|---|---|---|---|---|---|
| PCR Array |
RT-PCR |
PCR Array |
RT-PCR |
||||||
| Gene | Description | Fold change |
P-value | Fold change |
P-value | Fold change |
P-value | Fold change |
P-value |
| ALB | Albumin | −2.74 | 0.002 | −1.96 | 0.000 | 2.89 | 0.036 | 3.82 | 0.000 |
| CYGB | Cytoglobin | −2.51 | 0.000 | −2.48 | 0.000 | 7.35 | 0.001 | 3.61 | 0.000 |
| PIP3-E | Phosphoinositide binding protein PIP3-E | −4.08 | 0.015 | −3.30 | 0.000 | 2.24 | 0.010 | 3.06 | 0.001 |
| SOD3 | Superoxide Dismutase 3 | −3.15 | 0.002 | −4.57 | 0.000 | 4.12 | 0.000 | 2.41 | 0.016 |
| TPO | Thyroid peroxidase | −2.31 | 0.012 | −3.89 | 0.000 | 10.68 | 0.001 | 6.86 | 0.000 |
Fold change values represent the average of at least three independent experiments in triplicates. Statistical significance was considered at P < 0.05. KD, knockdown; SD, scrambled duplex siRNA; OE, overexpression; Vec, empty vector control.
From the above-mentioned five genes, we chose CYGB for further validation based on recent publications implicating it as tumor suppressor protein that is upregulated in hypoxic regions of tumors, and that protects tumor cells from oxidative stress-induced cell death [42-45]. Immunoblotting was performed to validate expression changes at the protein level. CYGB protein expression decreased in PC-3 cells with transient knockdown of LEDGF/p75, whereas it was elevated in overexpressing cells (Fig. 3), indicating that changes in mRNA levels were translated into changes at the protein level.
Fig. 3.
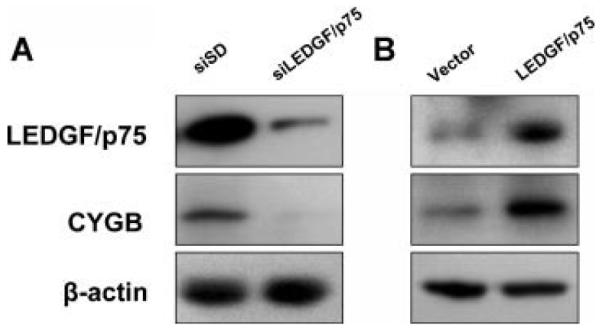
Analysis of changes in CYGB protein expression in response to knockdown or overexpression of LEDG/p75. Expression of CYGB protein was evaluated by immunoblotting in PC-3 cells with transient knockdown (A) and stable overexpression of LEDGF/p75 (B), to further validate the qPCR data. Protein loading was assessed with antibody to β-actin.
Analysis of LEDGF/p75, CYGB, and PRDX Expression in Prostate Cell Lines
Our recent observation that members of the PRDX family are upregulated in PCa [6], and the report that PRDX6 is a target gene of LEDGF/p75 in Cos-7 and lens epithelial cells [33], led us to investigate if there were changes in the transcript or protein expression of PRDXs in PC-3 cells in response to knockdown and overexpression of LEDGF/p75, as assessed by qPCR-array and immunoblotting. The results did not reveal significant decrease in the transcript or protein levels of any member of the PRDX family in the transiently or stably LEDGF/p75-depleted PC-3 cells (Fig. 4A,B). Although none of the PRDXs displayed a ≥2-fold transcript increase in LEDGF/p75 over-expressing PC-3 cells, these cells consistently showed in immunoblots slightly higher protein levels of PRDX3 and PRDX6 relative to vector controls (Fig. 4C). However, quantification of the blots showed that these increases were not significant (data not shown).
Fig. 4.

Transcript and protein expression changes of PRDXs in PC-3 cells in response to knockdown or overexpression of LEDGF/p75. PRDX expression was evaluated using the qPCR gene microarray (upper panels) and immunoblotting (lower panels) in PC-3 cells with transient knockdown (A), stable knockdown (B), and stable overexpression (C) of LEDGF/p75. Levels of PRDX mRNA were normalized using the average expression of five housekeeping genes in the qPCR microarray, and expressed relative to normalized corresponding control values respectively. Protein loading inimmunoblots was assessed with antibody to β-actin. P values were determined with two-tailed Student’s t-test and were not significant for any of the PRDXs.
These observations led us to further explore the association between the expression of LEDGF/p75, CYGB, PRDX3, and PRDX6 in other PCa cells. Immunoblot analysis of the protein expression of these four proteins in a panel of 11 prostate cell lines revealed high expression of all these proteins in transformed or tumor-derived cells but relatively low expression in primary prostate cell lines (PrEC or PrSC) (Fig. 5A). The protein levels of LEDGF/p75 paralleled those of CYGB in most of the cell lines. The most notable exception was the MDA-PCa-2b cell line, derived from a bone metastasis in an African American patient, in which the levels of LEDGF/p75 were lower than those of CYGB. The protein expression levels of LEDGF/p75 did not closely parallel those of PRDX3 and PRDX6 in all the cell lines. For example, LEDGF/p75 and PRDX6 protein levels paralleled each other in the PrEC, BRF-55T, RWPE-1, RWPE-2, DU 145, PC-3, and LNCaP; however, LEDGF/p75 expression was much lower than that of PRDX6 in the PrSC and MDA-PCa-2b cell lines but relatively higher in the BRF-41T and 22Rv1 cell lines. There was little overlap between the protein expression levels of LEDGF/p75 and PRDX3 in the panel of cell lines.
Fig. 5.

Expression analysis of LEDGF/p75, CYGB, PRDX3 and PRDX6 in a panel of human prostate cell lines. Protein expression was evaluated by immunoblotting in a panel of prostate cell lines (A) that included non-tumor (BRF-55T, PrEc, PrSc), a nontumorigenic immortalized normal human prostate epithelial cell line (RWPE-1), a tumorigenic transformed RWPE-1 cell line (RWPE-2), androgen-independent (DU-145, PC-3), and androgen-responsive (LNCaP, MDA-PCa-2b, BRF-41T, and 22RV1) cell lines. LEDGF/p75 transcript overexpression in a docetaxel resistant PC-3 cell line (PC-3-DR) was verified using qPCR (B). The expression of these four proteins was also evaluated by immunoblotting in PC-3-DR cells (C), PC-3-DR cells with transient LEDGF/p75 knockdown (D), and PC-3 cells stably overexpressing LEDGF/75 with transient knockdown of the protein (E). Parental PC-3 cells served as control for (B) and (C), while siSD transfected-PC-3-DR cells and LEDGF/p75-overexpressing PC-3 cells served as corresponding controls in (D) and (E), respectively. Protein loading was assessed with antibody toβ-actin. *P < 0.001. P values were determined with two-tailed Student’s t-test.
We took advantage of the availability of a DTX-resistant PC-3 cell line (PC-3-DR) to further compare the expression levels of these proteins. Interestingly, this cell line exhibited a 226% net increase of LEDGF/p75 transcript over the parental DTX-sensitive PC-3 cells (Fig. 5B). This is consistent with the previous observation from our group that LEDGF/p75, when overexpressed in PC-3 cells, promotes resistance to DTX-induced cell death [25]. Immunoblotting analysis revealed that LEDGF/p75, CYGB, and PRDX6, but not PRDX3, exhibited elevated expression in PC-3-DR cells as compared to parental PC-3 cells (Fig. 5C). To determine if the elevated expression of CYGB and PRDX6 in PC-3-DR was dependent on LEDGF/p75, we transiently knocked down LEDGF/p75 in this cell line and examined its effects on the protein expression of these proteins. Immunoblotting analysis revealed that while CYGB protein was impaired in the LEDGF/p75-depleted PC-3-DR cells, LEDGF/p75 knockdown in PC-3-DR cells had no effect on the expression of PRDX3 and PRDX6 (Fig. 5D). As additional confirmation, we transiently knocked down LEDGF/p75 in PC-3 cells with stable overexpression of the protein. In this case the protein levels of CYGB, but not those of PRDX3 and PRDX6, were also diminished in the LEDGF/p75-depleted in cells (Fig. 5E).
To investigate if similar changes occurred in another cell line, we evaluated the mRNA and protein levels of LEDGF/p75 and CYGB in a DTX-resistant DU 145 cell line (DU 145-DR) relative to parental DU 145 cells. This resistant cell line demonstrated 207.5% and 185.1% increases in the LEDGF/p75 and CYGB mRNA levels, respectively (Fig. 6A). Immunoblotting analysis confirmed overexpression of both proteins in the DU 145-DR cells (Fig. 6B), as compared to the parental cell line. To determine if the elevated expression of CYGB was dependent on LEDGF/p75, we transiently depleted LEDGF/p75 in DU 145-DR cells. QPCR analysis showed that depletion of LEDGF/p75 mRNA to 26.5% of its siSD control levels led to a 44% reduction in CYGB mRNA levels (Fig. 6C). These findings were confirmed at the protein level by immunoblotting, although the decrease in CYGB protein was not as drastic as the one observed in PC-3-DR cells depleted of LEDGF/p75 (Fig. 6D).
Fig. 6.

Expression analysis of LEDGF/p75 and CYGB in docetaxel resistant DU 145 cells. LEDGF/p75 and CYGB transcript and protein overexpression in a docetaxel resistant DU 145 cell line (DU 145-DR) were verified using qPCR (A) and immunoblotting (B), respectively. Transient knockdown of LEDGF/p75 and its effect on CYGB expression were evaluated in DU145-DR cells by qPCR (C) and immunoblotting (D). Protein loading was assessed with antibody to β-actin. *P < 0.05, **P < 0.001. P values were determined with two-tailed Student’s t-test.
Taken together, these results suggested that LEDGF/p75 regulates the expression of CYGB in PCa cells. On the other hand, PRDX6, previously reported as regulated by LEDGF/p75 in COS-7 cells and lens epithelial cells [33], does not appear to be directly regulated by this transcription co-activator in PC-3 cells.
DISCUSSION
We reported previously that LEDGF/p75 is highly expressed in PCa cells and clinical tissues and promotes resistance to DTX-induced caspase-independent lysosomal cell death [22,25]. LEDGF/p75 has also been shown to induce chemoresistance in other tumor cell types [23,24,26]; however, the molecular mechanisms by which it promotes chemoresistance in cancer cells remain elusive. The identification of its interacting partners and target genes is essential for understanding these mechanisms. We report here changes in the expression of multiple stress genes in response to knockdown and overexpression of LEDGF/p75 in PC-3 PCa cells. These candidate target genes of LEDGF/p75 were identified using a pathway-focused “oxidative stress and antioxidant defense” qPCR-array. This approach is cost-effective and relatively easy-to-use, and combines the multigene profiling capabilities of microarray with real-time PCR performance. Out of a total of 84 genes in this stress microarray, five genes associated with oxidative stress responses (ALB, CYGB, PIP3-E, SOD3, and TPO) were considered as regulated by LEDGF/p75 because they were significantly (P < 0.05, fold change ≥ 2) downregulated in PC-3 cells transiently depleted of this protein and upregulated in LEDGF/p75 overexpressing cells.
It should be noted that stable LEDGF/p75 knockdown did not reveal striking changes in stress gene expression because only three genes (ANGPTL7, DUSP1, and NCF2) were significantly downregulated under these conditions. However, none of these genes were downregulated in cells with transient knockdown, or upregulated by stable overexpression of LEDGF/p75, and most likely are not regulated by this protein. In light of the previous observation by Daugaard et al. [23], that transient siRNA-mediated knockdown of LEDGF/p75 induces cell death in some tumor cell lines, we could speculate that surviving PC-3 cell clones that were selected for stable depletion of this protein may have developed compensatory pathways to adapt to environmental stress. Nevertheless, we cannot rule out the possibility that transient or stable depletion of LEDGF/p75 may increase cellular sensitivity to specific stressors such as chemotherapeutic drugs.
Previous gene microarray profiling studies in LEDGF/p75-deficient cells (stable knockdown or knockout) did not unambiguously identify the regulation of a particular gene pathway [46,47]. However, two groups suggested that this protein regulates the expression of members of the HOX gene family [12,38], which would be consistent with the developmental abnormalities observed in mice with a disrupted Ledgf/Psip1 gene [12]. It is likely that LEDGF/p75 participates in the regulation of specific genes depending on the microenvironmental context (cell type, stressor type, etc). Transient increases in LEDGF/p75 expression in response to different stressors (e.g., chemotherapeutic drugs, oxidative and thermal stress, radiation, hypoxia, and serum starvation stress), or sustained overexpression of the protein in tumor cells, could induce its binding to specific DNA regions and transcription factors to facilitate the transactivation of genes that promote resistance to a particular stressor.
The five genes identified in this study as candidate target genes of LEDGF/p75 in PCa cells play different roles in the cellular response to environmental stress. ALB, for instance, exerts antioxidant effects in its native form, but altered cellular redox status can oxidize this plasma protein causing impairment of its antioxidant capacity [48]. In cancer patients with cachexia ALB levels are diminished by chronic oxidative stress [49]. Very little is known about the role of PIP3-E in the cellular response to stress. This protein, also called IPCEF1, is involved in translocating cytohesins (guanine nucleotide exchange factors) to the plasma membrane and in Rac signaling [50,51]. SOD3 (extracellular SOD) is a major antioxidant enzyme that is located in the extracellular matrix and on the cell surface, where it protects against tissue damage initiated by extracellular reactive oxygen species (ROS). Although its role in PCa is unclear, this protein appears to play a protective role against thyroid cancer and breast cancer progression [52,53]. The main function of TPO is the oxidation of iodide to iodine using hydrogen peroxide for thyroid hormone synthesis, thereby decreasing the potentially damaging effects of ROS [54]. Very little is known about its function in non-thyroid tumor tissues.
Our data suggested that CYGB is regulated by LEDGF/p75 since both its transcript and protein expression were downregulated in response to LEDGF/p75 knockdown and upregulated in response to LEDGF/p75 overexpression in PC-3 and DU 145 cancer cells. CYGB is an attractive candidate to follow as a potential target gene of LEDGF/p75 because it is emerging as a cancer-associated stress protein. CYGB has been implicated as a tumor suppressor gene due to its silencing by promoter hypermethylation and downregulation in various human cancers [42]. However, recent studies provided evidence that this protein is upregulated in tumor cells by hypoxic stress, and its increased expression in hypoxic tumor regions correlates with clinicopathological features of tumor aggressiveness in head and neck cancer [43,44]. Its overexpression in human SH-SY5Y neuroblastoma cells protected against oxidative stress-induced cell death [45]. The role of CYGB in PCa remains to be investigated. Future studies should focus on correlating CYGB expression with that of LEDGF/p75 in clinical prostate tumors, and determining if LEDGF/p75 binds to and transactivates its promoter region under basal and stress (oxidative and hypoxic) conditions.
Recently, our group demonstrated that the six members of the PRDX family are differentially expressed in PCa cells and clinical tumors [6]. Fatma et al. [33] also reported that PRDX6 is transactivated by LEDGF/p75 in both COS-7 and lens epithelial cells. These observations prompted us to evaluate if PRDX gene expression is influenced by LEDGF/p75 in PC-3 cells. The results from the qPCR-array and the immunoblotting analysis failed to show any significant fold change in PRDX1-6 transcript or protein in response to LEDGF/p75 knockdown or overexpression. Our results suggested that baseline PRDX6 expression in PCa cells is likely under the control of other transcription factors since it is not affected by depletion of LEDGF/p75. However, we cannot rule out that overexpression of LEDGF/p75 in response to environmental stressors could contribute to increased levels of PRDX6 over baseline as a mechanism to counter cellular stress. Alternatively, LEDGF/p75 might regulate PRDX6 in a cell type- or stressor-dependent manner.
A question that arises in studies aimed at identifying candidate target genes of LEDGF/p75 is whether this transcription co-activator directly regulates specific stress and antioxidant genes by binding to STRE in their promoter regions. Although there is evidence to support this notion [27,28,32-34], recent studies by members of this research team demonstrated that LEDGF/p75 binding to chromatin is not necessarily restricted to STRE in the genome, but is predominantly associated with active chromatin markers, such as H3 and H4 acetylation, H3K4 monomethylation, and RNA polymerase II binding [55]. It is likely that under conditions of stress, LEDGF/p75 interacts with specific transcription factors to tether them to active chromatin regions, where they can form complexes with RNA polymerase II to bind to promoter regions of specific stress and antioxidant genes and activate their expression.
In conclusion, this work provides evidence that transient knockdown and stable overexpression of LEDGF/p75 in PC-3 cells result in significant changes in the expression of stress and antioxidant genes such as ALB, CYGB, PIP3-E, SOD3, and TPO. It is likely that overexpression of LEDGF/p75 and its target genes in PCa cells plays a protective role against oxidative stress, chemotherapeutic drugs, and other stressors in the prostate tumor microenvironment. Further studies need to be performed to better understand the interplay between LEDGF/p75 and CYGB in altering cell death and survival in the presence of stress, and their role in PCa progression and therapy resistance. In particular, it would be crucial to establish whether knockdown of these two proteins in chemoresistant cancer cells sensitize against drug-induced cell death. LEDGF/p75 and CYGB might be important components of a mechanism of resistance against chemotherapy and oxidative damage in advanced prostate tumors and may represent novel therapeutic targets.
ACKNOWLEDGMENTS
The authors are grateful to Dr. Eric M. Poeschla (Mayo Clinic College of Medicine, Rochester, MN) for kindly providing the PC-3 cells with stable knockdown of LEDGF/p75. They thank Dr. Julie Y Djeu (H. Lee Moffitt Cancer Center, Tampa, FL) for her generous gift of the DTX resistant PCa cells. The authors thank Stephanny Acevedo-Martinez for technical assistance. This work was supported by grant NIH-NCMHD 5P20MD001632 (De Leon M, Casiano CA), KU Leuven Research Council grant OT/09/047 and the Flanders Research Foundation (FWO) grant G.0530.08 (Debyser Z, Gijsbers R).
Grant sponsor: NIH-NCMHD; Grant number: 5P20MD001632; Grant sponsor: KU Leuven Research Council; Grant number: OT/09/047; Grant sponsor: Flanders Research Foundation (FWO); Grant number: G.0530.08.
REFERENCES
- 1.Jemal A, Siegel R, Xu J, Ward E. Cancer statistics, 2010. CA Cancer J Clin. 2010;60(5):277–300. doi: 10.3322/caac.20073. [DOI] [PubMed] [Google Scholar]
- 2.Chornokur G, Dalton K, Borysova ME, Kumar NB. Disparities at presentation, diagnosis, treatment, and survival in African American men, affected by prostate cancer. Prostate. 2011;71(9):985–997. doi: 10.1002/pros.21314. [DOI] [PMC free article] [PubMed] [Google Scholar]
- 3.So A, Hadaschik B, Sowery R, Gleave M. The role of stress proteins in prostate cancer. Curr Genomics. 2007;8(4):252–261. doi: 10.2174/138920207781386951. [DOI] [PMC free article] [PubMed] [Google Scholar]
- 4.Kumar B, Koul S, Khandrika L, Meacham RB, Koul HK. Oxidative stress is inherent in prostate cancer cells and is required for aggressive phenotype. Cancer Res. 2008;68(6):1777–1785. doi: 10.1158/0008-5472.CAN-07-5259. [DOI] [PubMed] [Google Scholar]
- 5.Khandrika L, Kumar B, Koul S, Maroni P, Koul HK. Oxidative stress in prostate cancer. Cancer Lett. 2009;282(2):125–136. doi: 10.1016/j.canlet.2008.12.011. [DOI] [PMC free article] [PubMed] [Google Scholar]
- 6.Basu A, Banerjee H, Rojas H, Martinez SR, Roy S, Jia Z, Lilly MB, De León M, Casiano CA. Differential expression of peroxiredoxins in prostate cancer: Consistent upregulation of PRDX3 and PRDX4. Prostate. 2011;71(7):755–765. doi: 10.1002/pros.21292. [DOI] [PMC free article] [PubMed] [Google Scholar]
- 7.Singh DP, Ohguro N, Kikuchi T, Sueno T, Reddy VN, Yuge K, Chylack LT, Jr, Shinohara T. Lens epithelium-derived growth factor: Effects on growth and survival of lens epithelial cells, keratinocytes, and fibroblasts. Biochem Biophys Res Commun. 2000;267(1):373–381. doi: 10.1006/bbrc.1999.1979. [DOI] [PubMed] [Google Scholar]
- 8.Shinohara T, Singh DP, Fatma N. LEDGF, a survival factor, activates stress-related genes. Prog Retin Eye Res. 2002;21(3):341–358. doi: 10.1016/s1350-9462(02)00007-1. [DOI] [PubMed] [Google Scholar]
- 9.Sharma P, Singh DP, Fatma N, Chylack LT, Jr, Shinohara T. Activation of LEDGF gene by thermal-and oxidative-stresses. Biochem Biophys Res Commun. 2000;276(3):1320–1324. doi: 10.1006/bbrc.2000.3606. [DOI] [PubMed] [Google Scholar]
- 10.Ochs RL, Muro Y, Si Y, Ge H, Chan EK, Tan EM. Autoantibodies to DFS 70 kd/transcription coactivator p75 in atopic dermatitis and other conditions. J Allergy Clin Immunol. 2000;105(6Pt1):1211–1220. doi: 10.1067/mai.2000.107039. [DOI] [PubMed] [Google Scholar]
- 11.Ge H, Si Y, Roeder RG. Isolation of cDNAs encoding novel transcription coactivators p52 and p75 reveals an alternate regulatory mechanism of transcriptional activation. EMBO J. 1998;17(22):6723–6729. doi: 10.1093/emboj/17.22.6723. [DOI] [PMC free article] [PubMed] [Google Scholar]
- 12.Sutherland HG, Newton K, Brownstein DG, Holmes MC, Kress C, Semple CA, Bickmore WA. Disruption of Ledgf/Psip1 results in perinatal mortality and homeotic skeletal transformations. Mol Cell Biol. 2006;26(19):7201–7210. doi: 10.1128/MCB.00459-06. [DOI] [PMC free article] [PubMed] [Google Scholar]
- 13.Ganapathy V, Casiano CA. Autoimmunity to the nuclear autoantigen DFS70 (LEDGF): What exactly are the autoantibodies trying to tell us? Arthritis Rheum. 2004;50(3):684–688. doi: 10.1002/art.20095. [DOI] [PubMed] [Google Scholar]
- 14.Leoh LS, Mediavilla-Varela M, Basu A, Casiano CA. Autoanti-bodies to LEDGFp75/DFS70: Natural autoantibodies or sensors of an augmented state of cellular oxidative stress? In: Conrad K, Chan EKL, Fritzler MJ, Humbel RL, von Landenberg P, Shoenfeld Y, editors. From Pathogenesis to Therapy of Autoimmune Diseases. PABST Science Publishers; Lengerich: 2009. pp. 135–156. [Google Scholar]
- 15.Wu X, Daniels T, Molinaro C, Lilly MB, Casiano CA. Caspase cleavage of the nuclear autoantigen LEDGF/p75 abrogates its pro-survival function: Implications for autoimmunity in atopic disorders. Cell Death Differ. 2002;9(9):915–925. doi: 10.1038/sj.cdd.4401063. [DOI] [PubMed] [Google Scholar]
- 16.Raz-Prag D, Zeng Y, Sieving PA, Bush RA. Photoreceptor pro-tection by adeno-associated virus-mediated LEDGF expression in the RCS rat model of retinal degeneration: Probing the mechanism. Invest Ophthalmol Vis Sci. 2009;50(8):3897–3906. doi: 10.1167/iovs.08-3153. [DOI] [PMC free article] [PubMed] [Google Scholar]
- 17.Sugiura K, Muro Y, Nishizawa Y, Okamoto M, Shinohara T, Tomita Y, Usukura J. LEDGF/DFS70, a major autoantigen of atopic dermatitis, is a component of keratohyalin granules. J Invest Dermatol. 2007;127(1):75–80. doi: 10.1038/sj.jid.5700487. [DOI] [PubMed] [Google Scholar]
- 18.Takeichi T, Sugiura K, Muro Y, Matsumoto K, Ogawa Y, Futamura K, Kaminuma O, Hashimoto N, Shimoyama Y, Saito H, Tomita Y. Overexpression of LEDGF/DFS70 induces IL-6 via p38 activation in HaCaT cells, similar to that seen in the psoriatic condition. J Invest Dermatol. 2010;130(12):2760–2767. doi: 10.1038/jid.2010.203. [DOI] [PubMed] [Google Scholar]
- 19.Van Maele B, Busschots K, Vandekerckhove L, Christ F, Debyser Z. Cellular co-factors of HIV-1 integration. Trends Biochem Sci. 2006;31(2):98–105. doi: 10.1016/j.tibs.2005.12.002. [DOI] [PubMed] [Google Scholar]
- 20.Engelman A, Cherepanov P. The lentiviral integrase binding protein LEDGF/p75 and HIV-1 replication. PLoS Pathog. 2008;4(3):e1000046. doi: 10.1371/journal.ppat.1000046. [DOI] [PMC free article] [PubMed] [Google Scholar]
- 21.Llano M, Morrison J, Poeschla EM. Virological and cellular roles of the transcriptional coactivator LEDGF/p75. Curr Top Microbiol Immunol. 2009;339:125–146. doi: 10.1007/978-3-642-02175-6_7. [DOI] [PMC free article] [PubMed] [Google Scholar]
- 22.Daniels T, Zhang J, Gutierrez I, Elliot ML, Yamada B, Heeb MJ, Sheets SM, Wu X, Casiano CA. Antinuclear autoantibodies in prostate cancer: Immunity to LEDGF/p75, a survival protein highly expressed in prostate tumors and cleaved during apoptosis. Prostate. 2005;62(1):14–26. doi: 10.1002/pros.20112. [DOI] [PubMed] [Google Scholar]
- 23.Daugaard M, Kirkegaard-Sørensen T, Ostenfeld MS, Aaboe M, Høyer-Hansen M, Orntoft TF, Rohde M, Jäättelä M. Lens epithelium-derived growth factor is an Hsp70-2 regulated guardian of lysosomal stability in human cancer. Cancer Res. 2007;67(6):2559–25567. doi: 10.1158/0008-5472.CAN-06-4121. [DOI] [PubMed] [Google Scholar]
- 24.Rammer P, Groth-Pedersen L, Kirkegaard T, Daugaard M, Rytter A, Szyniarowski P, Høyer-Hansen M, Povlsen LK, Nylandsted J, Larsen JE, Jäättelä M. BAMLET activates a lysosomal cell death program in cancer cells. Mol Cancer Ther. 2010;9(1):24–32. doi: 10.1158/1535-7163.MCT-09-0559. [DOI] [PubMed] [Google Scholar]
- 25.Mediavilla-Varela M, Pacheco FJ, Almaguel F, Perez J, Sahakian E, Daniels TR, Leoh LS, Padilla A, Wall NR, Lilly MB, De Leon M, Casiano CA. Docetaxel-induced prostate cancer cell death involves concomitant activation of caspase and lysosomal pathways and is attenuated by LEDGF/p75. Mol Cancer. 2009;8:68. doi: 10.1186/1476-4598-8-68. [DOI] [PMC free article] [PubMed] [Google Scholar]
- 26.Huang TS, Myklebust LM, Kjarland E, Gjertsen BT, Pendino F, Bruserud Ä , Døskeland SO, Lillehaug JR. LEDGF/p75 has increased expression in blasts from chemotherapy-resistant human acute myelogenic leukemia patients and protects leukemia cells from apoptosis in vitro. Mol Cancer. 2007;6:31. doi: 10.1186/1476-4598-6-31. [DOI] [PMC free article] [PubMed] [Google Scholar]
- 27.Shin JH, Piao CS, Lim CM, Lee JK. LEDGF binding to stress response element increases alphaB-crystallin expression in astrocytes with oxidative stress. Neurosci Lett. 2008;435(2):131–136. doi: 10.1016/j.neulet.2008.02.029. [DOI] [PubMed] [Google Scholar]
- 28.Singh DP, Fatma N, Kimura A, Chylack LT, Jr, Shinohara T. LEDGF binds to heat shock and stress-related element to activate the expression of stress-related genes. Biochem Biophys Res Commun. 2001;283(4):943–955. doi: 10.1006/bbrc.2001.4887. [DOI] [PubMed] [Google Scholar]
- 29.Singh DP, Kubo E, Takamura Y, Shinohara T, Kumar A, Chylack LT, Jr, Fatma N. DNA binding domains and nuclear localization signal of LEDGF: Contribution of two helix-turn-helix (HTH)-like domains and a stretch of 58 amino acids of the N-terminal to the trans-activation potential of LEDGF. J Mol Biol. 2006;355(3):379–394. doi: 10.1016/j.jmb.2005.10.054. [DOI] [PubMed] [Google Scholar]
- 30.Brown-Bryan TA, Leoh LS, Ganapathy V, Pacheco FJ, Mediavilla-Varela M, Filippova M, Linkhart TA, Gijsbers R, Debyser Z, Casiano CA. Alternative splicing and caspase-mediated cleavage generate antagonistic variants of the stress oncoprotein LEDGF/p75. Mol Cancer Res. 2008;6(8):1293–1307. doi: 10.1158/1541-7786.MCR-08-0125. [DOI] [PMC free article] [PubMed] [Google Scholar]
- 31.Takamura Y, Fatma N, Kubo E, Singh DP. Regulation of heavy subunit chain of gamma-glutamylcysteine synthetase by tumor necrosis factor-alpha in lens epithelial cells: Role of LEDGF/p75. Am J Physiol Cell Physiol. 2006;290(2):C554–C566. doi: 10.1152/ajpcell.00398.2005. [DOI] [PubMed] [Google Scholar]
- 32.Cohen B, Addadi Y, Sapoznik S, Meir G, Kalchenko V, Harmelin A, Ben-Dor S, Neeman M. Transcriptional regulation of vascular endothelial growth factor C by oxidative and thermal stress is mediated by lens epithelium-derived growth factor/p75. Neoplasia. 2009;11(9):921–933. doi: 10.1593/neo.09636. [DOI] [PMC free article] [PubMed] [Google Scholar]
- 33.Fatma N, Singh DP, Shinohara T, Chylack LT., Jr. Transcriptional regulation of the antioxidant protein 2 gene, a thiol-specific antioxidant, by lens epithelium-derived growth factor to protect cells from oxidative stress. J Biol Chem. 2001;276(52):48899–48907. doi: 10.1074/jbc.M100733200. [DOI] [PubMed] [Google Scholar]
- 34.Fatma N, Kubo E, Chylack LT, Jr, Shinohara T, Akagi Y, Singh DP. LEDGF regulation of alcohol and aldehyde dehydrogenases in lens epithelial cells: Stimulation of retinoic acid production and protection from ethanol toxicity. Am J Physiol Cell Physiol. 2004;287(2):C508–C516. doi: 10.1152/ajpcell.00076.2004. [DOI] [PubMed] [Google Scholar]
- 35.Kubo E, Fatma N, Sharma P, Shinohara T, Chylack LT, Jr, Akagi Y, Singh DP. Transactivation of involucrin, a marker of differentiation in keratinocytes, by lens epithelium-derived growth factor (LEDGF) J Mol Biol. 2002;320(5):1053–1063. doi: 10.1016/s0022-2836(02)00551-x. [DOI] [PubMed] [Google Scholar]
- 36.Maertens GN, Cherepanov P, Engelman A. Transcriptional co-activator p75 binds and tethers the Myc-interacting protein JPO2 to chromatin. J Cell Sci. 2006;119(12):2563–2571. doi: 10.1242/jcs.02995. [DOI] [PubMed] [Google Scholar]
- 37.Bartholomeeusen K, De Rijck J, Busschots K, Desender L, Gijsbers R, Emiliani S, Benarous R, Debyser Z, Christ F. Differential interaction of HIV-1 integrase and JPO2 with the C terminus of LEDGF/p75. J Mol Biol. 2007;372(2):407–421. doi: 10.1016/j.jmb.2007.06.090. [DOI] [PubMed] [Google Scholar]
- 38.Yokoyama A, Cleary ML. Menin critically links MLL proteins with LEDGF on cancer-associated target genes. Cancer Cell. 2008;14(1):36–46. doi: 10.1016/j.ccr.2008.05.003. [DOI] [PMC free article] [PubMed] [Google Scholar]
- 39.Maertens G, Cherepanov P, Pluymers W, Busschots K, De Clercq E, Debyser Z, Engelborghs Y. LEDGF/p75 is essential for nuclear and chromosomal targeting of HIV-1 integrase in human cells. J Biol Chem. 2003;278(35):33528–33539. doi: 10.1074/jbc.M303594200. [DOI] [PubMed] [Google Scholar]
- 40.Llano M, Saenz DT, Meehan A, Wongthida P, Peretz M, Walker WH, Teo W, Poeschla EM. An essential role for LEDGF/p75 in HIV integration. Science. 2006;314(5798):461–464. doi: 10.1126/science.1132319. [DOI] [PubMed] [Google Scholar]
- 41.Patterson SG, Wei S, Chen X, Sallman DA, Gilvary DL, Zhong B, Pow-Sang J, Yeatman T, Djeu JY. Novel role of Stat1 in the development of docetaxel resistance in prostate tumor cells. Oncogene. 2006;25(45):6113–6122. doi: 10.1038/sj.onc.1209632. [DOI] [PubMed] [Google Scholar]
- 42.Shivapurkar N, Stastny V, Okumura N, Girard L, Xie Y, Prinsen C, Thunnissen FB, Wistuba II, Czerniak B, Frenkel E, Roth JA, Liloglou T, Xinarianos G, Field JK, Minna JD, Gazdar AF. Cytoglobin, the newest member of the globin family, functions as a tumor suppressor gene. Cancer Res. 2008;68(18):7448–7456. doi: 10.1158/0008-5472.CAN-08-0565. [DOI] [PMC free article] [PubMed] [Google Scholar]
- 43.Shaw RJ, Omar MM, Rokadiya S, Kogera FA, Lowe D, Hall GL, Woolgar JA, Homer J, Liloglou T, Field JK, Risk JM. Cytoglobin is upregulated by tumour hypoxia and silenced by promoterhypermethylation in head and neck cancer. Br J Cancer. 2009;101(1):139–144. doi: 10.1038/sj.bjc.6605121. [DOI] [PMC free article] [PubMed] [Google Scholar]
- 44.Emara M, Turner AR, Allalunis-Turner J. Hypoxic regulation of cytoglobin and neuroglobin expression in human normal and tumor tissues. Cancer Cell Int. 2010;10:33. doi: 10.1186/1475-2867-10-33. [DOI] [PMC free article] [PubMed] [Google Scholar]
- 45.Fordel E, Thijs L, Martinet W, Lenjou M, Laufs T, Van Bockstaele D, Moens L, Dewilde S. Neuroglobin and cytoglobin overexpression protects human SH-SY5Y neuroblastoma cells against oxidative stress-induced cell death. Neurosci Lett. 2006;410(2):146–151. doi: 10.1016/j.neulet.2006.09.027. [DOI] [PubMed] [Google Scholar]
- 46.Ciuffi A, Llano M, Poeschla E, Hoffmann C, Leipzig J, Shinn P, Ecker JR, Bushman F. A role for LEDGF/p75 in targeting HIV DNA integration. Nat Med. 2005;11(12):1287–1289. doi: 10.1038/nm1329. [DOI] [PubMed] [Google Scholar]
- 47.Shun MC, Raghavendra NK, Vandegraaff N, Daigle JE, Hughes S, Kellam P, Cherepanov P, Engelman A. LEDGF/p75 functions downstream from preintegration complex formation to effect gene-specific HIV-1 integration. Genes Dev. 2007;21(14):1767–1778. doi: 10.1101/gad.1565107. [DOI] [PMC free article] [PubMed] [Google Scholar]
- 48.Roche M, Rondeau P, Singh NR, Tarnus E, Bourdon E. The antioxidant properties of serum albumin. FEBS Lett. 2008;582(13):1783–1787. doi: 10.1016/j.febslet.2008.04.057. [DOI] [PubMed] [Google Scholar]
- 49.Chojkier M. Inhibition of albumin synthesis in chronic diseases: Molecular mechanisms. J Clin Gastroenterol. 2005;39(4):S143–S146. doi: 10.1097/01.mcg.0000155514.17715.39. [DOI] [PubMed] [Google Scholar]
- 50.Venkateswarlu K. Interaction protein for cytohesin exchange factors 1 (IPCEF1) binds cytohesin 2 and modifies its activity. J Biol Chem. 2003;278(44):43460–43469. doi: 10.1074/jbc.M304078200. [DOI] [PubMed] [Google Scholar]
- 51.White DT, McShea KM, Attar MA, Santy LC. GRASP and IPCEF promote ARF-to-Rac signaling and cell migration by coordinating the association of ARNO/cytohesin 2 with Dock180. Mol Biol Cell. 2010;21(4):562–571. doi: 10.1091/mbc.E09-03-0217. [DOI] [PMC free article] [PubMed] [Google Scholar]
- 52.Laatikainen LE, Castellone MD, Hebrant A, Hoste C, Cantisani MC, Laurila JP, Salvatore G, Salerno P, Basolo F, Näsman J, Dumont JE, Santoro M, Laukkanen MO. Extracellular superoxide dismutase is a thyroid differentiation marker down-regulated in cancer. Endocr Relat Cancer. 2010;17(3):785–796. doi: 10.1677/ERC-10-0021. [DOI] [PubMed] [Google Scholar]
- 53.Teoh ML, Fitzgerald MP, Oberley LW, Domann FE. Overexpression of extracellular superoxide dismutase attenuates heparanase expression and inhibits breast carcinoma cell growth and invasion. Cancer Res. 2009;69(15):6355–6363. doi: 10.1158/0008-5472.CAN-09-1195. [DOI] [PMC free article] [PubMed] [Google Scholar]
- 54.Smyth PP. Role of iodine in antioxidant defence in thyroid and breast disease. Biofactors. 2003;19(3–4):121–130. doi: 10.1002/biof.5520190304. [DOI] [PubMed] [Google Scholar]
- 55.De Rijck J, Bartholomeeusen K, Ceulemans H, Debyser Z, Gijsbers R. High-resolution profiling of the LEDGF/p75 chromatin interaction in the ENCODE region. Nucleic Acids Res. 2010;38(18):6135–6147. doi: 10.1093/nar/gkq410. [DOI] [PMC free article] [PubMed] [Google Scholar]