Abstract
Protein motions that occur on the µs to ms timescale have been linked to enzymatic rates observed for catalytic turnovers, but not to transition-state barrier crossing. It has been hypothesized that enzyme motions on the fs time-scale of bond vibrations play a role in transition state formation. Here we perturb fs motion by substituting all non-exchangeable carbon, nitrogen, and hydrogen atoms with 13C, 15N, and 2H and observe the catalytic effects in HIV-1 protease. According to the Born-Oppenheimer approximation, isotopic substitution alters vibrational frequency with unchanged electrostatic properties. Using a fluorescent peptide to report on multiple steps in the reaction, we observe significantly reduced rates in the heavy enzyme relative to the light enzyme. A possible interpretation of our results is that there exists a dynamic link between mass-dependent bond vibrations of the enzyme and events in the reaction coordinate.
Enzymes achieve rate enhancements as great as 1020 relative to uncatalyzed reactions.1 Despite this efficiency, the lifetime of a chemical turnover (the conversion of a bond restoring mode to a bond translational mode) is approximately 10−12 the rate of an enzymatic turnover.2 Large-scale protein conformational motions occur on the same timescale (ms) as enzymatic turnovers and are necessary for substrate binding and product release, but have also been linked to barrier crossing.3–6 However, more rapid motions (fs) have been computationally linked to transition state formation.7–9 Our interpretation of this dichotomy is that conformational motions on the ms timescale are too slow to be coupled to chemical barrier crossing on the fs timescale, but are essential to bring groups in apposition to permit the fast dynamic motion to be coupled to transition state formation.2,7–11 Experimental evidence for coupling fs motion to barrier crossing has been recently reported,12 but additional experimentation is limited. Indeed, it has been argued that fs-ps timescale motions are not directly linked to transition-state formation.13 Here we alter the atomic mass of HIV-1 protease, a method to change fs motions, and observe links between bond vibrational dynamics and catalytic rate constants.
In this context, it is important to point out that “dynamics” refers to protein motions that promote barrier crossing.14 Our experimental approach is focused on the dynamics defined by fs-timescale vibrational motions of the enzyme, and our aim is to understand how they relate to transition state formation.
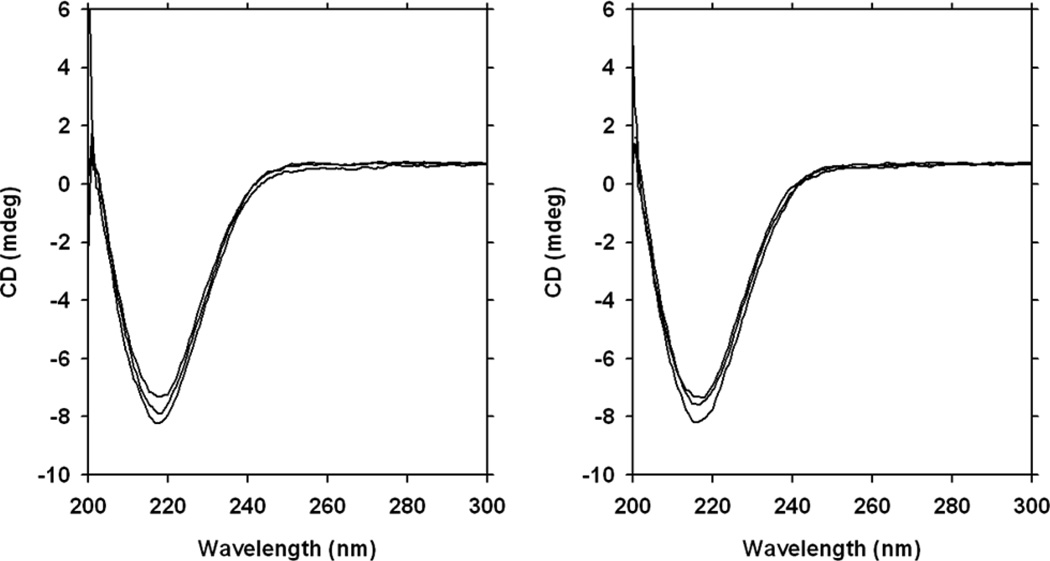
We expressed and purified a construct of HIV-1 protease in minimal media in which the sole carbon, nitrogen, and hydrogen sources are [13C6, 2H7]glucose, 15NH4Cl, and 99.8 % 2H2O, and call this ‘heavy enzyme’. Heavy atom substitution will reduce the frequency of mass-dependent bond vibrations but, according to the Born-Oppenheimer approximation, should not affect the electrostatic properties of the enzyme.15 Expression of HIV-1 protease in heavy media followed by purification in normal water solvents yielded an enzyme with an 11.6% increase in molecular mass (Figure S1). Circular dichroism (CD) spectral analysis (Figure 1) provides a distinct signal for the beta-sheets present in folded, active HIV-1 protease. The CD spectra for natural isotope-abundance (light) (Figure 1, left) and heavy (Figure 1, right) enzymes show that the isotopologs are structurally identical (an overlay of the data in Figure 1 can be found as Supporting Information, Figure S2). These data confirm that isotopic labeling of the enzyme has not affected its structural integrity. Therefore, any observed effects of the isotopic substitution on rate constants are unlikely to be attributed to misfolded or unproductive enzyme forms (also see below).
Figure 1.
Circular dichroism (CD) spectral analysis. Spectra obtained from 10 µM light (left) and heavy (right) HIV-1 protease in 50 mM MES-Tris pH 6.0 and 1.25 M NaCl are shown. Each trace represents an average of five scans and each graph shows traces from three independent samples. An overlay of the heavy and light spectra is shown as Supplementary Information, Figure S2.
HIV-1 protease is useful for these studies because it; 1) is a small homodimer of 99 amino acids,16,17 2) has well-defined chemical and conformational steps with defined substrates,18 and 3) has a well-characterized reaction mechanism with convenient assays using fluorescent peptides.19
Cleavage of the fluorescent peptide by HIV-1 protease can be described by the mechanism shown in Scheme 1, where E is the enzyme, A is the fluorescent peptide substrate, X is the gem-diol intermedieate, and P, Q are the product peptides.
Scheme 1.
Kinetic mechanism of HIV-1 protease
The reaction initiates with substrate binding, a process requiring the flexible “flaps” to close over the catalytic site18 – followed by activation of a water nucleophile through hydrogen bonding to the catalytic di-aspartyl residues.20 A reversible gem-diol intermediate is formed at the catalytic site, a result of the attack of the nucleophilic water on the carbonyl of the scissile peptide bond (denoted by k3).21–24 The breakdown of the C-N bond cleavage follows and is denoted by k5.
The peptide substrate used herein (aminobenzoyl-Thr-Ile-Nle*pNO2-Phe-Gln-Arg-NH2; where *denotes the scissile bond) contains an aminobenzoyl group that emits a fluorescent signal at 420 nm when excited at 340 nm. The signal is quenched in the uncleaved peptide by the pNO2-Phe in the P1′ position. Bond cleavage separates the fluorescent aminobenzoyl group from the pNO2-Phe quencher and results in an approximately 5-fold fluorescence increase relative to the un-cleaved peptide.19
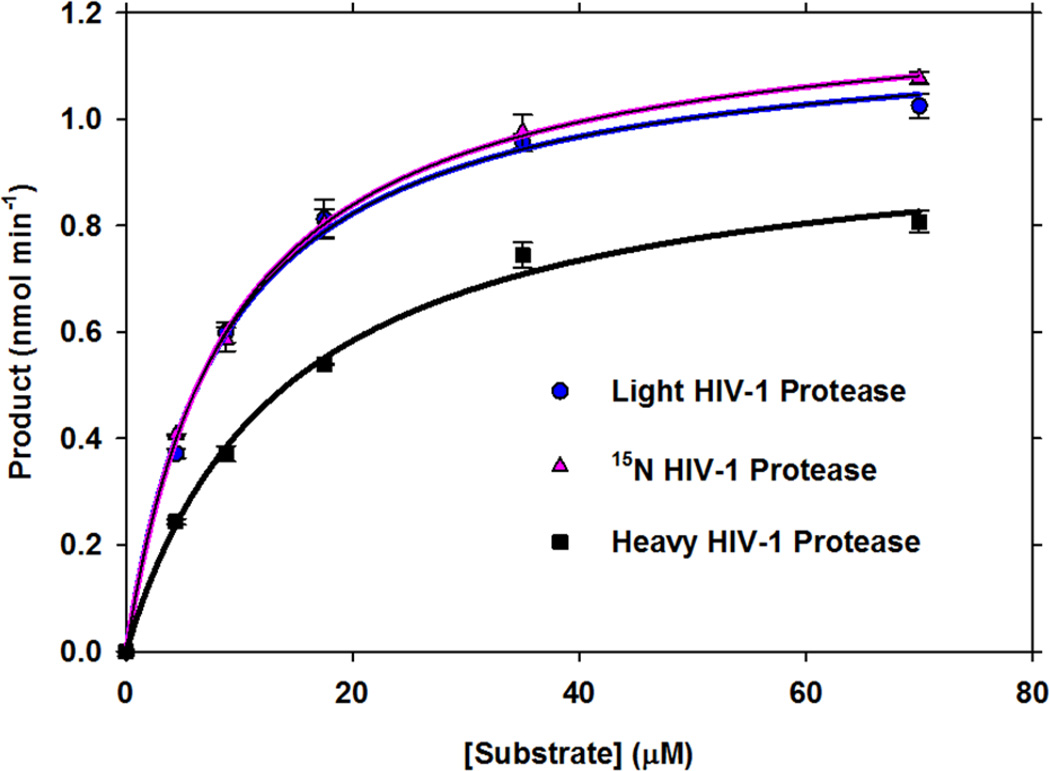
Previous analysis using the same peptide showed that the steady-state rate is limited by the final chemical step (k5).19 Thus, saturation kinetics obtained at 340 nm excitation will provide a kcat value that reports on a chemical step. Substrate saturation curves for the light and heavy enzymes at 340 nm excitation and 420 nm emission give kcat values of 3.28 ± 0.08 s−1 and 2.75 ± 0.08 s−1, respectively, giving an effect of 1.19 ± 0.05 (a catalytic rate reduction of 16% for the heavy enzyme) (Figure 2, Table 1). The saturation curve is also shown for the 15N-only labeled enzyme where the change in mass is small and the substrate saturation curves for 14N and 15N-labeled enzymes are superimposable. Its kcat value of 3.39 ± 0.08 s−1 reproduces and supports the rate observed for the light enzyme. The Km value for the light enzyme of 8.7 ± 0.7 µM was also equal in value to that for the 15N-labeled enzyme (9.1 ± 0.6 µM), but lower than the Km of 14 ± 1 µM measured for the heavy (2H, 13C, 15N) enzyme.
Figure 2.
Saturation kinetics of light, 15N-labeled and heavy HIV-1 protease. Steady state kinetic rates of product formation are plotted as a function of fluorescent substrate concentration. Catalysts are 10 nM light (blue), 15N (pink), and heavy (black) HIV-1 protease. Curves were plotted as a function of initial rate (vi) of product formation and substrate concentration and were fit to the equation vi = kcat[E][A]/(Km + [A]).
Table 1.
Kinetic constants for light and heavy HIV-1 protease
| measured | light enzyme | 15N enzyme | heavy enzyme | light/heavy |
|---|---|---|---|---|
| akcat | 3.28 ± 0.08 s-1 | 3.39 ± 0.08 s-1 | 2.75 ± 0.08 s-1 | 1.19 ± 0.05 |
| aKm | 8.7 ± 0.7 µM | 9.1 ± 0.6 µM | 14 ± 1.2 µM | 0.62 ± 0.07 |
| bv | 5.00 ± 0.04 FU min-1 | - | 4.47 ± 0.05 FU/min | 1.12 ± 0.02 |
| bkobs | 142 ± 5 s-1 | - | 90 ± 4 s-1 | 1.58 ± 0.09 |
Obtained from fitting the data in Figure 2 to vi = kcat[E][A]/(Km + [A]).
v and kobs obtained from stopped-flow data fit to Equation 1 from 280 nm excitation monitored with a 400 nm emission filter.
In addition to the steady-state analysis, we have applied an additional approach that permits observation of an enzyme-intermediate complex under pre-steady-state conditions. Energy transfer between the enzyme and the peptide intermediate can be observed when the complex is excited at 280 nm and monitored at >400 nm emission, which results in a 6.5-fold fluorescence increase relative to the product.19
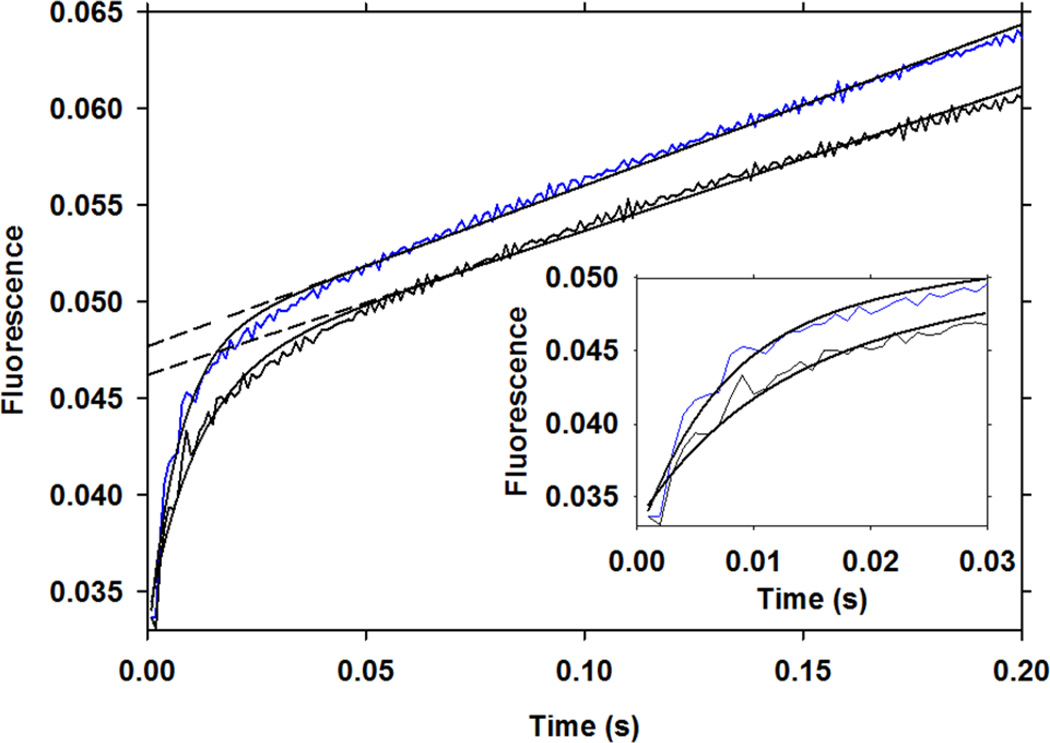
The pre-steady-state burst kinetics were analyzed during the first milliseconds of the reaction using a stopped-flow spectro-fluorometer (Figure 3). Equation 1 was used to fit the approach to the steady state, where F(t) is the relative fluorescence at time t, A0 is the amplitude of the fluorescence change for the burst phase, kobs is the rate constant of the burst phase, and v is the steady-state rate25:
| (1) |
Figure 3.
Pre-steady-state burst kinetics. Substrate (100 µM) was mixed with either 10 µM light (blue) or heavy enzyme (black) and the reaction was monitored at 280 nm excitation with a >400 nm emission filter. Curves were fit to Equation 1 and the kinetic constants are listed in Table 1. Each dashed line represents the slope of the steady-state phase extrapolated to the y-axis, which is proportional to the concentration of the EX complex for the corresponding enzyme. The inset window shows first 30 ms of the reaction and illustrates the magnitude of the difference observed in the burst rate constants for the heavy and light enzyme.
Reactions were performed under conditions of near-saturating substrate concentrations, which simplifies the kinetic model to Scheme 2.25
Scheme 2.
Simplified mechanism for pre-steady-state kinetic analysis
The burst observed during the first milliseconds of the reaction at 280 nm excitation reports on the rapid accumulation of an enzyme intermediate (Figure 3). As studies have confirmed the accumulation of a tetrahedral gem-diol intermediate21–24 (EX), the fluorescent burst is assigned to its accumulation. Fitting the data in Figure 3 to Equation 1 gives a kobs of 142 ± 5 s−1 for the light enzyme compared to 90 ± 4 s−1 for the heavy enzyme, where errors reflect the standard error of the mean (n = 6). This result means that at least one of the rate constants that determines kobs for the formation of the complex (kobs = k3 + k4 + k5)25 is altered due to the isotopic substitution (the total effect of which is 1.58 ± 0.09; a rate reduction of 37%). The k3 and k4 rate constants represent barrier crossing in the forward and reverse direction, respectively, for the attack of the water nucleophile. As k5 is the limiting rate for kcat, which is much slower than kobs (Figure 3 and Table 1), the observed effect on kobs is likely influenced predominantly by water attack to form the diol intermediate and not C-N bond breaking. The result implies that altered dynamic motion of HIV-1 protease reduces the probability of barrier crossing for water attack by approximately 37%.
The steady-state rate (v) obtained from fitting the data in Figure 3 to Equation 1 for the light enzyme was 5.00 ± 0.04 fluorescence units per minute (FU min−1) and 4.47 ± 0.05 FU min−1 for the heavy enzyme, indicating an effect of 1.12 ± 0.02 (an 11% rate reduction). At 100 µM substrate concentration the enzyme is not fully saturated and a slight difference in the concentration of the EX complex results from the altered Km values and accounts for part of the observed effect on v. However, reduced kcat for the heavy enzyme was observed in the substrate saturation kinetics obtained at 340 nm excitation (Figure 2, Table 1), which reflects a 16% decrease in k5 due to increased protein mass, as previously discussed.
The effect on kcat/Km is 1.90 ± 0.24, which is consistent with the effect of 1.58 ± 0.09 on (k3 + k4), within experimental error. This suggests that the overall catalytic effect of the heavy enzyme can attributed to rates which are linked to barrier crossing as opposed to an effect on binding.
In addition to structural comparisons shown in the CD spectra in Figure 1 and the confirmation of equal amounts of total protein in the experiments, further comparison of the amounts of active enzyme can be obtained by extrapolating the slope of the steady-state region in Figure 3 to the y-axis. The intercept approximates the concentration of substrate bound to catalytically competent enzyme.25 The difference in EX concentration for the light and heavy enzyme using this method is 3.2% (given by the light y-intercept divided by the heavy y-intercept, or 0.0477/0.0462). The predicted fractions of bound enzymes, based on their measured Km values, are 92.0% and 87.7% for the light and heavy HIV-1 protease, respectively; a difference of 4.3%. This difference correlates well with the 3.2% difference observed from the y-intercept values, confirming that active enzyme is proportional to the total protein concentration for both the light and heavy enzymes.
The data herein show that with independent experimental procedures, a consistent and significant reduction in rate can be observed as an effect of heavy atom substitution in HIV-1 protease. A possible interpretation of the data is that fs motions are linked to events leading to barrier crossing in the catalytic reaction. A similar interpretation has been proposed in a related study.12 It has been hypothesized that enzymes sample various interactions with the reactant until a state that can promote the passing of the chemical barrier is reached.7 In this model, reducing the frequency of the bond vibrations would reduce this sampling rate, which would lead to a decreased probability of crossing the chemical barrier(s), reflected in reduced catalytic rate constants as observed herein.
Supplementary Material
ACKNOWLEDGMENT
We thank Dr. John M. Louis, Laboratory of Chemical Physics, NIDDK, NIH for the HIV-1 protease expression plasmids. This work was supported by NIH research grant GM41916
Footnotes
ASSOCIATED CONTENT
Supporting Information. Experimental procedures, enzyme molecular weight determination by mass spectrometry and light vs. heavy CD spectra overlay. This material is available free of charge via the Internet at http://pubs.acs.org.
REFERENCES
- 1.Wolfenden R, Snider MJ. Accounts Chem Res. 2001;34:938. doi: 10.1021/ar000058i. [DOI] [PubMed] [Google Scholar]
- 2.Schramm VL. Annu Rev Biochem. 2011;80:703. doi: 10.1146/annurev-biochem-061809-100742. [DOI] [PMC free article] [PubMed] [Google Scholar]
- 3.Hammes-Schiffer S, Benkovic SJ. Annu Rev Biochem. 2006;75:519. doi: 10.1146/annurev.biochem.75.103004.142800. [DOI] [PubMed] [Google Scholar]
- 4.Boehr DD, Dyson HJ, Wright PE. Chem Rev. 2006;106:3055. doi: 10.1021/cr050312q. [DOI] [PubMed] [Google Scholar]
- 5.Henzler-Wildman KA, Thai V, Lei M, Ott M, Wolf-Watz M, Fenn T, Pozharski E, Wilson MA, Petsko GA, Karplus M, Hubner CG, Kern D. Nature. 2007;450:838. doi: 10.1038/nature06410. [DOI] [PubMed] [Google Scholar]
- 6.Eisenmesser EZ, Bosco DA, Akke M, Kern D. Science. 2002;295:1520. doi: 10.1126/science.1066176. [DOI] [PubMed] [Google Scholar]
- 7.Schwartz SD, Schramm VL. Nat Chem Biol. 2009;5:551. doi: 10.1038/nchembio.202. [DOI] [PMC free article] [PubMed] [Google Scholar]
- 8.Saen-Oon S, Quaytman-Machleder S, Schramm VL, Schwartz SD. Proc Natl Acad Sci U S A. 2008;105:16543. doi: 10.1073/pnas.0808413105. [DOI] [PMC free article] [PubMed] [Google Scholar]
- 9.Antoniou D, Basner J, Nunez S, Schwartz SD. Chem Rev. 2006;106:3170. doi: 10.1021/cr0503052. [DOI] [PubMed] [Google Scholar]
- 10.Antoniou D, Schwartz SD. J Phys Chem B. 2001;105:5553. [Google Scholar]
- 11.Cui Q, Karplus M. J Phys Chem B. 2002;106:7927. [Google Scholar]
- 12.Silva RG, Murkin AS, Schramm VL. Proc Natl Acad Sci U S A. 2011 In press. [Google Scholar]
- 13.Nashine VC, Hammes-Schiffer S, Benkovic SJ. Curr Opin Chem Biol. 2010;14:644. doi: 10.1016/j.cbpa.2010.07.020. [DOI] [PMC free article] [PubMed] [Google Scholar]
- 14.Olsson MH, Parson WW, Warshel A. Chem Rev. 2006;106:1737. doi: 10.1021/cr040427e. [DOI] [PubMed] [Google Scholar]
- 15.Pilar FL. Elementary Quantum Chemistry. Dover Publications; 1990. p. 309. [Google Scholar]
- 16.Navia MA, Fitzgerald PM, McKeever BM, Leu CT, Heimbach JC, Herber WK, Sigal IS, Darke PL, Springer JP. Nature. 1989;337:615. doi: 10.1038/337615a0. [DOI] [PubMed] [Google Scholar]
- 17.Wlodawer A, Miller M, Jaskolski M, Sathyanarayana BK, Baldwin E, Weber IT, Selk LM, Clawson L, Schneider J, Kent SB. Science. 1989;245:616. doi: 10.1126/science.2548279. [DOI] [PubMed] [Google Scholar]
- 18.Louis JM, Ishima R, Torchia DA, Weber IT. Adv Pharmacol. 2007;55:261. doi: 10.1016/S1054-3589(07)55008-8. [DOI] [PubMed] [Google Scholar]
- 19.Porter DJ, Hanlon MH, Furfine ES. Biochemistry. 2002;41:1302. doi: 10.1021/bi0116543. [DOI] [PubMed] [Google Scholar]
- 20.Brik A, Wong CH. Org Biomol Chem. 2003;1:5. doi: 10.1039/b208248a. [DOI] [PubMed] [Google Scholar]
- 21.Hyland LJ, Tomaszek TA, Jr, Roberts GD, Carr SA, Magaard VW, Bryan HL, Fakhoury SA, Moore ML, Minnich MD, Culp JS, et al. Biochemistry. 1991;30:8441. doi: 10.1021/bi00098a023. [DOI] [PubMed] [Google Scholar]
- 22.Kumar M, Prashar V, Mahale S, Hosur MV. Biochem J. 2005;389:365. doi: 10.1042/BJ20041804. [DOI] [PMC free article] [PubMed] [Google Scholar]
- 23.Kovalevsky AY, Chumanevich AA, Liu F, Louis JM, Weber IT. Biochemistry. 2007;46:14854. doi: 10.1021/bi700822g. [DOI] [PMC free article] [PubMed] [Google Scholar]
- 24.Das A, Mahale S, Prashar V, Bihani S, Ferrer JL, Hosur MV. J Am Chem Soc. 2010;132:6366. doi: 10.1021/ja100002b. [DOI] [PubMed] [Google Scholar]
- 25.Johnson KA. The Enzymes. Vol. 20. Academic Press, Inc; 1992. p. 1. [Google Scholar]
Associated Data
This section collects any data citations, data availability statements, or supplementary materials included in this article.


