

Abstract
Antiinflammatory effects of phenolic compounds from Emblica officinalis were evaluated in carrageenan and cotton pellet induced acute and chronic inflammatory animal model. Fractions of E. officinalis containing free (FPEO) and bounded (BPEO) phenolic compounds were assessed by HPLC technique. The free and bound phenolic compounds were studied for their acute and chronic antiinflammatory activity at dose level of 20 and 40 mg/kg. The carrageenan induced acute inflammation was assessed by measuring rat paw volume at different time of intervals. Further, cotton pellet induced chronic inflammation was assessed by granulomatous tissue mass estimation along with the estimation of tissue biomarker changes (i.e. lipid peroxidation, reduced glutathione, myeloperoxidase and plasma extravasation). The results indicated that in both acute and chronic inflammation, FPEO and BPEO show reduction in the inflammation, but significant effects was observed only at high doses of both fractions which was comparable to diclofenac treated group. In conclusion, phenolic compounds of E. officinalis may serve as potential herbal candidate for amelioration of acute and chronic inflammation due to their modulatory action of free radicals.
Keywords: Emblica officinalis, Chronic inflammation, Myeloperoxidase, Evans blue
Introduction
Emblica officinalis (E. officinalis), syn: Phyllanthus emblica, also known as amla belongs to the Euphorbiaceae family. E. officinalis has been reported to possess potential antioxidant effect (Liu et al. 2008). The fruits of amla are used in many medicinal preparations of Ayurvedic and Unani systems of medicine (Kirtikar and Basu 1933). It is also used to treat haemorrhage, diarrhoea and dysentery (Charaka 1941). In folk medicine, all parts of the plant, including fruit, seed, leaf, root, bark and flower are used in various Ayurvedic/Unani herbal preparations (Habib-ur-Rehman et al. 2007).
Amla is highly nutritious and could be important dietary source of vitamin C, minerals and amino acids. It also contains phenolic compounds, tannins, phyllembelic acid, phyllemblin, rutin, curcuminoides and emblicol (Zhang et al. 2000; Jeena et al. 2001). Singh and Sharma (1971) found that amla was effective in gastric syndromes. The therapeutic efficacy of amla in case of dyspepsia was evaluated (Chawla et al. 1982) with promising results in human subjects. Raw E. officinalis fruit is also used for making pickle and preservatives (Ahumada et al. 1989; Deokar 1998; Perry and Metzger 1980). The pharmacological studies shown that amla fruit was able to lower the lipid level in the liver of rabbits. It was also used as an antimicrobial (Rani and Khullar 2004), antitumor (Jeena et al. 2001), antipyretic and analgesic agent (Perianayagam et al. 2004; Sharma et al. 2003) as well as has shown hypoglycemic activity. It has also been found to possess potential effect on glucose intolerance, cerebral insufficiency, mental disorders, etc (Nadkarni 1976; Anila and Vijayalakshmi 2002).
Carrageenan induced hind paw inflammation is a neutrophil-mediated acute inflammatory response that produces hind paw swelling, erythema and localized hyperthermia (Leung et al. 2001; Tsuji et al. 2003). Inflammation and tissue injury lead to enhanced pain sensitivity (hyperalgesia), which in part is caused by altered plasticity in the spinal cord (Dubner and Ruda 1992; Woolf and Costigan 1999). Free radicals play an important role in the pathogenesis of inflammation (Di Rosa et al. 1971; Koblyakov 2001; Sood et al. 2009).
Moreover, E. officinalis has attracted the attention of researchers as it was found to be an interesting source of phenolic compounds, which include phenolic acids and flavonoids (Suresh Kumar et al. 2006). E. officinalis leaf extract possesses antiinflammatory action (Asmawi et al. 1993; Ihantola-Vormisto et al. 1997), but fruit extract containing free and bound phenolic constituents has not been explored yet. Therefore, in the present study, we present the role of free and bound phenolic compounds of E. officinalis in acute and chronic inflammation in rats.
Materials and methods
Animals
Sprague-Dawley rats (180–250 g) were procured from Panjab University, Chandigarh. The animals were housed under standard conditions of natural 12 h light and dark cycle with free access to food pellets (Hindustan Lever Products, Kolkata, India) and water. The experimental protocol was duly approved by Institutional Animal Ethics Committee (IAEC) and care of the animals was carried out according to the guidelines of “Committee for the Purpose of Control and Supervision of Experiments on Animals” (CPCSEA), Government of India (Reg No. 874/ac/05/CPCSEA).
Chemicals
Malondialdehyde (MDA), Folin’s phenol reagent, 5,5-dithiobis (2-nitro benzoicacid) (DTNB), 1-chloro 2,4-dinitrobenzene (CDNB) and reduced glutathione were purchased from SISCO Research Laboratories Pvt. Ltd. (Mumbai, India). Carrageenan and diclofenac were obtained from Sigma-Aldrich, USA. All other chemicals used in the experiments were of analytical grade.
Plant materials
Isolation of free phenolic compounds
Free phenolic compounds of E. officinalis were isolated according to the method of Subba Rao and Murlikrishna (2002). E. officinalis fruit powder (1 g) was extracted three times using 70% ethanol (350 mL, 2 h each). The combined extracts were filtered, centrifuged at 3,000 g for 15 min and supernatant was concentrated under reduced pressure. The pH was adjusted to 1.5 with hydrochloric acid (4 N). Phenolic acids were separated by ethyl acetate phase separation (450 mL) and the pooled fractions were treated with anhydrous sodium sulfate, filtered and evaporated to dryness. Total phenolic acid content was estimated spectrophotometrically at 760 nm by Folin–Ciocalteu method with gallic acid as the reference standard and expressed as gallic acid equivalent in milligrams per gram of dry weight sample. Total flavonoid content was determined spectrophotometrically at 358 nm by the aluminum chloride method with rutin as a reference standard and expressed as rutin equivalent in microgram per gram of dry weight sample. The presence of tannins was determined spectrophotometrically at 760 nm by the reduction of phosphotungstomolybdic acid method with tannic acid as a reference standard and expressed as tannic acid equivalent in milligram per gram of dry weight sample.
Isolation of bound phenolic compounds
Emblica officinalis extract as prepared above (2 g) was defatted with petroleum ether and chloroform (1:1, v/v) and free phenolic acids were extracted with 70% ethanol (450 mL). The dried samples were extracted with sodium hydroxide (1 M, 2,100 mL) containing 0.5% sodium borohydride and the clear supernatants were collected by centrifugation (Nordkvist et al. 1984). The combined supernatants (bound phenolics) were acidified with hydrochloric acid (4 N) to pH 1.5. The phenolic acids were extracted and quantified colorimetrically in the same way as free phenolic acids.
Characterization of free and bound phenolics compounds of E. officinalis
The active phenolic components of E. officinalis extract as prepared above were characterized using HPLC technique (model AKAD06532, Cyberlab Corporation, USA) on a reverse phase C18 column (4.6 × 250 mm) using a diode array UV detector (operating at 275 nm). A solvent system consisting water: acetic acid: methanol (isocratic 80:5:15, v/v) was used as mobile phase at a flow rate of 1 mL/min. In addition, a gradient solvent system (solvent A—water: acetic acid, ratio; 90:10, v/v and solvent B—15% methanol; 0–100% gradient; run time—5 min; flow rate: 1.0 mL/min) were used to resolve ascorbic acid, gallic and tannic acid peaks in the sample. Standard phenolic acids such as caffeic, ferulic, gallic, tannic and vanillic acid along with ascorbic acid were used for the identification of phenolic components present in both free and bound phenolic fractions of E. officinalis.
Carrageenan induced paw oedema
The paw oedema was induced in rats by 0.1 mL of 1 percentage of carrageenan in saline injecting subcutaneously in the subplantar region of left hind paw, 1 h after the administration of test samples (Brich et al. 1992). The test samples FPEO and BPEO were administered at low and high doses (20 and 40 mg/kg, p.o.). Diclofenac (25 mg/kg, p.o.) was used as a reference drug. The paw volumes of rats were measured by plethysmometer, before and after injection of 1% carrageenan at different time intervals (0.5, 1, 2, 4, 8, 16, and 24 h). Changes in paw volume were recorded at the above-mentioned time intervals.
Experimental design
Seven groups were employed in the present antiinflammatory study. Each group consists of six rats.
Group Ι (vehicle control group): 1% of carboxy methyl cellulose (1 mL, p.o.) was administered to the rats.
Group ΙI (negative control group): 0.1 mL of 1 percentage of carrageenan in saline was administered subcutaneously to the rats on the day of the experiment.
Group ΙΙΙ (positive control group): diclofenac sodium (12.5 mg/kg, p.o.) was administered before 1 h of the carragennan administration.
Groups ΙV–VΙI (test groups): rats were pretreated with free and bound phenolic compounds of E. officinalis (20 and 40 mg/kg, p.o.) for six consecutive days. On the sixth day, carrageenan was administered to the rats, after 1 h from the test compounds administration.
Cotton pellet induced granuloma tissue formation
FPEO, BPEO and diclofenac sodium were orally administered for 16 consecutive days in Groups III–VII. On eighth day, the animals (Groups II–VII) were mildly anaesthetised with ether, four sterile cotton pellets (50 mg) were subcutaneously implanted in the dorsal region of the rats and two at the axilla and two at the groin regions. On 16th day, all the rats were killed using anaesthetic ether and the cotton pellets were dissected out without affecting the surrounding granuloma tissues (Winter and Porter 1957). Chronic inflamed tissues (from axilla and groin regions) were excised and stored in 0.9% saline at −20°C for biochemical analysis. The moist pellets were weighed and then dried at 60°C for 48 h and then again reweighed. The percentage reduction in cotton pellet’s weight of the test samples was observed and compared with that of respective cotton pellet and diclofenac sodium treated groups. This provides a measure to assess the antiinflammatory effect of the test samples.
Experimental design
Seven groups were employed in the present antiinflammatory study. Each group consists of six rats and experimental protocol included 16 days study. Each group of animals was employed with sterile cotton pellets (50 mg each) implantation in the dorsal region of rats at eighth day.
Group Ι (vehicle control group): 1% of carboxy methyl cellulose (1 mL, p.o.) was administered to the rats for 16 consecutive days.
Group ΙΙ (negative control group): four sterile cotton pellets, 50 mg each were implanted in the dorsal region of rats at eighth day.
Group ΙΙΙ (positive control group): reference standard drug and diclofenac sodium (12.5 mg/kg, p.o.) were administered to the rats for 16 consecutive days.
Groups ΙV–VΙI (test groups): rats were pretreated with free and bound phenolic compounds of E. officinalis (20 and 40 mg/kg, p.o.) for 16 consecutive days.
Biochemical analysis
At the end of the study (i.e. 16th day), samples from granulomatous tissue were evaluated for the inflammatory and oxidative stress markers.
Estimation of total protein content
The protein concentration was estimated according to the method of Lowry et al. (1951). The protein content was determined spectrophotometrically at 750 nm using bovine serum albumin as a standard. Total protein content was expressed as milligram per gram of tissue.
Estimation of thiobarbituric acid reactive substances
Thiobarbituric acid reactive substances (TBARS; as an index of lipid peroxidation) were estimated according to the method of Ohkawa et al. (1979). The absorbance was measured spectrophotometrically at 532 nm. A standard calibration curve was prepared using 1–10 nM of 1, 1, 3, 3-tetra methoxy propane. TBARS value was expressed as nanomoles per gram of protein.
Estimation of reduced glutathione
The reduced glutathione (GSH) content in tissue was estimated using method of Ellman (1959). Absorbance was noted spectrophotometrically at 412 nm. A standard curve was plotted using 5–50 µM of reduced form of glutathione and the results were expressed as micrograms of reduced glutathione per gram of protein.
Estimation of myeloperoxidase activity
The myeloperoxidase (MPO) activity was estimated according to the method of Hillegass et al. (1990). The presence of MPO was measured at 460 nm for 3 min. MPO activity was expressed as unit per gram protein per minute. One unit of MPO activity was defined as that degrading 1 µmol peroxide per min at 25°C.
Evaluation of changes in vascular permeability
The amount of Evans blue in tissue samples was quantified according to the method described by Lange et al. (1994). Animals were injected with 1 mL of Evans blue (2 mg/kg) via the tail vein 30 min before sacrifice using anaesthetic ether. Evans blue was extracted from the tissues with 4 mL of formamide for 24 h at 50°C. The absorbance was measured at 620 nm. A standard calibration curve was prepared using Evans blue (0.1–1 µg) diluted with formamide. Vascular permeability was expressed as amount in microgram of Evans blue per milligram of protein.
Statistical analysis
All the results were expressed as mean ± standard error of means (SEM). The data from the carrageenan induced paw oedema was statistically analyzed by two-way analysis of variance followed by Bonferonni’s post test using Graph pad prism Version-5.0 software. The data from the cotton pellet induced granuloma tissue formation and biochemical results were statistically analyzed by one-way analysis of variance (ANOVA) followed by Tukey’s multiple range tests using Sigmastat Version-2.0 software and the p < 0.05 was considered to be statistically significant.
Results
Identification of free and bound phenolic compounds of E. officinalis
As previously reported, standardized HPLC protocol was not supported by separation of phenolic acids under isocratic elution condition (Duke 1992; Suresh Kumar et al. 2006). Therefore, we have optimized gradient running system; ascorbic acid was separated with a wide range of retention time (i.e., 1.79 min) relative to that of gallic acid and tannic acid, which eluted at 2.36 min. Moreover, tannic acid (319.4 µg/g of extract) and gallic acid (104.6 µg/g of extract) components have not been separated with this condition, but presence of this compounds identified by peak coincidence with the retention time of standard gallic and tannic acid. It was also revealed that there was absence of ascorbic acid in both free and bound phenolic fractions of E. officinalis (Fig. 1).
Fig. 1.
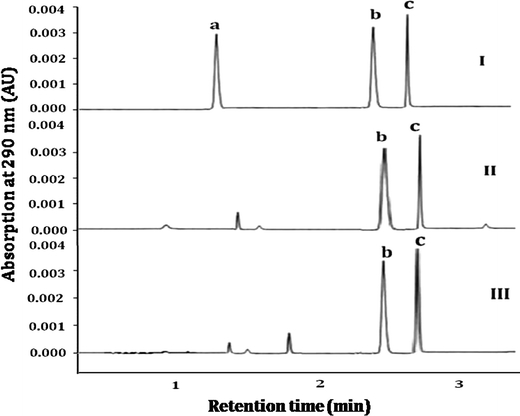
HPLC profile of free and bound phenolic fractions of E. officinalis. HPLC peak in I (a, b, c) indicates standard ascorbic acid (RT 1.63), tannic acid (RT 2.41) and gallic acid (RT 2.59), respectively. Further, peaks in II and III indicate the presence of tannic and gallic acid in both, free and bound phenolic fraction of E. officinalis, respectively
Effect of E. officinalis on carragennan induced paw oedema
The effect of phenolic compounds of E. officinalis on carragennan induced paw oedema was measured by the changes in left hind paw volume of the rats as presented in Figs. 2 and 3. The paw volume was found to increase as compare to vehicle control group in the carrageenan treated group whereas, diclofenac sodium (12.5 mg/kg) pretreated group have shown decrease in the paw volume as compared to carrageenan treated group. Pretreatment with FPEO and BPEO reduced the carrageenan induced inflammation as indicated by decrease in paw volume. However, only high dose (40 mg/kg) of both fractions have shown significant (p < 0.05) antiinflammatory response which was comparable to the diclofenac sodium pretreated group.
Fig. 2.
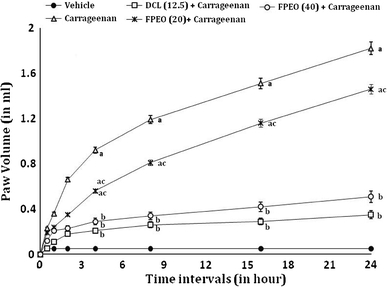
Effect of FPEO on carrageenan induced paw oedema. Time course of paw oedema was measured by the carrageenan induced increased paw volume in rats. DCL Diclofenac sodium, FPEO Free phenolic compounds of E. officinalis. Data were expressed as mean ± SEM, n = 6 rats per group. a p < 0.05 versus vehicle control groups, b p < 0.05 versus carrageenan treated group and c p < 0.05 versus diclofenac sodium control group
Fig. 3.
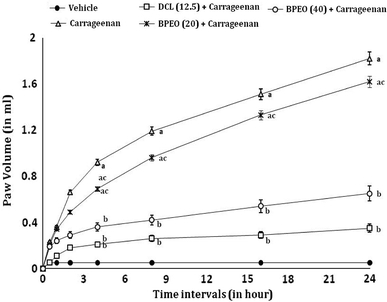
Effect of BPEO on carrageenan induced paw oedema. Time course of paw oedema was measured by the carrageenan induced increased paw volume in rats. DCL Diclofenac sodium, BPEO Bound phenolic compounds of E. officinalis. Data were expressed as mean ± SEM, n = 6 rats per group. a p < 0.05 versus vehicle control groups, b p < 0.05 versus carrageenan treated group and c p < 0.05 versus diclofenac sodium control group
Effect of E. officinalis on granulomatous tissue formation
Table 1 shows the effect of FPEO and BPEO on granulomatous tissue changes due to cotton pellet induced chronic inflammation. Changes in the cotton pellets weight (wet weight–dry weight) of the test samples were compared with the cotton pellet and diclofenac sodium (12.5 mg/kg) treated groups. Pretreatment (i.e. on days 1–8) of diclofenac and the phenolic fractions of E. officinalis did not show any behavioral changes. Both the fractions have shown reduction in granulomatous tissue mass as compared to cotton pellet treated group. However, only high doses (40 mg/kg) of each fraction have shown significant (p < 0.05) reduction which was comparable to that of diclofenac sodium pretreated group.
Table 1.
Effect of E. officinalis on wet and dry weight changes in cotton pellet induced chronic inflammation in rat. Effect of free and bound phenolic compounds of E. officinalis on percentage inhibition of granulomatous tissue mass formation
| Groups | Dose (mg/kg) | Wet weight(g) | Dry weight (g) | Difference (g) | Percentage inhibition |
|---|---|---|---|---|---|
| Vehicle + cotton | – | 1,011.4 ± 9.34 | 262.1 ± 2.5 | 749.3 | 00.00 |
| Cotton | – | 1,008.5 ± 8.72 | 254.4 ± 1.9 | 754.1 | 00.00 |
| DCL + cotton | 12.5 | 410.7 ± 5.31a | 212.1 ± 4.2a | 198.6a | 73.50 |
| FPEO + cotton | 20 | 741.8 ± 7.91b | 204.5 ± 3.4b | 537.3b | 23.49 |
| FPEO + cotton | 40 | 423.2 ± 6.47a | 198.3 ± 2.6a | 224.9a | 69.99 |
| BPEO + cotton | 20 | 824.6 ± 5.64b | 209.3 ± 2.1b | 615.3b | 17.88 |
| BPEO + cotton | 40 | 489.4 ± 4.83a | 224.2 ± 3.8a | 265.2a | 64.61 |
DCL diclofenac sodium, FPEO and BPEO free and bound phenolic compounds of E. officinalis, respectively
Percentage inhibition was calculated based on the vehicle treated group values
Values are mean ± SEM (n = 6)
a p < 0.05, as compared to cotton pellet treated group
b p < 0.05, as compared to diclofenac sodium pretreated group
Effect of E. officinalis on tissue biomarker changes
Effects of FPEO and BPEO on biomarker changes due to cotton pellet induced chronic inflammation are shown in Table 2. In the cotton pellet treated group; TBARS, MPO and plasma extravasation levels were found to increase whereas, GSH level was found to decrease as compare to normal control group. However, diclofenac sodium, pretreatment of FPEO and BPEO groups ameliorated the above changes but only high doses (40 mg/kg) of both fractions have shown significant (p < 0.05) ameliorative effect on the biomarker changes which were comparable to that of diclofenac sodium treated group.
Table 2.
Effect of E. officinalis on tissue biomarker changes in cotton pellet induced chronic inflammation in rat. Effect of free and bound phenolic compounds of E. officinalis on tissue biochemical changes
| Group | Dose (mg/kg) | TBARS (nmol/g of protein) | GSH (µmol/g of protein) | MPO (U/g of protein/min) | Evans blue (µg/mg of protein) |
|---|---|---|---|---|---|
| Vehicle + cotton | – | 4.21 ± 0.34 | 0.86 ± 0.02 | 1.83 ± 0.14 | 0.164 ± 0.02 |
| Cotton | – | 4.29 ± 0.29 | 0.82 ± 0.02 | 1.89 ± 0.21 | 0.172 ± 0.01 |
| DCL + cotton | 12.5 | 2.17 ± 0.12a | 1.31 ± 0.04a | 0.42 ± 0.13a | 0.052 ± 0.03a |
| FPEO + cotton | 20 | 3.84 ± 0.26b | 0.92 ± 0.02b | 1.47 ± 0.19b | 0.156 ± 0.01b |
| FPEO + cotton | 40 | 2.56 ± 0.47a | 1.24 ± 0.01a | 0.56 ± 0.11a | 0.063 ± 0.02a |
| BPEO + cotton | 20 | 4.09 ± 0.24b | 0.88 ± 0.02b | 1.64 ± 0.11b | 0.163 ± 0.05b |
| BPEO + cotton | 40 | 2.92 ± 0.41a | 1.19 ± 0.04a | 0.81 ± 0.03a | 0.079 ± 0.03a |
DCL diclofenac, FPEO and BPEO free and bound phenolic compounds of E. officinalis, respectively; TBARS thiobarbituric acid reactive substances, GSH reduced glutathione, MPO myeloperoxidase
Values are mean ± SEM (n = 6)
a p < 0.05, as compared to cotton pellet treated control group
b p < 0.05, as compared to diclofenac sodium pretreated group
Discussion
In this study, antiinflammatory effects of E. officinalis containing free and bound phenolic compounds were evaluated in carrageenan induced acute and cotton pellet induced chronic inflammation in Sprague-Dawley rats. Phenolic fractions of E. officinalis significantly reduced paw volume in acute inflammation. Further, in chronic inflammatory condition, free and bound phenolic compounds containing fractions were found to decrease the granulomatous tissue mass, cotton pellet induced granuloma tissue lipid peroxidation, myeloperoxidase activity and plasma extravasation whereas, there was a rise in the tissue reduced glutathione levels. However, significant effect was observed at high doses of both fractions.
Potential acute and chronic antiinflammatory activities were found in the both the fractions at high dose level (FPEO and BPEO). Further, in HPLC analysis, it was revealed that free phenolic contents of E. officinalis were three times more than that of bound form. Both phenolic fractions of E. officinalis are consisting of gallic and tannic acid. Phenolic fractions are also known to posses various secondary metabolites, such as flavonoids and phenolic acids, etc., that are well known to posses highest antioxidant activity (Arumugam et al. 2006). It may support the effect of FPEO and BPEO on suppression of the granulomatous tissues formation and free-radical scavenging activity resulted in fall in cotton pellet induced granuloma tissue TBARS and MPO activity, plasma extravasation and rise in GSH level due to the presence of pharmacological active moiety, such as flavonoids and other phenolic compounds (Arumugam et al. 2006; Suleyman et al. 2003). Moreover, flavonoids have been reported to inhibit the cyclooxygenase and lipooxygenase pathways of arachidonate metabolism (Pelzer et al. 1998; Zheng et al. 2003).
The inflammatory process was reported to be associated with the generation of reactive oxygen species (ROS) and reactive nitrogen species (RNS) (Jung et al. 2005). Recently, literature reveals that E. officinalis found to posses the phenolic compounds, i.e. flavonoids, phenolic acids, etc. (Suresh Kumar et al. 2006). Phenolic compounds (i.e. gallic acid, tannic acid, etc.) are having strong antioxidant action (Cuvrelier et al. 1992; Subba Rao and Murlikrishna 2002). It is also evident that phenolic compounds obtained from natural source may reduce oxidative stress by free-radical scavenging activity (Liu et al. 2008; Vinson et al. 1998). Further, leaf extract of E. officinalis is also expressed antiinflammatory action due to the presence of free phenolic constituents (Ihantola-Vormisto et al. 1997). Hence, the results of the present work suggest that the FPEO and BPEO fractions from the fruit of E. officinalis can attenuate the acute and chronic inflammatory response via antioxidant action. It may be concluded that these effects are due to the presence of phenolic compounds. However, further studies are needed to isolate the pharmacologically active compounds and their exact molecular mechanism to explore the antiinflammatory activity.
Acknowledgments
Thanks to Professor A. C. Rana and all faculty members of Rayat Institute of Pharmacy for their encouragement and support. We are also grateful to Rayat and Bahra Educational and Research Trust for their unconditional help in carrying out this project.
Open Access
This article is distributed under the terms of the Creative Commons Attribution Noncommercial License which permits any noncommercial use, distribution, and reproduction in any medium, provided the original author(s) and source are credited.
References
- Ahumada F, Hermosilla J, Hola R, et al. Studies on the effect of Schizandra chinensis extract on horses submitted to exercise and maximum effort. Phytother Res. 1989;3:175–179. doi: 10.1002/ptr.2650030504. [DOI] [Google Scholar]
- Anila L, Vijayalakshmi NR. Flavonoids from Emblica officinalis and Mangifera indica effectiveness for dyslipidemia. J Ethnopharmacol. 2002;79:81–87. doi: 10.1016/S0378-8741(01)00361-0. [DOI] [PubMed] [Google Scholar]
- Arumugam P, Ramamurthy P, Santhiya ST, et al. Antioxidant activity measured in different solvent fractions obtained from Mentha spicata Linn: an analysis by ABTS+ decolorization assay. Asia Pac J Clin Nutr. 2006;15:20–24. [PubMed] [Google Scholar]
- Asmawi MZ, Kankaanranta H, Moilanen E, et al. Anti-inflammatory activities of Emblica officinalis Gaertn leaf extracts. J Pharm Pharmacol. 1993;45:581–584. doi: 10.1111/j.2042-7158.1993.tb05605.x. [DOI] [PubMed] [Google Scholar]
- Brich PJ, Harrison SM, Hayes AG, et al. The non- peptide NK1 receptor antagonist (±)-CP-96, 345, produces antinoceptive and anti-oedema effects in the rat. Br J Pharmacol. 1992;105:508–510. doi: 10.1111/j.1476-5381.1992.tb09008.x. [DOI] [PMC free article] [PubMed] [Google Scholar]
- Charaka SC (1941) Nirnaya Sagar Press, Bombay, India, pp 114–115
- Chawla YK, Dubey P, Singh P, et al. Treatment of dyspepsia with Amalaki (Emblica officinalis) an Ayurvedic drug. Indian J Med Res. 1982;76:95–98. [PubMed] [Google Scholar]
- Cuvrelier ME, Richard H, Berset C. Comparison of the antioxidant activity of some acid phenols, structure–activity relationship. Biosci Biotech Biochem. 1992;56:324–325. doi: 10.1271/bbb.56.324. [DOI] [Google Scholar]
- Deokar AB (1998) In: Manav DS (eds) Medicinal plants grown at Rajegaon. Vikas Foundation, Pune, pp 48–49
- Di Rosa M, Giroud JP, Willoughby DA. Studies on the mediators of the acute inflammatory response induced in rats in different sites by carrageenan and turpentine. J Pathol. 1971;104:15–29. doi: 10.1002/path.1711040103. [DOI] [PubMed] [Google Scholar]
- Dubner R, Ruda MA. Activity-dependent neuronal plasticity following tissue injury and inflammation. Trends Neurosci. 1992;15:96–103. doi: 10.1016/0166-2236(92)90019-5. [DOI] [PubMed] [Google Scholar]
- Duke JA. Handbook of phytochemical constituents of GRAS herbs and other economic plants. Boca Raton: CRC Press; 1992. [Google Scholar]
- Ellman GL. Tissue sulfhydryl groups. Arch Biochem Biophys. 1959;82:70–77. doi: 10.1016/0003-9861(59)90090-6. [DOI] [PubMed] [Google Scholar]
- Habib-ur-Rehman, Yasin KA, Choudhary MA et al. (2007) Studies on the chemical constituents of Phyllanthus emblica. Nat Prod Res 21:775–781 [DOI] [PubMed]
- Hillegass LM, Griswold DE, Brickson B, et al. Assessment of myeloperoxidase activity in whole rat kidney. J Pharmacol Meth. 1990;24:285–295. doi: 10.1016/0160-5402(90)90013-B. [DOI] [PubMed] [Google Scholar]
- Ihantola-Vormisto A, Summanen J, Kankaanranta H, et al. Anti-inflammatory activity of extracts from leaves of Phyllanthus emblica. Planta Med. 1997;63:518–524. doi: 10.1055/s-2006-957754. [DOI] [PubMed] [Google Scholar]
- Jeena KJ, Kuttan G, Kuttan R. Antitumour activity of Emblica officinalis. J Ethnopharmacol. 2001;75:65–69. doi: 10.1016/S0378-8741(00)00378-0. [DOI] [PubMed] [Google Scholar]
- Jung HJ, Nam JH, Choi J. Anti-inflammatory effects of chiisanoside and chiisanogenin obtained from the leaves of Acanthopanax chiisanensis in the carrageenan and Freund’s complete adjuvant-induced rats. J Ethnopharmacol. 2005;97:359–367. doi: 10.1016/j.jep.2004.11.026. [DOI] [PubMed] [Google Scholar]
- Kirtikar KR, Basu BD. Indian medicinal plants. Allahabad: Basu Ltd; 1933. p. 488. [Google Scholar]
- Koblyakov VA. Free radicals and inflammation (progress in inflammation research series) Biochemistry. 2001;66:937–938. [Google Scholar]
- Lange S, Delbro DS, Jennische E. Evans blue permeation of intestinal mucosa in the rat. Scand J Gastroenterol. 1994;29:38–46. doi: 10.3109/00365529409090435. [DOI] [PubMed] [Google Scholar]
- Leung BP, Culshaw S, Gracie JA, et al. A role for IL-18 in neutrophil activation. J Immunol. 2001;167:2879–2886. doi: 10.4049/jimmunol.167.5.2879. [DOI] [PubMed] [Google Scholar]
- Liu X, Cui C, Zhao M, et al. Identification of phenolics in the fruit of emblica (Phyllanthus emblica L.) and their antioxidant activities. Food Chem. 2008;109:909–915. doi: 10.1016/j.foodchem.2008.01.071. [DOI] [PubMed] [Google Scholar]
- Lowry OH, Rosenbrough NJ, Farr AI. Protein measurement with Folin’s phenol reagent. J Biol Chem. 1951;193:265–275. [PubMed] [Google Scholar]
- Nadkarni KM (1976) Indian meteria medica. In: Nadkarni KM (eds) The Karnataka Printing Press and The Popular Press Ltd, Bombay, India, pp 480–484
- Nordkvist E, Salomonsso A, Aman P. Distribution of insoluble bound phenolic acids in barley grain. J Sci Food Agric. 1984;35:657–661. doi: 10.1002/jsfa.2740350611. [DOI] [Google Scholar]
- Ohkawa H, Ohishi N, Yagi K. Assay for lipid peroxides in animal tissues by thiobarbituric acid reaction. Anal Biochem. 1979;95:351–358. doi: 10.1016/0003-2697(79)90738-3. [DOI] [PubMed] [Google Scholar]
- Pelzer LE, Guardia T, Juarez AO, et al. Acute and chronic anti-inflammatory effects of plant flavonoids. IL Farmaco. 1998;53:421–424. doi: 10.1016/S0014-827X(98)00046-9. [DOI] [PubMed] [Google Scholar]
- Perianayagam JB, Sharma SK, Joseph A, et al. Evaluation of anti-pyretic and analgesic activity of Emblica officinalis Gaertn. J Ethnopharmacol. 2004;95:83–85. doi: 10.1016/j.jep.2004.06.020. [DOI] [PubMed] [Google Scholar]
- Perry LM, Metzger J. Medicinal plants of east and south East Asia: attributed properties and uses. Cambridge: Mass. and London Press; 1980. p. 620. [Google Scholar]
- Rani P, Khullar N. Antimicrobial evaluation of some medicinal plants for their anti-enteric potential against multi-drug resistant Salmonella typhi. Phytother Res. 2004;18:670–673. doi: 10.1002/ptr.1522. [DOI] [PubMed] [Google Scholar]
- Sharma SK, Perianayagam JB, Joseph A et al. (2003) Anti-inflammatory activity of ethanol and aqueous extracts of Emblica officinalis Gaertn fruits. Hamdard Medicus XLVI, 71–73
- Singh BN, Sharma PV. Effect of Amalaki on amlapitta. J Res Ind Med. 1971;5:223–229. [Google Scholar]
- Sood S, Arora B, Bansal S, et al. Antioxidant, anti-inflammatory and analgesic potential of the Citrus decumana L. peel extract. Inflammopharmacol. 2009;17:267–274. doi: 10.1007/s10787-009-0015-y. [DOI] [PubMed] [Google Scholar]
- Subba Rao MVSST, Murlikrishna G. Evaluation of the antioxidant properties of free and bound phenolic acid from native and malted finger millet (Ragi, Eleusine coracana Indaf-15) J Agric Food Chem. 2002;50:889–892. doi: 10.1021/jf011210d. [DOI] [PubMed] [Google Scholar]
- Suleyman H, Mshvildadze V, Gepdiremen A, Elias R, et al. Acute and chronic antiinflammatory profile of the ivy plant, Hedera helix, in rats. Phytomedicine. 2003;10:370–374. doi: 10.1078/0944-7113-00260. [DOI] [PubMed] [Google Scholar]
- Suresh Kumar G, Nayaka Harish, Dharmesh SM, et al. Free and bound phenolic antioxidants in amla (Emblica officinalis) and turmeric (Curcuma longa) J Food Comp Anal. 2006;19:446–452. doi: 10.1016/j.jfca.2005.12.015. [DOI] [Google Scholar]
- Tsuji RF, Hoshino K, Noro Y. Suppression of allergic reaction by λ-carrageenan: toll-like receptor 4/MyD88-dependent and-independent modulation of immunity. Clin Exp Allergy. 2003;33:249–258. doi: 10.1046/j.1365-2222.2003.01575.x. [DOI] [PubMed] [Google Scholar]
- Vinson JA, Hao Y, Su X, et al. Phenol antioxidant quantity and quality in foods: vegetables. J Agric Food Chem. 1998;46:3630–3634. doi: 10.1021/jf980295o. [DOI] [Google Scholar]
- Winter CA, Porter CC. Effect of alterations in the side chain upon anti-inflammatory and liver glycogen activities of hydrocortisone esters. J Am Pharm Assoc Sci Educ. 1957;46:515–519. doi: 10.1002/jps.3030460902. [DOI] [PubMed] [Google Scholar]
- Woolf CJ, Costigan M. Transcriptional and posttranslational plasticity and the generation of inflammatory pain. Proc Natl Acad Sci USA. 1999;96:7723–7730. doi: 10.1073/pnas.96.14.7723. [DOI] [PMC free article] [PubMed] [Google Scholar]
- Zhang YJ, Tanaka T, Iwamoto Y, et al. Novel norsesquiterpenoids from the roots of Phyllanthus emblica. J Nat Prod. 2000;63:1507–1510. doi: 10.1021/np000135i. [DOI] [PubMed] [Google Scholar]
- Zheng J, Wu LJ, Zheng L. Two new monoterpenoid glycosides from Mentha spicata L. J Asian Nat Prod Res. 2003;5:69–73. doi: 10.1080/1028602031000080496. [DOI] [PubMed] [Google Scholar]