Abstract
Metformin is in widespread clinical use for the treatment of diabetes mellitus in patients. It has been shown to inhibit mitochondrial bioenergetic functions by inhibiting complex I of the electron transport chain. The expression of mitochondrial-specific molecular stress protein Hsp60 is a key consequence of mitochondrial impairment. Since this protein has important immune-modulatory properties, we have investigated the expression of Hsp60 in human THP-1 monocyte cells exposed to metformin. In this study, we demonstrate significant up-regulation of Hsp60 at both mRNA and protein levels when these cells were exposed to metformin at therapeutic dosage levels. Interestingly, there was also an increase in expression of CD14 mRNA in these cells. This suggested a possible modulation of the differentiation rates of the THP-1 cells during exposure to metformin. As monocyte differentiation marks a critical step in atherosclerosis, these observations suggest that long-term exposure to metformin could have important implications for the diabetic patient.
Keywords: Metformin, Hsp60, THP-1 monocyte cells, CD14
Introduction
Metformin (N-1,1-dimethylbiguanide) is an insulin sensitizer which acts as an anti-hyperglycaemic agent used in the treatment of newly diagnosed type 2 diabetes mellitus patients. However, despite its widespread clinical use the exact mode of action is still not known. A variety of possible mechanisms have been suggested to explain its ability to decrease fasting plasma glucose levels by 25–30% including phosphorylation of insulin receptor and insulin receptor substrate-2, inhibiting key enzymes in the gluconeogenic pathway, activation of pyruvate kinase, inhibition of hepatic glucagon effects and reduction in hepatic uptake of glucogenic substrates (lactate, alanine) (Goodarzi and Bryer-Ash 2005). Interestingly, there is also accumulating data in support of mitochondria being metformin’s primary site of action. Metformin has been shown to affect complex I of the mitochondrial respiratory chain (Brunmair et al. 2004; Guigas et al. 2004; Owen et al. 2000). Mitochondrial complex I is also one of the main sites at which reactive oxygen species can be generated (Brownlee 2001; Nishikawa et al. 2000). Metformin has also been reported to increase H2O2 production in rat liver mitochondria and exacerbated Ca2+-induced mitochondrial permeability pore opening in a concentration-dependent manner (Carvalho et al. 2008). Moreover, metformin in cultured glioma cells has been shown to cause mitochondrial depolarization and oxidative stress-dependent apoptosis (Isakovic et al. 2007). Collectively, these observations suggest that a key cellular effect of metformin could be the general impairment of mitochondrial bioenergetic functions.
An important cellular consequence of mitochondrial bioenergetic impairment is the up-regulation of the expression levels of mitochondrial-specific molecular stress protein Hsp60 (Martinus et al. 1996). This protein is increasingly being implicated to play a key role as a powerful immunogen and immunomodulator in experimental models of arthritis, diabetes (type 1) and atheroscelerosis (Shamaei-Tousi et al. 2007).
Since monocyte cells are able to elicit innate immune responses and play important roles in the pathogenesis of atherosclerosis, a human monocyte cell line (THP-1 cells) was used in this study to see if metformin at therapeutic levels was indeed able to modulate the expression of mitochondrial Hsp60. And to see if any changes in the levels of Hsp60 had functional consequences for these monocytic cells.
Materials and methods
Cell culture
Human acute monocytic leukaemia cell line (THP-1) was purchased from the American Tissue Culture Collection (no. TIB-202). These cells were cultured in THP-1 media containing RPMI Media 1640 (Gibco) supplemented with 10% foetal bovine serum (FBS), 1 mM pyruvate, and 1× penicillin/streptomycin. Cells were grown at 37°C, 5% CO2 in a humidified incubator. All experiments were carried out using near-confluent cells which had been passaged 2 days prior to the experiments.
Differentiating THP-1 cells
Phorbol 12-myristate 13-acetate (PMA) (Sigma) was used to stimulate differentiation of monocyte cells into macrophages. Using 24-well plates, near-confluent THP-1 cells were cultured in metformin-containing media (0, 100 μM) and treated with 50 nM PMA for 2–3 days or until cells showed macrophage characteristics under the microscope.
LDH assay
Lactate dehydrogenase (LDH) is a cytosolic enzyme which is released into the media by dead cells. The Promega CytoTox96 NonRadioactive Cytotoxicity Assay kit was used to determine LDH content according to the manufacturer’s instructions. The assay was ended by the addition of stop solution and the resulting coloured mixture was read at 490 nm on a microplate reader (Bio-Rad). The data is presented as a percentage and can be interpreted as the percentage of dead cells present in the original culture, assuming that each dead cell released an equal amount of LDH content.
MTT assay
The conversion of the tetrazolium salt redox dye, 3-(4,5-dimethylthiazol-2-yl)-2,5-diphenyltetrazolium bromide (MTT), into a formazan product was used as an assay for mitochondrial dehydrogenase activity. After exposure of THP-1 cells to various concentrations of metformin, the MTT reduction was determined colorimetrically at 570 and 655 nm using the Sigma MTT-based In vitro Toxicology Assay Kit according to the manufacturer’s protocol.
Protein extraction and Western blot analysis
The extraction of cellular protein, SDS-PAGE and Western blot analysis was carried out as essentially described in Martinus et al. (1996). Briefly, total protein was extracted using TENT buffer (50 mM Tris, 250 mM NaCl, 5 mM EDTA, 1% Triton X-100 and freshly supplemented 0.4 mM phenylmethylsulfonyl fluoride). Protein concentration was estimated using the BCA Protein Assay Kit (Pierce) and 15 μg total protein was separated by SDS-PAGE. Proteins were then transferred to a nitrocellulose membrane (Bio-Rad) and probed with Ponceau S staining to ensure that there was equal loading of proteins across all lanes prior to the Western blotting analysis. After blocking with 10% skim milk, the membrane was incubated with polyclonal rabbit anti-Hsp60 (Stressgen SPA805) followed by peroxidase-conjugated goat anti-rabbit IgG (Sigma). The membrane was incubated with SuperSignal West Pico Chemiluminescent Substrate (Pierce) and the Hsp60 protein band visualised through LAS-1000 Plus Gel Documentations System (Fujifilm). The intensity of the bands was analysed using the Gel Quant software.
Hsp60 and CD14 mRNA expression
To quantify the Hsp60 and CD14 mRNA expression in the THP-1 cells, total RNA was extracted using TRIzol (Invitrogen) according to the manufacturer’s protocol. RNA integrity was checked either by 260/280 nm ratio by Nanodrop ND-1000 spectrophotometer (Nanodrop) or discernable rRNA bands on an 1% agarose gel buffered in TBE.
DNase I treatment and semi quantitative PCR
RNA samples were treated with amplification grade DNase I (Roche) before cDNA synthesis to remove any contaminating genomic DNA. cDNA template was synthesised using the Roche two-step RT-PCR kit following the manufacturer’s protocol. PCR amplification was carried out using FastStart Taq Polymerase (Roche). Each PCR reaction contained 1 μL cDNA, 1× PCR buffer (MgCl2), 0.2 mM dNTP, 0.1 μM forward and reverse primers (Invitrogen), 0.2 μL FastStart Taq Polymerase and the volume was made up to 25 μL with PCR water. Each PCR run included a negative control containing 1 μL PCR water instead of cDNA. The thermocycling conditions for Hsp60 Cd14 and Gapdh (the house keeping gene) were as follows: Hsp60, denaturation at 95°C for 1 min, annealing at 55°C for 1 min, extension at 72°C for 1 min; Cd14, denaturation at 95°C for 1 min, annealing at 52°C for 30 s, extension at 72°C for 30 s; Gapdh, denaturation at 95°C for 1 min, annealing at 60°C for 1 min, extension at 72°C for 1 min. The primer sequences used for Hsp60 was forward: TTC GAT GCA TTC CAG CTT G and reverse: TTG GGC TTC CTG TCA CAG TT, for Cd14 was forward: CTG CAA CTT CTC CGA ACC TC and reverse: CCA GTA GCT GAG CAG GAA CC, for Gapdh was forward: ACC ACA GTC CAT GCC ATC AC and reverse: TCC ACC ACC CTG TTG CTG TA.
The number of cycles that lied within the linear amplification range was used to quantitate the gene of interest by normalising to Gapdh expression levels. The PCR products were run, along with a DNA ladder, on a 1% agarose gel stained with EtBr and buffered in 1× TAE. The intensity of the bands was analysed using the Gel Quant software (DNR Bio-Imaging Systems).
Statistical analysis
All statistical analysis in this study was carried out using Microsoft Excel. Data were averaged when appropriate and standard error of the mean (S.E.M.) was calculated in Excel. A two-tailed student’s t test was carried out to determine the significance of the data. The accepted level of significance was p < 0.05, which was denoted as “*”, whereas p < 0.01 was denoted as “#” throughout this study.
Results and discussion
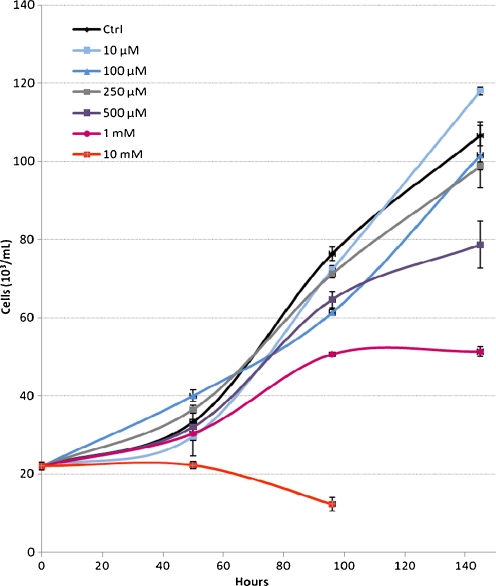
Under the growth conditions used in this study, the THP-1 monocyte cells had a doubling time of 48 h. Cells exposed to metformin at 100 and 250 μM showed a slightly reduced growth rate compared with control cells and those exposed to 500 μM and 1 mM had 74% and 48% of the control cell numbers, respectively. At levels of 10 mM metformin was cytotoxic to the cells and they were unable to multiply and were no longer viable after 2 days (Fig. 1). At these high metformin levels, we also observed a marked acidification of the growth media (data not shown). This was possibly due to a buildup of lactate, a consequence of these cells relying on glycolysis to compensate for reduced ATP production via oxidative phosphorylation (Martinus et al. 1993). The metformin toxicity profile seen in this study was comparable to those reported using primary human hepatocytes and HepG2 cells (Dykens et al. 2008).
Fig. 1.
Growth rate of THP-1 cells in the presence of varying concentration of metformin. Error bars show S.E.M. from three independent experiments
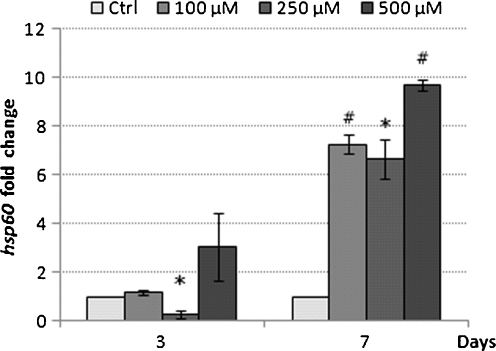
Since metformin has been documented to inhibit complex I of the mitochondrial respiratory chain, we investigated to see if THP-1 cells exposed to metformin at therapeutically relevant levels of 100, 250 and 500 μM led to modulation of the mitochondrial-specific stress protein Hsp60. After 3 days of exposure to metformin at 100, 250 and 500 μM, there was no significant differences in the expression of Hsp60 mRNA levels between treated and control THP-1 cells. However, after 7 days of incubation there was an increase in Hsp60 mRNA at all concentrations of metformin compared with untreated control THP-1 cells (Fig. 2). Hsp60 mRNA had a 7.27 ± 0.40-, 6.67 ± 0.82-, and 9.68 ± 0.23-fold increase in the 100, 250 and 500 μM groups, respectively (Fig. 2). The growth rate for THP-1 cells exposed to metformin for 7 days at the various concentrations was similar to the initial growth rates shown in Fig. 1. Metformin was not therefore having a cumulative effect on these cultured cells during the longer incubation period (data not shown).
Fig. 2.
Hsp60 mRNA expression in response to metformin. The THP-1 cells were treated for 3 and 7 days. Bar graphs represent mean ± S.E.M. from three independent experiments * p < 0.05 and #p < 0.01
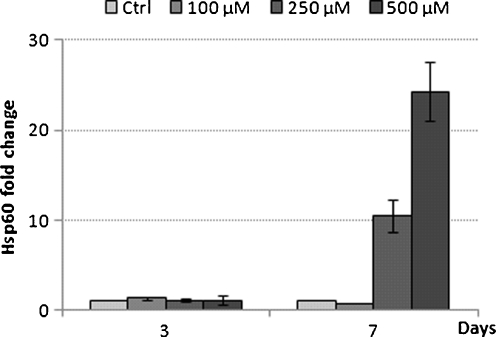
In order see if this increase in expression of Hsp60 mRNA translated to an increase also at the protein level, Western blot analysis was carried out on proteins extracted from THP-1 cells exposed to various metformin concentrations over the 3- and 7-day exposure experiments. At 3 days, there was no significant change in expression of Hsp60 protein levels at 100 and 250 μM metformin. There was however a 1.62-fold increase in Hsp60 protein level at 500 μM metformin (Fig. 3). In contrast, after 7 days of exposure to metformin at 250 and 500 μM, there was an 11- and 26-fold increase in Hsp60 protein levels respectively (Fig. 3).
Fig. 3.
Hsp60 protein expression in response to metformin exposure. The THP-1 cells were treated for 3 and 7 days. Bar graphs represent mean ± S.E.M. from two independent experiments
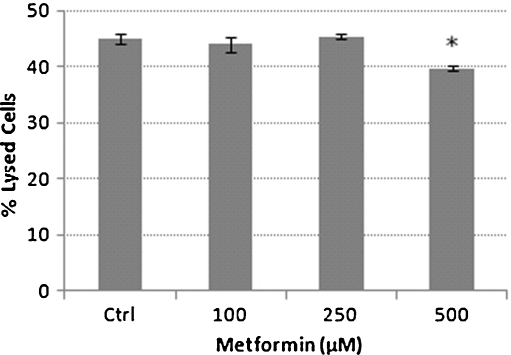
The release of lactate dehydrogenase into the growth media (LDH assay) was used to determine the cytotoxicity of metformin. The untreated control THP-1 cells had 45% of lysed cells and were not significantly different to cells exposed to 100 and 250 μM metformin which had 44% and 45% of lysed cells, respectively (Fig. 4). However, exposure to 500 μM metformin resulted in a significantly reduced (P < 0.05) percentage of lysed cells compared with the untreated control THP-1 cells (Fig. 4). The LDH data suggest that the increase in expression of Hsp60 observed at both mRNA and protein levels were not due to cellular lysis and that the growth inhibitory effects of 500 μM metformin was not due to cell death but possibly due to metformin having an inhibitory effect on mitochondrial bionenergetic functions. Interestingly, metformin has been documented to prevent cell death by modulation of the mitochondrial permeability transition pore opening induced by a glutathione-oxidising agent t-butyl hydroperoxide (Guigas et al. 2004) and also due to high glucose-induced cell death in a human dermal microvascular endothelial cell line, HMEC-1 (Detaille et al. 2005). However, reports of metformin treatment resulting in an increase in H2O2 production in rat liver mitochondria (Carvalho et al. 2008), a short-term trial involving 15 type 2 diabetes mellitus patients treated with metformin showing an elevation in oxidative stress, indicated by elevated malidialdehyde levels (Škrha et al. 2007) and metformin causing mitochondrial depolarization and oxidative stress-dependent apoptosis in cultured glioma cells (Isakovic et al. 2007), suggest that the role of mitochondria in metformin-induced cytotoxicity remains to be of defined.
Fig. 4.
Percentage of lysed cells in the presence of metformin. Bar graph showing means ± S. E.M. from three independent experiments*p < 0.05
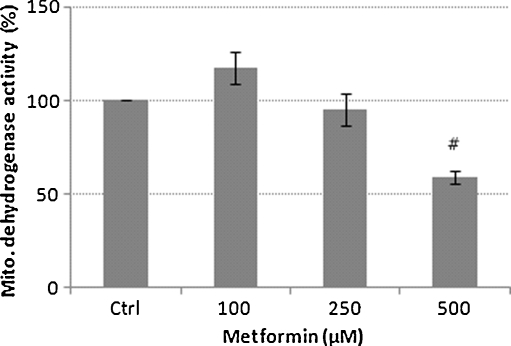
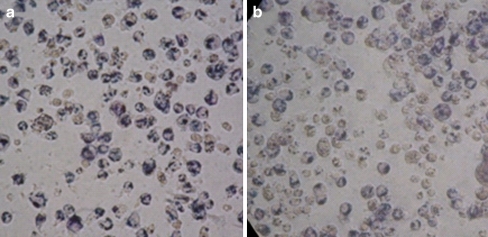
The MTT assay indicated a significant (P < 0.01) 41% inhibition of mitochondrial dehydrogenase activity at 500 μM metformin compared to untreated control THP-1 cells (Fig. 5). In order to minimise the extramitochondrial reduction of the formazan dye, the assay was stopped as soon as the formazan crystals were observed under a light microscope (Fig. 6). These results are comparable to earlier observations which documented the inhibition of 53% of respiration in human carcinoma-derived KB cells after exposure to 10 mM metformin (Guigas et al. 2004).
Fig. 5.
Mitochondrial dehydrogenase activity. Bar graph showing means ± S.E.M. from three independent experiments #p < 0.01
Fig. 6.
Phase contrast micropgraphs showing THP-1 monocytes stained with blue formazan deposits intracellular after 30-min incubation. a Ctrl control, b 500 μM metformin. Maginification ×400
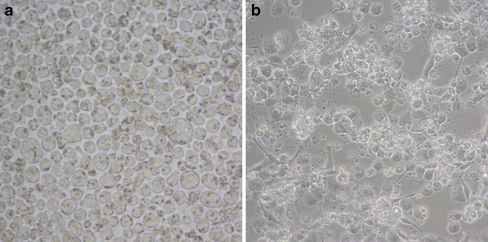
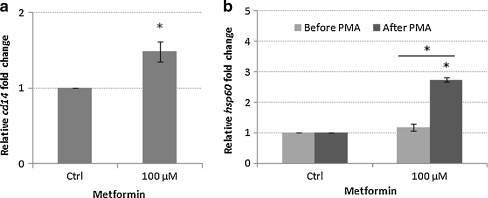
In order to see if the up-regulation of Hsp60 in THP-1 cells as a consequence of exposure to metformin had any functional significance to these monocyte cells, we investigated the effect of metformin on the differentiation of the THP-1 cells. Differentiation of the THP-1 monocyte cells was achieved by phorbol 12-myristate 13-acetate (PMA). After 48 h of exposure to PMA, cells exhibited characteristic morphology of macrophages such as adhesion and spreading (Fig. 7). When cells were differentiated in the presence of 100 μM metformin, they showed a significant (p < 0.05) 1.48-fold increase in the expression of CD14 mRNA compared to control cells (Fig. 8). CD14 is a specific surface receptor known to be expressed on macrophages (Tuomisto et al. 2005). The expression of CD14 at the protein level has yet to be established. We suggest the possibility that monocyte cells exposed to metformin could result in a modulation of the differentiation of these cells. Interestingly, there was also a significant elevation in the levels of Hsp 60 mRNA after differentiation (P < 0.05; Fig. 8). The precise reason for the up-regulation of Hsp60 mRNA after differentiation of the THP-1 cells is not yet known. Interestingly, we have also observed a higher level of Hsp60 mRNA in primary monocytes isolated from T2DM patients being treated with metformin compared to patients on no-medication and non-diabetic control subjects (data not shown). High circulating levels of Hsp60 has been documented in a number of studies in patients with diabetes mellitus (Imatoh et al. 2009; Shamaei-Tousi et al. 2006). The source of the serum Hsp60 is not yet known. It is tempting to speculate that mitochondrially stressed monocytes could be a potential source of serum Hsp60. We suggest that the elevated Hsp60 at mRNA and protein levels could be a reflection of the influx of newly synthesised proteins due to the transition from monocyte to macrophage phenotypes, an increased requirement for cytoprotection due to oxidative damage associated with macrophage respiratory bust, and/or a cellular stress condition caused by metformin treatment. Interestingly, the transcriptional activation of Hsp60, Hsp70 and HSp90 has been documented in peritoneal macrophages induced by colony-stimulating factor (Teshima et al. 1996). The transcription of these genes coincided with O2- production by macrophages stimulated with PMA indicated that heat shock proteins may play a protective role against harmful oxidative damage associated with the respiratory burst (Teshima et al. 1996).
Fig. 7.
Phase contrast micrographs showing THP-1 monocytes (a) and PMA-treated THP-1 cells showing macrophage morphologies (b). Magnification ×400
Fig. 8.
Expression of CD14 and Hsp60 mRNA in metformin treated THP-1 derived macrophages. Bar graphs show means ± S.E.M. from three independent experiments *p < 0.05; #p < 0.01
In conclusion, we demonstrate for the first time that THP-1 monocyte cells exposed to metformin at the therapeutic range expressed higher levels of Hsp60 at both mRNA and protein levels. Since monocyte activation and recruitment and subsequent differentiation into macrophages are critical steps in the development of atherosclerosis (Libby et al. 2002; Ludewig and Laman 2004), further investigation of the role of metformin induced modulation of Hsp60 and CD14 could have important implications for type 2 diabetes mellitus patients being treated long-term with metformin.
References
- Brownlee M. Biochemistry and molecular cell biology of diabetic complications. Nature. 2001;414:813–820. doi: 10.1038/414813a. [DOI] [PubMed] [Google Scholar]
- Brunmair B, Staniek K, Gras F, Scharf N, Althaym A, Clara R, Roden M, Gnaiger E, Nohl H, Waldhausl W, Furnsinn C. Thiazolidinediones, like metformin, inhibit respiratory complex I—a common mechanism contributing to their antidiabetic actions? Diabetes. 2004;53:1052–1059. doi: 10.2337/diabetes.53.4.1052. [DOI] [PubMed] [Google Scholar]
- Carvalho C, Correia S, Santos M, Seiça R, Oliveira C, Moreira P. Metformin promotes isolated rat liver mitochondria impairment. Mol Cell Biochem. 2008;308:75–83. doi: 10.1007/s11010-007-9614-3. [DOI] [PubMed] [Google Scholar]
- Detaille D, Guigas B, Chauvin C, Batandier C, Fontaine E, Wiernsperger N, Leverve X. Metformin prevents high-glucose-induced endothelial cell death through a mitochondrial permeability transition-dependent process. Diabetes. 2005;54:2179–2187. doi: 10.2337/diabetes.54.7.2179. [DOI] [PubMed] [Google Scholar]
- Dykens JA, Jamieson J, Marroquin L, Nadanaciva S, Billis PA, Will Y. Biguanide-induced mitochondrial dysfunction yields increased lactate production and cytotoxicity of aerobically-poised HepG2 cells and human hepatocytes in vitro. Toxicol Appl Pharmacol. 2008;233:203–210. doi: 10.1016/j.taap.2008.08.013. [DOI] [PubMed] [Google Scholar]
- Goodarzi MO, Bryer-Ash M. Metformin revisited: re-evaluation of its properties and role in the pharmacopoeia of modern antidiabetic agents. Diabetes Obes Metabol. 2005;7:654–665. doi: 10.1111/j.1463-1326.2004.00448.x. [DOI] [PubMed] [Google Scholar]
- Guigas B, Detaille D, Chauvin C, Batandier C, Oliveira F, Fontaine E, Leverve X. Metformin inhibits mitochondrial permeability transition and cell death: a pharmacological in vitro study. Biochem J. 2004;382:877–884. doi: 10.1042/BJ20040885. [DOI] [PMC free article] [PubMed] [Google Scholar]
- Imatoh T, Sugie T, Miyazaki M, Tanihara S, Baba M, Momose Y, Uryu Y, Une H. Is heat shock protein 60 associated with type 2 diabetes mellitus? Diabetes Res Clin Pract. 2009;85:208–212. doi: 10.1016/j.diabres.2009.06.004. [DOI] [PubMed] [Google Scholar]
- Isakovic A, Harhaji L, Stevanovic D, Markovic Z, Sumarac-Dumanovic M, Starcevic V, Micic D, Trajkovic V. Dual antiglioma action of metformin: cell cycle arrest and mitochondria-dependent apoptosis. Cell Molecul Life Sci. 2007;64:1290–1302. doi: 10.1007/s00018-007-7080-4. [DOI] [PMC free article] [PubMed] [Google Scholar]
- Libby P, Ridker PM, Maseri A. Inflammation and atherosclerosis. Circulation. 2002;105:1135–1143. doi: 10.1161/hc0902.104353. [DOI] [PubMed] [Google Scholar]
- Ludewig B, Laman JD. The in and out of monocytes in atherosclerotic plaques: balancing inflammation through migration. Proc Natl Acad Sci USA. 2004;101:11529–11530. doi: 10.1073/pnas.0404612101. [DOI] [PMC free article] [PubMed] [Google Scholar]
- Martinus RD, Linnane AW, Nagley P. Growth of rho 0 human Namalwa cells lacking oxidative phosphorylation can be sustained by redox compounds potassium ferricyanide or coenzyme Q10 putatively acting through the plasma membrane oxidase. Biochem Mol Biol Int. 1993;31(6):997–1005. [PubMed] [Google Scholar]
- Martinus RD, Garth GP, Webster TL, Cartwright P, Naylor DJ, Høj PB, Hoogenraad NJ. Selective induction of mitochondrial chaperones in response to loss of the mitochondrial genome. Eur J Biochem. 1996;240:98–103. doi: 10.1111/j.1432-1033.1996.0098h.x. [DOI] [PubMed] [Google Scholar]
- Nishikawa T, Edelstein D, Du XL, Yamagishi S, Matsumura T, Kaneda Y, Yorek MA, Beebe D, Oates PJ, Hammes HP, Giardino I, Brownlee M. Normalizing mitochondrial superoxide production blocks three pathways of hyperglycaemic damage. Nature. 2000;404:787–790. doi: 10.1038/35008121. [DOI] [PubMed] [Google Scholar]
- Owen MR, Doran E, Halestrap AP. Evidence that metformin exerts its anti-diabetic effects through inhibition of complex 1 of the mitochondrial respiratory chain. Biochem J. 2000;348:607–614. doi: 10.1042/0264-6021:3480607. [DOI] [PMC free article] [PubMed] [Google Scholar]
- Shamaei-Tousi A, Stephens JW, Bin R, Cooper JA, Steptoe A, Coates ARM, Henderson B, Humphries SE. Association between plasma levels of heat shock protein 60 and cardiovascular disease in patients with diabetes mellitus. Eur Heart J. 2006;27:1565–1570. doi: 10.1093/eurheartj/ehl081. [DOI] [PubMed] [Google Scholar]
- Shamaei-Tousi A, Halcox JP, Henderson B. Stressing the obvious? Cell stress and cell stress proteins in cardiovascular disease. Cardiovasc Res. 2007;74:19–28. doi: 10.1016/j.cardiores.2006.10.025. [DOI] [PubMed] [Google Scholar]
- Škrha J, Prázný M, Hilgertová J, Kvasnička J, Kalousová M, Zima T. Oxidative stress and endothelium influenced by metformin in type 2 diabetes mellitus. Eur J Clin Pharmacol. 2007;63:1107–1114. doi: 10.1007/s00228-007-0378-1. [DOI] [PubMed] [Google Scholar]
- Teshima S, Rokutan K, Takahashi M, Nikawa T, Kishi K. Induction of heat shock proteins and their possible roles in macrophages during activation by macrophage colony-stimulating factor. Biochem J. 1996;315:497–504. doi: 10.1042/bj3150497. [DOI] [PMC free article] [PubMed] [Google Scholar]
- Tuomisto TT, Riekkinen MS, Viita H, Levonen A-L, Ylä-Herttuala S. Analysis of gene and protein expression during monocyte–macrophage differentiation and cholesterol loading–cDNA and protein array study. Atherosclerosis. 2005;180:283–291. doi: 10.1016/j.atherosclerosis.2004.12.023. [DOI] [PubMed] [Google Scholar]


