This paper provides novel data on the prevalence of overweight/obesity and undernutrition in cancer patients and shows that there is a likely relation among nutritional status, disease aggressiveness, and consequent association with prognosis.
Keywords: Cancer, Histological aggressiveness, Nutritional status, Body mass index, Patient-Generated Subjective Global Assessment
Learning Objectives
After completing this course, the reader will be able to:
Explain how malnutrition (deficit or excess) is used as a decisive factor in treatment of cancer patients.
Describe the interactions and influences of overweight/obesity on tumor metabolism and of individualized tumor metabolism on tumor burden and undernutrition.
Use the association of sarcopenic obesity to predict and manage poorer performance status and decreased survival in cancer patients.
This article is available for continuing medical education credit at CME.TheOncologist.com
Abstract
Objective.
Nutritional status in cancer has been mostly biased toward undernutrition, an issue now in dispute. We aimed to characterize nutrition status, to analyze associations between nutritional and clinical/cancer-related variables, and to quantify the relative weights of nutritional and cancer-related features.
Methods.
The cross-sectional study included 450 nonselected cancer patients (ages 18–95 years) at referral for radiotherapy. Nutritional status assessment included recent weight changes, body mass index (BMI) categorized by World Health Organization's age/sex criteria, and Patient-Generated Subjective Global Assessment (PG-SGA; validated/specific for oncology).
Results.
BMI identified 63% as ≥25 kg/m2 (43% overweight, 20% obese) and 4% as undernourished. PG-SGA identified 29% as undernourished and 71% as well nourished. Crossing both methods, among the 319 (71%) well-nourished patients according to PG-SGA, 75% were overweight/obese and only 25% were well nourished according to BMI. Concordance between BMI and PG-SGA was evaluated and consistency was confirmed. More aggressive/advanced stage cancers were more prevalent in deficient and excessive nutritional status: in 83% (n = 235/282) of overweight/obese patients by BMI and in 85% (n = 111/131) of undernourished patients by PG-SGA. Results required adjustment for diagnoses: greater histological aggressiveness was found in overweight/obese prostate and breast cancer; undernutrition was associated with aggressive lung, colorectal, head-neck, stomach, and esophageal cancers (p < .005). Estimates of effect size revealed that overweight/obesity was associated with advanced stage (24%), aggressive breast (10%), and prostate (9%) cancers, whereas undernutrition was associated with more aggressive lung (6%), colorectal (6%), and head-neck (6%) cancers; in both instances, age and longer disease duration were of significance.
Conclusion.
Undernutrition and overweight/obesity have distinct implications and bear a negative prognosis in cancer. This study provides novel data on the prevalence of overweight/obesity and undernutrition in cancer patients and their potential role in cancer histological behavior.
Introduction
Cancer is a major source of morbidity and the second most common cause of mortality worldwide [1, 2]; the American Cancer Society estimates that in 2010 neoplastic diseases will become the leading cause of death, outrunning cardiovascular diseases [3].
Nutrition in cancer is now a topic of acknowledged significance [4–10]. Traditionally, undernutrition has dictated clinical concerns, although the evidence indicated that 8% to 84% of the patients would suffer from undernutrition throughout the disease course [4, 11, 12]. A clarification of that wide interval was overlooked; nonetheless, recent evidence draws our attention to the increase of excess body weight and obesity in oncology. Robust findings, from recent epidemiological studies, show that obese subjects have higher rates of some forms of cancer [10]. Moreover, once the disease is installed, obese patients have a significantly reduced survival compared with those of adequate weight [13], and obesity has been consistently associated with cancer recurrence after antineoplastic treatments and/or surgery [14–16]. In addition, of acknowledgeable relevance is the fact that cancer patients who are of normal weight, overweight, or obese are likely to have depleted muscle mass; this clinical condition has been associated with poorer performance status and decreased survival [17, 18].
Within this framework, this cross-sectional study conducted in adult patients with a diverse range of cancers was designed to (a) characterize the pattern of nutritional status and the distribution of nutritional status categories using widespread clinical methods of nutritional assessment; (b) analyze potential associations between nutritional status and clinical and/or cancer-related variables; and (c) quantify the relative impact of cancer-related characteristics on patients' nutritional status.
Materials and Methods
Study Design and Patient Sample
This cross-sectional study was approved by the University Hospital Ethics Committee and conducted in accordance with the Helsinki Declaration, adopted by the World Medical Association in 1964, amended in 1975, revised in 1983, and updated in 2002. Consecutive ambulatory patients with diverse cancers referred between March 2008 and January 2009 to the outpatient Radiotherapy Department of the University Hospital of Santa Maria were potentially eligible. Exclusion criteria comprised rare tumors [19] and uncooperative patients unable to answer questions or who could not be weighed. All patients gave their written informed consent to participate in the study. The administered radiotherapy (RT) was primary, adjuvant to surgery, combined with chemotherapy, or palliative in intent.
For this study, data were recorded in individual forms preconstructed for statistical analysis. For every patient, before RT planning the medical staff registered the following: clinical variables, recent medications and chemotherapy, duration of the disease (the majority, 31%, was diagnosed in the decade of 60–69 years), cancer location, presence of distant metastases, tumor burden according to TNM classification of malignant tumors [20, 21] as determined by local and whole-body imaging methods, and cancer histology [22]. The duration of the histologically proven disease was defined as the length of time (in months) between compatible symptomatic manifestations and study entry. Tumor histological aggressiveness was classified according to cell differentiation: 1 = well differentiated, 2 = moderately differentiated, and 3 = poorly differentiated or undifferentiated [22]. For the study of potential associations and statistical analyses on differences in cancer histology and relations with clinical and/or nutritional parameters, patients were clinically grouped in 2 grades of cancer aggressiveness: grade 1 (low aggressiveness) versus grades 2+3 (high aggressiveness).
Nutritional Parameters
All measurements were taken in the morning from fasting patients who were shoeless and wearing lightweight clothing. At the onset of RT, nutritional status assessment was performed by trained research dietitians (C.C. and M.C.) as described. (a) Recent weight changes during the previous 6 months were documented. (b) Anthropometric data were collected. Weight was determined using a SECA floor scale with an incorporated stadiometer to measure height. Weight and height were then used to calculate body mass index (BMI; weight [kg]/height [m2]), which was further classified according to the World Health Organization's age- and sex-adjusted criteria as undernourished if <18.5 kg/m2, normal weight if 18.5 to 24.9 kg/m2, overweight if 25 to 29.9 kg/m2, and obese if ≥30 kg/m2 [23]. (c) Patient-Generated Subjective Global Assessment (PG-SGA) is a validated and specific nutritional assessment tool for oncology [24, 25] that addresses (i) percentage of weight loss in the previous 6 months, symptoms (anorexia, nausea, constipation, mucositis, vomiting, diarrhea, xerostomia, pain), alterations in food intake, and functional capacity; (ii) components of metabolic stress: sepsis, neutropenic or tumor fever, and corticosteroids, and (iii) physical examination: subcutaneous fat (triceps skinfold and in the midaxillary line at the lower ribs level), muscle bulk and tone in the temporal, deltoid, and quadriceps areas, ankle/sacral edema, or ascites. A value is given to each parameter whose total provides a score or category of nutritional status and an indication for individualized nutritional intervention and nutrition care plan. PG-SGA classifies the patients' nutritional status in three degrees: adequate, moderate undernutrition, or severe malnutrition [24].
Statistical Analysis
Statistical analysis was conducted using SPSS 14.0 (SPSS Inc, Chicago, IL). Patient age was expressed as number and percentage, median and SD; cancer location, staging, histology, recent weight changes, functional ability, and nutritional status categories were expressed as number and/or percentage. BMI values were also expressed as a numerical variable as appropriate. Categorical variables were compared with the chi-square test. Bivariate correlations and Spearman correlation coefficient with 2-tailed test of significance assessed correlations. Mann-Whitney U test was used to evaluate associations between parameters of nutritional status and clinical variables. Between-group comparisons were performed by one-way analysis of variance for continuous variables, with Bonferroni or Dunn adjustment for multiple comparisons. A concordance analysis using the kappa coefficient was calculated to measure the rate of agreement between methods of nutritional status assessment. A multivariate general linear model was used to identify variables that could be significantly related to nutritional status. All associations and correlations were adjusted for potentially confounding variables (e.g., age, sex, and number of patients). Values of p ≤ .05 were considered statistically significant.
Results
Patient Characteristics
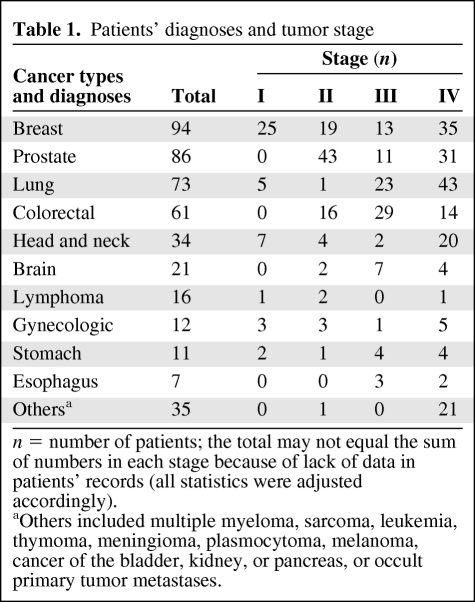
This study included 450 patients (269 males and 181 females) with a median age (± SD) of 62 ± 13 (range, 18–95) years. Table 1 shows patient diagnoses and tumor stages; breast cancer was the most prevalent (21%) followed by cancer of the prostate (19%) and lung (16%). Overall, stage IV was the most prevalent, in 44% of patients (p < .04); most were in an advanced stage (III/IV) versus stages I/II (p = .001).
Table 1.
Patients' diagnoses and tumor stage
n = number of patients; the total may not equal the sum of numbers in each stage because of lack of data in patients' records (all statistics were adjusted accordingly).
aOthers included multiple myeloma, sarcoma, leukemia, thymoma, meningioma, plasmocytoma, melanoma, cancer of the bladder, kidney, or pancreas, or occult primary tumor metastases.
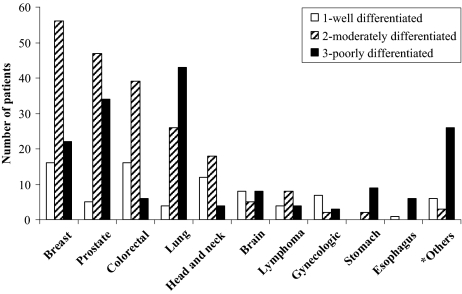
Regarding cancer aggressiveness, 83% (n = 371) of patients had aggressive tumors (histological grades 2+3). Aggressive histologies were found in all diagnoses, although more often in cancers of the breast, prostate, colon-rectum, lung, stomach, and the “others” group (p = .001), Figure 1.
Figure 1.
Cancer histology according to diagnoses. *Others included multiple myeloma, sarcoma, leukemia, thymoma, meningioma, plasmocytoma, melanoma, cancer of the bladder, kidney, or pancreas, or occult primary tumor metastases.
Nutritional Status
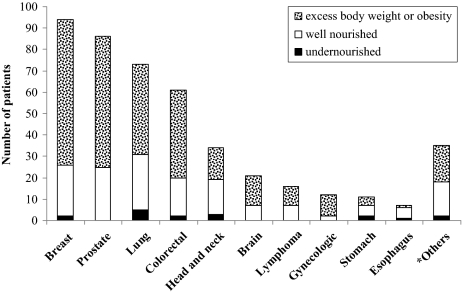
BMI allows the identification of malnutrition by excess; as a consequence the majority of the patients (n = 282, 63%) were classified as ≥25 kg/m2: 43% of whom had excess body weight and 20% of whom were obese. Undernutrition (BMI <18.5 kg/m2) was seldom observed (4%, n = 17), and 33% (n = 151) had an adequate nutritional status (Fig. 2).
Figure 2.
BMI nutritional status by diagnoses.
*Others included multiple myeloma, sarcoma, leukemia, thymoma, meningioma, plasmocytoma, melanoma, cancer of the bladder, kidney, or pancreas, or occult primary tumor metastases.
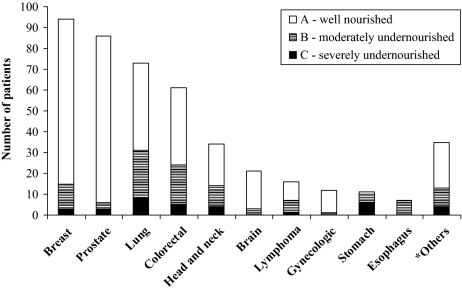
PG-SGA, validated in oncology to identify malnutrition by deficit, categorized 131 (29%) patients as moderately/severely undernourished, most of whom had lung or colorectal cancer; 319 (71%) patients were classified as well nourished (Figure 3). We then used BMI to classify the 319 PG-SGA well-nourished patients according to the PG-SGA: 75% (n = 238/319) of the PG-SGA well-nourished patients had excess body weight/obesity based on BMI and the remaining only 25% (n = 81) had an adequate nutritional status. A concordance analysis was performed to confirm consistency of evaluations by both methods: BMI and PG-SGA showed a significant agreement (kappa coefficient = 0.52, p < .01).
Figure 3.
PG-SGA nutritional status (A, B, or C) by diagnoses.
*Others included multiple myeloma, sarcoma, leukemia, thymoma, meningioma, plasmocytoma, melanoma, cancer of the bladder, kidney, or pancreas, or occult primary tumor metastases.
Overweight/Obesity Versus Undernutrition
The prevalence and/or relations between clinical/cancer variables and patients' nutritional status categorized by both methods were analyzed by multivariate correlation or association analyses, always adjusted for multiple potentially confounding factors.
Advanced stage (III/IV) was significantly more prevalent among overweight/obese patients according to BMI (97%; versus 69% of undernourished patients by PG-SGA; p < .003).
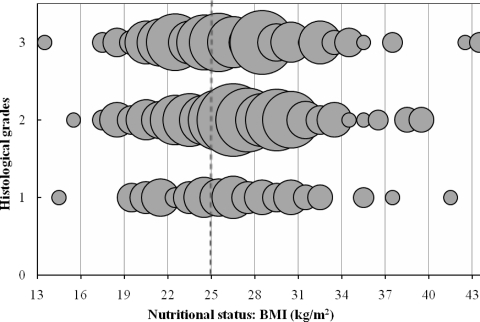
Figure 4 shows the distribution of patients according to BMI and cancer histological grades. The right upper third of the figure has a significantly higher density of patients because of the higher number of patients who accumulate both characteristics: excess body weight/obesity and more aggressive cancers (grades 2+3). Using multivariate analysis of variance adjusted for the number of patients in each histological grade, thus correcting for small groups, overweight/obese patients had more aggressive cancers versus low aggressive cancers (grade 1), p < .002; the latter were mostly observed in patients with an adequate BMI, p < .05.
Figure 4.
Patients' distribution according to BMI and cancer histological grades (1 = well differentiated; 2 = moderately differentiated; 3 = poorly differentiated);  = one patient.
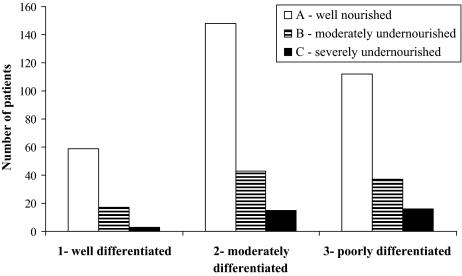
Figure 5 clarifies the distribution of patients when categorized by PG-SGA, thus emphasizing undernutrition, and its relation to histological aggressiveness.
Figure 5.
Patient nutritional status by the PG-SGA (A, B, or C) distributed according to histological grades (1 = well differentiated; 2 = moderately differentiated; 3 = poorly differentiated).
Using a multivariate analysis of variance adjusted for the number of patients in each histological grade group and in each category of PG-SGA nutritional status, thus correcting for small numbers, severe or moderately undernourished patients (n = 111) showed a higher prevalence of more aggressive cancers than well-nourished patients (n = 260), p < .05; just 4 severely undernourished patients had low aggressive (well-differentiated) cancers.
Therefore, more aggressive cancers were more prevalent in the two extremes of nutritional status, by deficit or excess: in 83% of the patients with overweight/obesity (n = 235/282) and in 85% of undernourished patients (n = 111/131). However, this apparent discrepancy needs to account for cancer location; data were thus further analyzed after correcting for the diagnoses. As a result, higher histological aggressiveness was found in overweight/obese patients with prostate and breast cancers, whereas the association between more aggressive cancers and undernutrition was significant for patients with cancers of the lung, colon-rectum, head-neck, stomach, or esophagus (p < .005). The remaining diagnoses could not be included in the analysis because of the small number of patients.
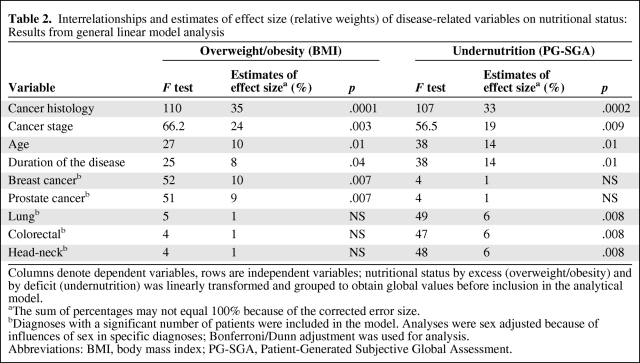
In addition, a general linear model that included nutritional status and disease-related variables was created to calculate the estimates of effect size and respective statistics; results are shown in Table 2. Higher histological aggressiveness, location, and advanced stage and duration of the cancer and older age were all significantly associated with overweight/obesity and undernutrition, but with different relative weights and differed according to diagnoses. Overweight/obesity was significantly associated with more aggressive breast and prostate cancers, whereas undernutrition was significantly associated with more aggressive cancers of the lung, colon-rectum, and head-neck. Moreover, age and longer duration of the disease contributed more significantly to undernutrition than to overweight or obesity (p < .007).
Table 2.
Interrelationships and estimates of effect size (relative weights) of disease-related variables on nutritional status: Results from general linear model analysis
Columns denote dependent variables, rows are independent variables; nutritional status by excess (overweight/obesity) and by deficit (undernutrition) was linearly transformed and grouped to obtain global values before inclusion in the analytical model.
aThe sum of percentages may not equal 100% because of the corrected error size.
bDiagnoses with a significant number of patients were included in the model. Analyses were sex adjusted because of influences of sex in specific diagnoses; Bonferroni/Dunn adjustment was used for analysis.
Abbreviations: BMI, body mass index; PG-SGA, Patient-Generated Subjective Global Assessment.
Of clinical relevance are patients' weight changes. Weight loss ≥5% in the previous 6 months was registered in 101 (33%) patients; 73 were undernourished by the PG-SGA, yet the remaining 28 patients, although classified as well nourished by PG-SGA, were overweight/obese according to BMI. Of note, all patients losing weight had more aggressive cancers of the colon-rectum, lung, head-neck, stomach, or esophagus. On the other hand, weight gain in the previous 6 months was registered in 117 patients, on average 7% ± 8% (range, 1%–60%). Among these, 21 were on hormonal therapy, the great majority had excess body weight/obesity (n = 85; 73%), and most had breast or prostate cancer.
Discussion
Besides the recognition of the multiplicity of nutritional status in cancer, this study provides novel detailed information about the prevalence of overweight/obesity in cancer; thus, the often reported assertion that 8% to 84% of the patients would suffer from undernutrition throughout the disease course [4, 11, 12] is now strengthened and clarified.
Until now, the majority of studies about nutritional status and cancer have focused on nutritional deficit/undernutrition because of its negative impact on treatment, recovery, hospital stay, prognosis, and quality of life [5–7, 26–28]. Notwithstanding, various studies continue to create a consistent body of evidence that shows that obesity in cancer may have serious negative impact in disease treatment, recurrence, prognosis, and survival [16, 29–36]. Currently, we clearly have opposite sides of the same coin. Furthermore, at present, excess body weight and obesity have a crescent incidence worldwide and have been identified as a major risk for cancer development [10, 15]; recent data show that the number of cancers attributed to excessive weight were 124,050 in 2008, and will likely to show an increase every year [37].
This cross-sectional study in 450 cancer patients with diverse diagnoses showed a high prevalence of an inadequate nutritional status. According to BMI and PG-SGA, malnutrition by excess was more prevalent than malnutrition by deficit, 63% and 29%, respectively. Those two methods complement one another: classification of excessive weight and therefore malnutrition by excess with BMI, whereas PG-SGA identifies the patients who are undernourished or at risk of undernutrition and the items that have the most impact on nutritional deterioration. Hence, in oncological clinical practice, an accurate nutritional status classification requires both methods to better characterize patients, establish priorities, and individualize care plans.
In addition, from a mechanistic and pathological perspective, this study provides novel evidence on potential interactions between patients' nutritional depletion or excessive fat and the cancer histological signature. Our results suggest that aggressive cancers (moderate and poorly differentiated) were more prevalent in patients with one or the other extreme of nutritional status: excess body weight/obesity and undernutrition. Furthermore, and in agreement with a previous study of our group in colorectal cancer [38], weight loss was significantly greater and undernutrition more prevalent in patients with moderately/poorly differentiated versus well-differentiated cancers. Similar results have been observed in patients with lung and head-neck cancer [4, 6, 7, 39–42]. Age and longer duration of the disease were shown to be contributing factors that significantly aggravated undernutrition.
In contrast, and in agreement with international evidence, in two recent papers we did show an alarming prevalence of excessive weight and fat mass among prostate and breast cancer patients [43, 44], data again substantiated by the present study. Moreover, our analysis using a complex general linear model constructed with nutritional and disease-related variables exposed that overweight/obesity was significantly associated only with more advanced, aggressive breast and prostate cancers; age and longer duration of the disease were also significant contributing factors for more aggressive tumors. Our results are in line with other data depicting the role of excessive weight on histological aggressiveness of breast and prostate cancers [33]. Obesity in men is associated with reduced testosterone, which may increase the risk of developing more aggressive tumors with higher risk of biochemical recurrence and of cancer-specific death after radiotherapy [33]; furthermore, obese men undergoing radical prostatectomy had higher-grade, more aggressive, and larger tumors [45, 46]. In breast cancer, body fat influences sex hormone–binding globulin availability known to increase free estradiol concentrations, then more available to enter cells [47, 48]. Obesity is recognized to increase cancer risk by modifying the production of sex and metabolic hormones also produced by adipose tissue [49, 50].
Although conscious of the limitations of our study, because it does not measure actual body composition, the degree of depletion, and/or excess of body compartments, our results do show that both undernutrition and overweight/obesity have very distinct implications and associations in cancer; the relevance of either one varies according to the diagnoses. Although BMI and PG-SGA are global assessment methods, thus potentially influenced by clinical parameters, both are easy to use in the clinical setting. They provide valuable information on the patients' global condition and both are validated and have been categorized according to the most appropriate standards.
Conclusion
Our results show that there is a likely relation among nutritional status, disease aggressiveness, and consequent association with prognosis. When addressing tumor-host interactions, each tumor may have a specific metabolic activity interacting with the host metabolism, in which body composition appears relevant. Based on our results, we can speculate that individualized tumor metabolism may dictate tumor burden and undernutrition [51], whereas overweight/obesity appears to influence tumor metabolism. These data become even more relevant when we acknowledge that patients identified as obese are highly likely to have depleted muscle mass, thus presenting sarcopenic obesity; this clinical condition, shown to be more likely in men ≥65 years old with colorectal cancers, was associated with poorer performance status and decreased survival. Lean body mass of these obese patients was comparable with very underweight or emaciated patients [17]. Another study in breast cancer showed that 25% of patients were sarcopenic, and this feature was seen in normal weight, overweight, and obese patients [18]. Malnutrition, whether by deficit or excess, and because of its major negative impact on treatment, prognosis, and quality of life, is always a decisive factor in the overall treatment of cancer patients.
Acknowledgments
This study was partially supported by a grant from the “Fundação para a Ciência e Tecnologia” (RUN 437).
We are indebted to the helpful medical, nursing, and technical staff of the Radiotherapy Department of the University Hospital of Santa Maria.
Author Contributions
Conception and design: Paula Ravasco
Provision of study material or patients: Mariana Ramos Chaves, Carolina Boléo-Tomé
Collection and/or assembly of data: Mariana Ramos Chaves, Carolina Boléo-Tomé
Data analysis and interpretation: Paula Ravasco, Isabel Monteiro-Grillo, Maria Camilo
Manuscript writing: Paula Ravasco, Mariana Ramos Chaves, Maria Camilo
Final approval of manuscript: Paula Ravasco, Isabel Monteiro-Grillo, Maria Camilo
References
- 1.Inagaki J, Rodriguez V, Bodey G. Causes of death in cancer patients. Cancer. 1974;33:568–573. doi: 10.1002/1097-0142(197402)33:2<568::aid-cncr2820330236>3.0.co;2-2. [DOI] [PubMed] [Google Scholar]
- 2.World Health Organization. Geneva: WHO; 2008. The Global Burden of Disease 2004 Update. [Google Scholar]
- 3.American Cancer Society. Cancer Projected To Become Leading Cause Of Death Worldwide In 2010. [Accessed July 9, 2009]. Available at http://www.sciencedaily.com/releases/2008/12/081209111516.htm.
- 4.Ravasco P, Monteiro Grillo I, Marques Vidal P, Camilo M. Nutritional deterioration in cancer: the role of disease and diet. Clin Oncol. 2003;15:443–450. doi: 10.1016/s0936-6555(03)00155-9. [DOI] [PubMed] [Google Scholar]
- 5.Ravasco P, Monteiro-Grillo I, Vidal PM, Camilo ME. Cancer: disease and nutrition are key determinants of patients' quality of life. Support Care Cancer. 2004;12:246–252. doi: 10.1007/s00520-003-0568-z. [DOI] [PubMed] [Google Scholar]
- 6.Ravasco P, Monteiro-Grillo I, Vidal PM, Camilo ME. Dietary counseling improves patient outcomes: a prospective, randomized, controlled trial in colorectal cancer patients undergoing radiotherapy. J Clin Oncol. 2005;23:1431–1438. doi: 10.1200/JCO.2005.02.054. [DOI] [PubMed] [Google Scholar]
- 7.Ravasco P, Monteiro-Grillo I, Marques Vidal P, Camilo ME. Impact of nutrition on outcome: a prospective randomized controlled trial in patients with head and neck cancer undergoing radiotherapy. Head Neck. 2005;27:659–668. doi: 10.1002/hed.20221. [DOI] [PubMed] [Google Scholar]
- 8.Bauer JD, Capra S. Nutrition intervention improves outcomes in patients with cancer cachexia receiving chemotherapy: a pilot study. Support Care Cancer. 2005;13:270–274. doi: 10.1007/s00520-004-0746-7. [DOI] [PubMed] [Google Scholar]
- 9.Isenring EA, Bauer JD, Capra S. Nutrition support using the American Dietetic Association medical nutrition therapy protocol for radiation oncology patients improves dietary intake compared with standard practice. J Am Diet Assoc. 2007;107:404–412. doi: 10.1016/j.jada.2006.12.007. [DOI] [PubMed] [Google Scholar]
- 10.World Cancer Research Fund, American Institute for Cancer Research. Washington: WCRF-AICR; 2007. Food, nutrition, physical activity, and the prevention of cancer: a global perspective. [Google Scholar]
- 11.Stratton R, Green C, Elia M. Wallingford, CT: CABI Publishing; 2003. Disease-related malnutrition: an evidence-based approach to treatment. [Google Scholar]
- 12.Dewys WD, Begg C, Lavin PT, et al. Prognostic effect of weight loss prior to chemotherapy in cancer patients: Eastern Cooperative Oncology Group. Am J Med. 1980;69:491–497. doi: 10.1016/s0149-2918(05)80001-3. [DOI] [PubMed] [Google Scholar]
- 13.Flegal KM, Carroll MD, Ogden CL, Johnson CL. Prevalence and trends in obesity among US adults, 1999–2000. JAMA. 2002;288:1723–1727. doi: 10.1001/jama.288.14.1723. [DOI] [PubMed] [Google Scholar]
- 14.Meyerhardt JA, Catalano PJ, Haller DG. Influence of body mass index on outcomes and treatment-related toxicity in patients with colon carcinoma. Cancer. 2003;98:484–495. doi: 10.1002/cncr.11544. [DOI] [PubMed] [Google Scholar]
- 15.Schlienger JL, Luca F, Vinzio S, Pradignac A. Obesity and cancer. Rev Med Interne. 2009;30:776–782. doi: 10.1016/j.revmed.2009.04.007. [DOI] [PubMed] [Google Scholar]
- 16.Majed B, Moreau T, Asselain B Curie Institute Breast Cancer Group. Overweight, obesity and breast cancer prognosis: optimal body size indicator cut-points. Breast Cancer Res Treat. 2009;115:193–203. doi: 10.1007/s10549-008-0065-7. [DOI] [PubMed] [Google Scholar]
- 17.Prado CM, Lieffers JR, McCargar LJ, et al. Prevalence and clinical implications of sarcopenic obesity in patients with solid tumours of the respiratory and gastrointestinal tracts: a population-based study. Lancet Oncol. 2008;9:629–635. doi: 10.1016/S1470-2045(08)70153-0. [DOI] [PubMed] [Google Scholar]
- 18.Prado CM, Baracos VE, McCargar LJ, et al. Sarcopenia as a determinant of chemotherapy toxicity and time to tumor progression in metastatic breast cancer patients receiving capecitabine treatment. Clin Cancer Res. 2009;15:2920–2926. doi: 10.1158/1078-0432.CCR-08-2242. [DOI] [PubMed] [Google Scholar]
- 19.Longo D. Approach to the patient with cancer. In: Fauci AS, et al., editors. Harrison's Principles of Internal Medicine. New York: McGraw Hill; 1998. pp. 493–499. [Google Scholar]
- 20.Sobin L, Wittekind CH. UICC TNM Classification of Malignant Tumours. In: Wittekind C, editor. Washington: John Wiley & Sons, Inc; 2002. [Google Scholar]
- 21.Fauci AS, Braunwald E, Kasper DL, et al. Harrison's: Principles of Internal Medicine. 17th ed. New York: McGraw-Hill; 2008. [Google Scholar]
- 22.Cotran R, Kumar V, Robbins S. Robbins Basic Pathology. 8th ed. New York: Saunders; 2007. [Google Scholar]
- 23.World Health Organization. Consultation on Obesity. Geneva: WHO; 1998. [Google Scholar]
- 24.Ottery F. Definition of standardised nutritional assessment and interventional pathways in oncology. Nutrition. 1996;12:15–19. doi: 10.1016/0899-9007(96)90011-8. [DOI] [PubMed] [Google Scholar]
- 25.Insenring E, Bauer J, Capra S. The scored Patient-generated Subjective Global Assessment (PG-SGA) and its association with quality of life in ambulatory patients receiving radiotherapy. Eur J Clin Nutr. 2003;57:305–309. doi: 10.1038/sj.ejcn.1601552. [DOI] [PubMed] [Google Scholar]
- 26.Green C. Existence, causes and consequences of disease-related malnutrition in the hospital and community, and clinical and financial benefits of nutritional intervention. Clin Nutr. 1999;18(suppl):3–28. [Google Scholar]
- 27.Marín Caro MM, Laviano A, Pichard C. Nutritional intervention and quality of life in adult oncology patients. Clin Nutr. 2007;26:289–301. doi: 10.1016/j.clnu.2007.01.005. [DOI] [PubMed] [Google Scholar]
- 28.Colatruglio S, Sironi A, Gavazzi C. Nutritional screening and quality of life in patients with gastrointestinal cancer. Paper presented at ESMO Symposium; March 20–21, 2009; Zurich, Switzerland. [Google Scholar]
- 29.Widow W, Lehr V. Relationship between obesity and prognosis in operated breast cancer [author's transl] Arch Geschwulstforsch. 1979;49:535–543. [PubMed] [Google Scholar]
- 30.Anderson B, Connor JP, Andrews JI, et al. Obesity and prognosis in endometrial cancer. Am J Obstet Gynecol. 1996;174:1171–1178. doi: 10.1016/s0002-9378(96)70659-2. discussion 1178–1179. [DOI] [PubMed] [Google Scholar]
- 31.Van Cutsem E, Arends J. The causes and consequences of cancer-associated malnutrition. Eur J Oncol Nurs. 2005;9:551–563. doi: 10.1016/j.ejon.2005.09.007. [DOI] [PubMed] [Google Scholar]
- 32.Majed B, Moreau T, Senouci K, Salmon RJ, Fourquet A, Asselain B. Is obesity an independent prognosis factor in woman breast cancer? Breast Cancer Res Treat. 2008;111:329–342. doi: 10.1007/s10549-007-9785-3. [DOI] [PubMed] [Google Scholar]
- 33.Palma D, Pickles T, Tyldesley S Prostate Cohort Outcomes Initiative. Obesity as a predictor of biochemical recurrence and survival after radiation therapy for prostate cancer. BJU Int. 2007;100:315–319. doi: 10.1111/j.1464-410X.2007.06897.x. [DOI] [PubMed] [Google Scholar]
- 34.Tokunaga M, Hiki N, Fukunaga T, Ogura T, Miyata S, Yamaguchi T. Effect of individual fat areas on early surgical outcomes after open gastrectomy for gastric cancer. Brit J Surg. 2009;96:496–500. doi: 10.1002/bjs.6586. [DOI] [PubMed] [Google Scholar]
- 35.Merkow RP, Bilimoria KY, McCarter MD, Bentrem DJ. Effect of body mass index on short-term outcomes after colectomy for cancer. J Am Coll Surg. 2009;208:53–61. doi: 10.1016/j.jamcollsurg.2008.08.032. [DOI] [PubMed] [Google Scholar]
- 36.Rogers PC, Meacham LR, Oeffinger KC, Henry DW, Lange BJ. Obesity in pediatric oncology. Pediatric Blood Cancer. 2005;45:881–891. doi: 10.1002/pbc.20451. [DOI] [PubMed] [Google Scholar]
- 37.Brawer R, Brisbon N, Plumb J. Obesity and cancer. Primary Care. 2009;36:509–531. doi: 10.1016/j.pop.2009.04.005. [DOI] [PubMed] [Google Scholar]
- 38.Ravasco P, Monteiro Grillo I, Camilo M. Colorectal cancer: intrinsic characteristics modulate cancer energy expenditure and the risk of cachexia. Cancer Invest. 2007;25:1–7. doi: 10.1080/07357900701208873. [DOI] [PubMed] [Google Scholar]
- 39.Piyathilake CJ, Bell WC, Jones J, et al. Pattern of nonspecific (or global) DNA methylation in oral carcinogenesis. Head Neck. 2005;27:1061–1067. doi: 10.1002/hed.20288. [DOI] [PMC free article] [PubMed] [Google Scholar]
- 40.Tisdale MJ. The ‘cancer cachectic factor.’. Support Care Cancer. 2003;11:73–78. doi: 10.1007/s00520-002-0408-6. [DOI] [PubMed] [Google Scholar]
- 41.Holmes S. A difficult clinical problem: diagnosis, impact and clinical management of cachexia in palliative care. Int J Palliat Nurs. 2009;15:322–326. doi: 10.12968/ijpn.2009.15.7.43421. [DOI] [PubMed] [Google Scholar]
- 42.Ravasco P, Monteiro-Grillo I, Camilo ME. Does nutrition influence quality of life in cancer patients undergoing radiotherapy? Radiother Oncol. 2003;67:213–220. doi: 10.1016/s0167-8140(03)00040-9. [DOI] [PubMed] [Google Scholar]
- 43.Mehdad A, McBride E, Monteiro-Grillo I, et al. Nutritional status and eating pattern in prostate cancer patients. Nutricion Hospitalaria. 2009 in press. [PubMed] [Google Scholar]
- 44.Amaral P, Miguel R, Medhad A, et al. Body fat and poor diet in breast cancer women. Nutricion Hospitalaria. 2009 in press. [PubMed] [Google Scholar]
- 45.Freedland SJ, Bañez LL, Sun LL, Fitzsimons NJ, Moul JW. Obese men have higher-grade and larger tumors: an analysis of the duke prostate center database. Prostate Cancer Prostatic Dis. 2009;12:259–263. doi: 10.1038/pcan.2009.11. [DOI] [PubMed] [Google Scholar]
- 46.Chlebowski R, Aiello E, McTiernan A. Weight loss in breast cancer patient management. Clin Oncol. 2002;20:1128–1143. doi: 10.1200/JCO.2002.20.4.1128. [DOI] [PubMed] [Google Scholar]
- 47.Bruning PF. Endogenous estrogens and breast cancer: a possible relationship between body fat distribuition and estrogen availability. J Steroid Biochem. 1987;27:487–492. doi: 10.1016/0022-4731(87)90344-x. [DOI] [PubMed] [Google Scholar]
- 48.Key TJ, Allen NE, Spencer EA, Travis RC. Nutrition and breast cancer. Breast. 2003;12:412–416. doi: 10.1016/s0960-9776(03)00145-0. [DOI] [PubMed] [Google Scholar]
- 49.Osorio-Costa F, Rocha GZ, Dias MM, Carvalheira JB. Epidemiological and molecular mechanisms aspects linking obesity and cancer. Arq Bras Endocrinol Metabol. 2009;53:213–226. doi: 10.1590/s0004-27302009000200013. [DOI] [PubMed] [Google Scholar]
- 50.Freedland SJ, Aronson WJ, Kane CJ, et al. Impact of obesity on biochemical control after radical prostatectomy for clinically localized prostate cancer: a report by the Shared Equal Access Regional Cancer Hospital database study group. J Clin Oncol. 2004;22:446–453. doi: 10.1200/JCO.2004.04.181. [DOI] [PubMed] [Google Scholar]
- 51.Ravasco P, Monteiro-Grillo I, Camilo M. How relevant are cytokines in colorectal cancer wasting? Cancer J. 2007;13:392–398. doi: 10.1097/PPO.0b013e3181594940. [DOI] [PubMed] [Google Scholar]


