Microarray analysis was used to examine gene expression profiles in breast cancer stem cells in an attempt to identify signature patterns and mechanisms of signaling networks in these cells.
Keywords: Breast cancer, Stem cell, Signaling network, Proteome profile
Abstract
There is overwhelming evidence that breast cancer may be driven by a small subset of breast cancer stem cells (BCSCs) that display stem/progenitor cell properties. In the present study, we identified the rare population of BCSCs, the so-called side population (SP) cells, using flow cytometry. Then, we used microarray analysis to study the differential gene expression profiles between SP and non-SP cells. Sixty-three probe sets showed a more than fourfold difference. Next, we compared the levels of proteins with Pathway Array using 154 antibodies, focusing on the proteins and phosphorylation sites that differed among SP cells, malignant mammary cells, and breast cancer tissues. Our results revealed that 40 proteins and phosphorylation sites were more than 1.5-fold different in SP cells than in non-SP cells. By comparing SP cells, MCF7 cells, and nontumorigenic MCF10A cells, we found 12 proteins that were significantly upregulated in SP cells; these proteins—cAMP-response element binding protein (CREB), cyclic AMP-dependent transcription factor 1, mesothelin, thyroid transcription factor 1, phosphorylated (p)-focal adhesion kinase, p38, Bad, p-CREB, p-protein kinase C (PKC)δ, Wee1, cell division cycle 42, and Twist—were more likely to play important roles in the signaling regulation of BCSCs. Further, 16 proteins and phosphoproteins showed differential expression in SP cells and tumor tissues. β-catenin, p-PKCα, and p-CREB were upregulated in both SP cells and breast tumors. Finally, we filtered the differential expression proteins, summarized the pathway interactions of these proteins, and rebuilt Path-Net in order to determine molecular mechanisms and core regulators. This process will allow us to identify signature patterns and mechanisms of signaling networks in BCSCs.
Introduction
The cancer stem cell hypothesis was proposed almost 150 years ago [1]. It suggests that a rare population of tissue stem cells, called tumor-initiating cells (T-ICs) or cancer stem cells (CSCs), is the cellular origin of cancer. In the 1970s, researchers including Barry Pierce and Van Potter revisited the idea and referred to cancer as “maturation arrest of tissue-determined stem cells” [2, 3]. Today, there is overwhelming evidence that a wide variety of malignancies, including breast cancer, may be driven by a small subset of CSCs that display stem/progenitor cell properties. These CSCs express drug transporters and components of the DNA repair system and are refractory to programmed cell death—properties that would allow a cancer cell to resist current treatments [4, 5]. The CSC concept has important implications for basic science as well as cancer diagnosis and targeted therapy.
To date, breast cancer is the leading cause of cancer mortality in women, and it remains difficult to cure despite advances in treatment. In 2003, Al-Hajj et al. [6] demonstrated that, in human mammary carcinomas, a subpopulation of cells with the phenotype Lin−CD44+CD24−/low displays CSC properties. The Lin−CD44+CD24−/low cells, comprising 1%–5% of primary tumors, are 1,000 times more tumorigenic than cell populations depleted of CD44+CD24−/low cells. Injection of as few as 200 Lin−CD44+CD24−/low cells leads to tumor formation in severe combined immunodeficient mice. This provides a major step forward for the identification of human breast cancer stem cells (BCSCs).
Tumorigenic pathways may function differently in distinct tumor subpopulations. Recent technological advances in the isolation and characterization of these cells and the understanding of signaling pathways involved in the self-renewal and differentiation of these cells have led to considerable progress in this area. In the past few years, genome profiling of differentially expressed genes with microarrays has been widely used. However, mRNA levels do not always accurately reflect corresponding protein levels and do not reveal epigenetic changes in the post-transcriptional modulation of proteins or changes in protein-degradation rates.
Breast cancer is a complex disease that results from alterations in the complex signaling network pathways that control cell behaviors. To better understand the molecular crosstalk and regulation of BCSCs, we performed global screening of the signaling pathways in their genomic profile (microarray) and proteomic profile (Pathway Array) in order to map the molecular interactions systematically. This mapping allows us to identify signature patterns and mechanisms of the signaling network in BCSCs. An understanding of the biological characteristics of BCSCs will provide insight into the mechanism of tumorigenesis, allow us to trace the cell of origin in the mammary, and have fundamental and profound implications for breast cancer early diagnosis and curative treatments.
Methods and Materials
Cell Lines
Human breast epithelial adenocarcinoma cell lines (MDA-MB-231, MCF-7, and AU565), a human breast ductal carcinoma cell line (T47D), and a nontumorigenic breast epithelial cell line (MCF10A) were purchased from American Type Culture Collection (ATCC, Manassas, VA). MDA-MB-231, T47D, and AU565 cells were cultured in RPMI1640 (ATCC), and MCF7 cells were cultured in minimal essential medium (ATCC) supplemented with 10% fetal bovine serum (FBS), 1% Pen-Strep, and 5 μg/ml bovine insulin (Life Technologies, Inc., Grand Island, NY). MCF10A cells were grown in mammary epithelial basal medium supplemented with 13 mg/ml bovine pituitary extract (BPE), 0.5 mg/ml hydrocortisone, 10 μg/ml human epidermal growth factor receptor (EGF), 5 mg/ml insulin, and 100 ng/ml cholera toxin. All cells were incubated at 37°C in a humidified atmosphere containing 5% CO2.
Mammosphere Culture
To obtain CSCs and to propagate them as mammospheres, cells floating in the supernatant of 2-day-old cultures were collected by centrifugation, washed in Hanks' buffered salt solution, and plated in ultralow attachment plates (Corning, Corning, NY) at a density of 2 × 10⁴ viable cells/ml. Then, the cells were grown in a serum-free mammary epithelial growth medium (BioWhittaker, Walkersville, MD) supplemented with B27 (Invitrogen, Carlsbad, CA), 10 ng/ml EGF (Sigma, St. Louis, MO), 5 μg/ml bovine insulin (Sigma), 20 ng/ml basic fibroblast growth factor 2 (Sigma), and 4 μg/ml heparin (Sigma). BPE was excluded. Growth factors were added to the mammosphere cultures every 3 days. Mammospheres (>60 μM) were counted on day 7.
Mammosphere formation efficiency (MFE) = Number of mammospheres/Cells incubated × 100%.
Analysis of CD24 and CD44 Expression Levels
CD24 and CD44 expression levels were analyzed in cells derived from monolayer cultures or in 4-day-old primary mammospheres. At least 105 cells were pelleted by centrifugation at 500g for 5 minutes at 4°C, resuspended in 10 μl of monoclonal mouse anti-human CD24–fluorescein isothiocyanate (FITC) antibody (BD Pharmingen, San Jose, CA) and monoclonal mouse anti-human CD44–phycoerythrin (PE) antibody (BD Pharmingen), and incubated for 30 minutes at 4°C. Flow cytometry was performed using a fluorescence-activated cell sorter (FACS)Aria flow cytometer (Becton Dickinson, Franklin Lakes, NJ). Flowjo (Becton Dickinson) software was used for analysis.
Flow Cytometry for Side Population Cells
The cells were detached by trypsinization and washed with ice-cold phosphate-buffered saline (PBS) containing 2% FBS. Cells (1 × 10⁶) were labeled in the growth medium with 5.0 μg/ml Hoechst 33342 dye, either alone or in combination with 50 μg/ml verapamil at 37°C for 90 minutes. After washing with PBS containing 2% FBS, the cells were then incubated with 2 μg/ml propidium iodide to exclude dead cells. Side population (SP) analysis and sorting were done using a FACSVantage SE flow cytometer (BD Biosciences, San Jose, CA). The Hoechst dye was excited with UV laser, and its fluorescence was measured with both 675/20 (Hoechst red) and 424/44 (Hoechst blue) filters. Breast cancer cells were sorted into SP and non-SP cells.
GeneChip Analysis
Total RNA was isolated from the FACS-sorted SP and non-SP cells using an RNeasy Micro kit (Qiagen, Valencia, CA) according to the manufacturer's instructions. RNA samples were quantified using the NucleoSpin® RNA Kit (Molecular Probes Inc., Eugene, OR) and were used for reverse transcription, two consecutive rounds of linear amplification, and production and fragmentation of biotinylated cRNA (Illumina, Inc., San Diego, CA). Hybridization and scanning of the samples were performed according to the manufacturer's instructions (Illumina).
Pathway Array
Total cellular proteins were extracted from flow cytometry sorting cells, five breast cancer cell lines (MDA-MB-231, MCF-7, AU565, T47D, and MCF10A), and breast tissues. Protein concentration was determined with a BCA Protein Assay kit (Pierce, Rockford, IL). Isolated proteins were separated by SDS-PAGE (10% acrylamide), transferred electrophoretically to a nitrocellulose membrane, and blocked for 1 hour. Next, the membrane was clamped with the Mini-PROTEAN II Multiscreen apparatus, which isolates 20 channels across the membrane (Bio-Rad, Hercules, CA). Two or three antibodies were added to each channel and allowed to hybridize overnight at 4°C.
Different sets of antibodies (templates 1–4) were used for each membrane. The blot was washed and hybridized for 1 hour with secondary horseradish peroxidase–conjugated antibodies (Bio-Rad). Chemiluminescence signals were captured using the ChemiDoc XRS System (Bio-Rad). Differences in protein levels were estimated by densitometric scanning and normalized using internal standards.
Tumors
In total, 35 consecutive patients with breast cancer undergoing elective surgery were entered into this prospective study. After obtaining informed consent from the patients and after receiving the approval of the ethics committee, the following tissue samples were collected: tumor (3 mm × 3 mm × 5 mm) and adjacent normal tissues (3 mm × 3 mm × 5 mm). Proteins were extracted from the tissues as described previously and then stored at −80°C until analysis.
Statistical Methods
Differences between groups were examined for statistical significance using one-way analysis of variance, followed by Fisher's protected least significant difference or unpaired t-test as appropriate. All p-values not exceeding .05 were considered statistically significant.
Results
MFE
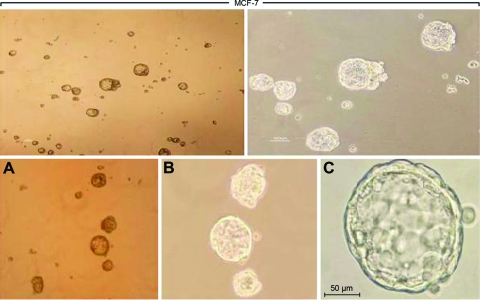
Single MCF7 cells were cultured in suspension (2 × 10⁴ cells/ml), as described previously, to produce mammospheres. In general, mammospheres were formed in MCF7 cells by day 3 and grew with time (Fig. 1). By day 7, apparent mammospheres could be observed under a microscope. The MFE of MCF7 cells was similar to that previously reported (2.1% ± 0.3%).
Figure 1.
Mammosphere culture of breast cancer cells. Phase-contrast images of mammospheres generated by MCF-7 and MDA-MB-231 cells by day 7: 40× magnification (A), 100× magnification (B), 400× magnification (C).
FACS Analysis of CD24 and CD44 Expression
Sheridan et al. [7] reported the existence of a CD44+CD24−/low population in breast cancer cell lines and that the cells of this population possessed more invasive and proliferating properties than other populations. Patrawala et al. [8] proved once more that the CD44+CD24−/low subpopulation of cancer cells has CSC properties. A low number of CD44+CD24−/low cells, as opposed to unsorted cells, is sufficient for tumor initiation [9].
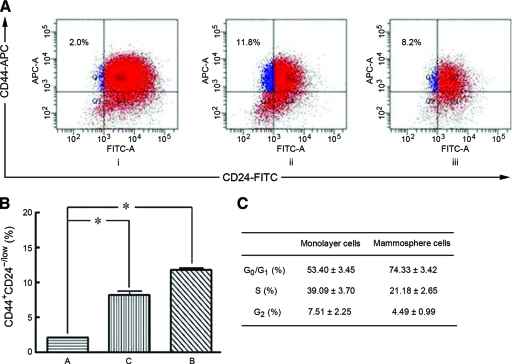
To test whether MCF7 cells have this specific marker for CSC identification, we performed flow cytometry analysis using monoclonal mouse anti-human CD24-FITC antibody and monoclonal mouse anti-human CD44-PE antibody and analyzed the percentage of CD44+CD24−/low cells on day 5. Flow cytometry analysis indicated that, compared with positive expression in the MCF-7 monolayer culture cells (2.0% ± 0.1%), the expression of CD24 and CD44 in MCF-7 mammosphere cells from both floating and adherent conditions was significantly greater (11.8% ± 0.3% and 8.2% ± 0.8%, respectively) (p < .01) (Fig. 2A, 2B).
Figure 2.
Flow cytometry analysis. (A): Flow cytometry analysis to measure CD44 and CD24 expression of cells derived from monolayer culture cells (i) and mammosphere cells from floating MCF-7 cells (ii) and from adherent MCF-7 cells (iii). (B): The expression of CD44+CD24−/low cells was different between mammosphere cells and monolayer culture cells. *p < .01 for mammosphere cells versus monolayer culture cells. (C): Cell cycle analysis.
Abbreviations: APC, allophycocyanin; FITC, fluorescein isothiocyanate.
The cell cycle distributions of mammosphere cells and monolayer culture cells were also examined. The flow cytometry results showed that 74.33% of MCF7 mammosphere cells were in the G0/G1 phase, 21.18% were in the S phase, and 4.49% were in the G2 phase; in contrast, the MCF7 monolayer cells had a lower proportion of G0/G1 phase cells (53.40% ± 3.45%) and a higher proportion of S-phase cells (39.09% ± 3.70%) and G2-phase cells (7.51% ± 2.25%) (Fig. 2C). These results indicate that more quiescent-stage cells can be derived from mammosphere culture than from monolayer culture. The p-value was significant.
Flow Cytometry Sorting
We detected this minor population of cells by flow cytometry based on their capacity to efflux the fluorescent DNA-binding dye Hoechst 33342. The SP was identified by its characteristic fluorescent profile in dual-wavelength analysis and presented as a distinct tail from the main population on the dot plot graph. After Hoechst staining, MCF7 cells could be clearly separated into a fluorescence-negative tail of SP cells (4.02%) and brightly stained mature non-SP cells. Treatment with verapamil, an inhibitor of the drug-resistance protein ATP-binding cassette (ABC)G2 and other ABC transporters, allows SP cells to retain the dye, preventing SP tail formation (0.40%). Moreover, when these SP cells were grown in suspension culture, they easily developed into floating mammospheres; the SP cells had an approximately tenfold higher MFE than the non-SP cells (9.6% versus 1.0%, respectively). This property verifies the high developmental and proliferative potency of SP cells.
Microarray
To study the differential gene-expression profiles between SP and non-SP cells, we performed microarray analysis. The data obtained in this study have been deposited in the National Center for Biotechnology Information's Gene Expression Omnibus (GEO) and are accessible through GEO Series accession number GSE26677 (http://www.ncbi.nlm.nih.gov/geo/query/acc.cgi?acc=GSE26677).
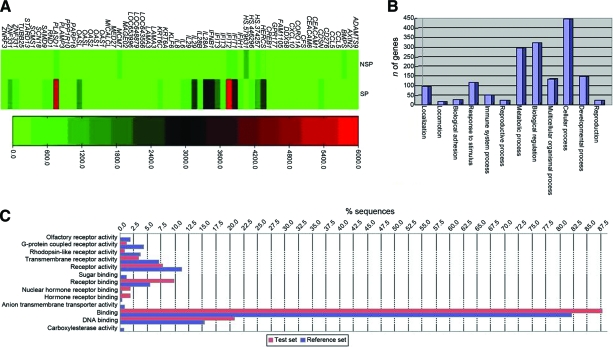
We used a detection p-value ≤.01 and a DiffScore ≥ 13 (which equates to a nominal p-value ≤.05) from the Illumina data as our criteria for differential expression of a gene. Of the 54,675 probe sets, 25,583 were scored as marginal or present call (not absent) in either the SP or non-SP cells and analyzed further. Of the 25,583 sets, 753 probe sets showed significant differences (p-value ≤.01, DiffScore ≥ 13), with 63 probe sets showing a more than fourfold difference. A heat map of the 63 probe sets is shown in Figure 3A.
Figure 3.
Microarray analysis between SP and non-SP cells. (A): Heatmap of the top DEGs between SP and non-SP cells. (B, C): Bar chart for functional category enrichment analysis of DEGs in SP and non-SP cells.
Abbreviations: DEG, differentially expressed gene; SP, side population.
On the basis of orthology, we assigned functional annotations using the Gene Ontology (GO) database to investigate the molecular functions of the genes (Fig. 3B, 3C). The GO project (http://www.geneontology.org/) provides structured, controlled vocabularies and classifications that cover several domains of molecular and cellular biology. The ontologies of the GO database are structured as directed acyclic graphs, which are similar to hierarchies but different in that a more specialized term (child) can be related to more than one less specialized term (parent).
Next, we conducted a bioinformatics analysis to validate the prognostic significance of the differentially expressed genes by analyzing these genes in publicly available gene-expression datasets. The normalized gene-expression data, together with patient characteristics, were downloaded from GEO (http://www.ncbi.nlm.nih.gov/geo; accession number, GSE7390). The gene signatures were calculated as a centroid expression of the SP and non-SP gene sets. Thereafter, patients were divided into two groups on the basis of their centroid expression level (high expression level and low expression level). To determine the prognostic relevance of the gene signatures in human breast cancer, we constructed a contingency table for clinical characteristics between the two groups. In the complete gene set, we found that the clinical characteristics of estrogen receptor (ER) status, grade, overall survival time, distant metastasis-free survival time, time to distant metastasis, clinical risk group according to the St. Gallen criteria, clinical risk group according to the Nottingham Prognostic Index criteria, clinical risk group according to Adjuvant! Online, and clinical risk group according to the Veridex signature were associated with the centroid expression levels of the SP and non-SP gene sets (p < .05).
Pathway Array
Comparison of Proteins That Are Differentially Expressed Between SP and non-SP Cells
We found 106 proteins and phosphoproteins that were expressed in SP cells and non-SP cells. Our results also revealed that 40 proteins or phosphorylations were >1.5-fold different in SP cells compared with non-SP cells. Of these, 10 were upregulated (p-β-catenin, p-eukaryotic translation initiation factor 4B [eIF4B], p-mammalian target of rapamycin [mTOR], p-cAMP-response element binding protein [CREB], p-protein kinase C [PKC]δ, small ubiquitin-like modifier [SUMO]-1, CREB, cell division cycle [cdc]42, Bad, and topoisomerase [Topo] IIa) and 30 were downregulated (p-p70S6 kinase, p-IKBα, p-cdc2, p-retinoblastoma [Rb], p-stress-activated protein kinase/Janus kinase, p-P38, cyclin B1, cyclin D1, cyclin-dependent kinase (CDK)4, Neu, extracellular signal–related kinase [ERK], Csk homologous kinase [CHK]1, cdc2 p34, E2 transcription factor [E2F]-1, proliferating cell nuclear antigen [PCNA], tumor necrosis factor [TNF]-α, vimentin, E-cadherin, Bcl-6, α-tubulin, epithelial cell adhesion molecule [Ep-CAM], Syk, signal transducer and activator of transcription [STAT]1, calcium/calmodulin kinase kinase [CaMKK]α, homing cell adhesion molecule, Patched, hypoxia inducible factor [HIF]-1α, N-cadherin, methionyl tRNA synthetase [MetRS], and vascular endothelial growth factor [VEGF]) in SP cells compared with non-SP cells. This result demonstrated that many signaling proteins, including those involved in cell cycle regulation, are downregulated in SP cells, resulting in the “quiescent stage” of these rare cell populations. In contrast, most signal-transducing proteins are upregulated in non-SP cells, which promotes the proliferation and development of these cells in active signal transmission.
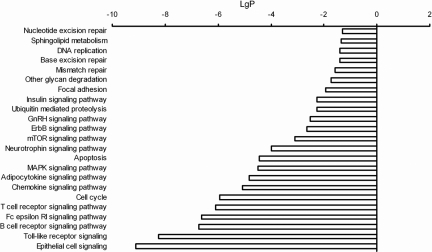
Pathway analysis was performed to identify the significant pathways involved in the differential expression of the proteins. Signal transductions affecting BCSCs are complex interactions of protein pitchpoints in the signaling network that determine the fate, metabolic activity, and differentiation of these CSCs. We used Pathway analysis to classify significant pathways based on the differentially expressed proteins detected in the Pathway Array. Fisher's exact tests and χ2 tests were used to classify the pathways and categories associated with the proteins. Pathway statistical analysis revealed that many signaling pathways are restrained in SP cells compared with non-SP cells; these pathways are involved in DNA repair and replication, other glycan degradation, focal adhesion, insulin signaling, ubiquitin-mediated proteolysis, gonadotropin-releasing hormone (GnRH) signaling, ErbB signaling, mTOR signaling, apoptosis, mitogen-activated protein kinase (MAPK) signaling, cell cycle regulation signaling, etc. (Fig. 4).
Figure 4.
Pathway analysis. This chart shows the differences in the gene signaling pathways between SP and non-SP cells. The threshold of significance was defined by the p-value and FDR (p < .01; FDR < .01). All these proteins show increased enrichment, p-values, and FDRs.
Abbreviations: FDR, false discovery rate; GnRH, gonadotropin-releasing hormone; MAPK, mitogen-activated protein kinase; mTOR, mammalian target of rapamycin; SP, side population.
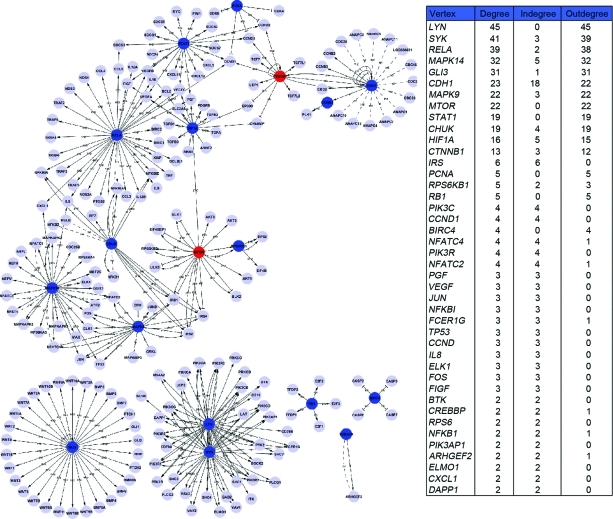
In today's postgenomic era, sequencing projects and the development of high-throughput (HTP) technologies, such as microarray and proteomics, provide great opportunities to uncover and explore the complexity of biological problems using systems biology. Many software tools that can analyze HTP data within the context of biological pathways have been developed. To better understand the protein–protein interaction network in BCSCs as well as the major interaction points in this network, Path-Net was built based on the interactions among the pathways of the Kyoto Encyclopedia of Genes and Genomes (KEGG) database in order to identify the interactions among the significant pathways directly and systemically. Path-Net is an interaction net of the significant pathways involving the differentially expressed proteins. It summarizes the pathway interactions involving differentially expressed proteins and explains why a certain pathway is activated. We compared the protein expression levels in SP cells, non-SP cells, and unsorted MCF7 whole cells, and then filtered the proteins that were differentially expressed and showed a twofold difference in expression level. As distinguished from pathway maps on the KEGG Web site, in terms of the interactions of proteins, a repository breakthrough of the protein interactions boundary by pathway class and supply of integrated protein interactions involved in multiple pathway categories was obtained. On the basis of the diversity in protein–protein interactions, we can search the database for downstream or upstream proteins or the DNA of special proteins. Then, we can rebuild the interaction among the significant pathways. We used Signal-Net to identify the core regulators in SP cells; they were Lyn, Syk, RelA, MAPK14, GLI3, cadherin-1, MAPK9, mTOR, STAT1, ribosomal protein S6 kinase β1, conserved helix-loop-helix ubiquitous kinase, catenin (cadherin-associated protein) β1, insulin receptor substrate, and PCNA (Fig. 5). These core regulators had a higher degree, indegree, and outdegree, indicating that they had additional interactions with other molecules in the signaling network.
Figure 5.
Signal-Net in side population cells. Nodes denote genes and undirected links denote gene–gene interrelations. The power is quantified with the degree, which is the number of relationships that a gene has with other genes. Note: This figure may also be viewed with the article's online supplemental data.
Comparison of Proteins That Are Differentially Expressed Among SP Cells, Breast Cancer Cells, and Nontumorigenic Cells
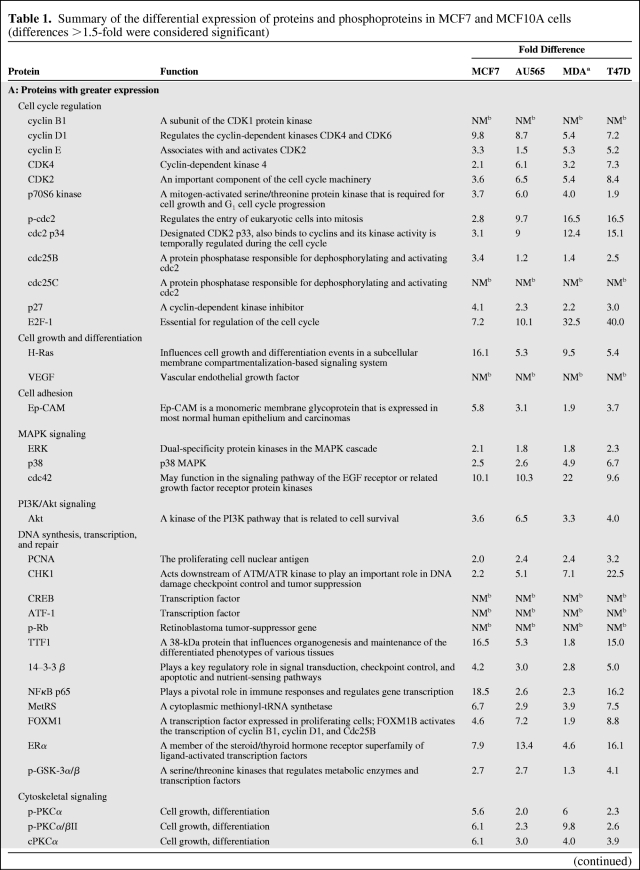
Table 1 summarizes the results obtained for proteins showing mostly a >1.5-fold difference (greater or lower) in expression between MCF7 cells and nontumorigenic MCF10A cells. However, some differences were as high as 40-fold greater and 39-fold lower. The proteins found to have higher expression levels are grouped in Table 1A according to their functions. Similarly, the expression levels of four proteins were found to be lower, and these are grouped in Table 1B. To validate these results, we also analyzed the levels of proteins in MCF10A cells compared with the three other tumorigenic cell lines (AU565, MDA-MB-231, and T47D). The levels of most of the proteins analyzed were similar to those in MCF7 cells.
Table 1.
Summary of the differential expression of proteins and phosphoproteins in MCF7 and MCF10A cells (differences >1.5-fold were considered significant)
Table 1.
(Continued)
aMDA-MB-231; positive values indicate greater expression, negative values indicate lower expression.
bPresence versus absence of a protein: fold difference is not measurable.
Abbreviations: ATF-1, cyclic AMP-dependent transcription factor 1; cdc, cell division cycle; CDK, cyclin-dependent kinase; CHK1, Csk homologous kinase; CREB, cAMP-response element binding protein; E2F1, E2 transcription factor; EGF, epidermal growth factor; Ep-CAM, epithelial cell adhesion molecule; ERα, estrogen receptor α; ERK, extracellular signal–related kinase; FOXM1, forkhead box M1; GSK, glycogen synthase kinase; HIF-1α, hypoxia inducible factor 1α; Hsp90, heat shock protein 90; MAPK, mitogen-activated protein kinase; MetRS, methionyl tRNA synthetase; NA, not available; NFκB, nuclear factor κB; p, phosphorylated; PCNA, proliferating cell nuclear antigen; PDK1, 3-phosphoinositide dependent protein kinase; PI3K, phosphoinositide 3-kinase; PKC, protein kinase C; Rb, retinoblastoma; SP, side population; TNF, tumor necrosis factor; TTF1, thyroid transcription factor 1; VEGF, vascular endothelial growth factor.
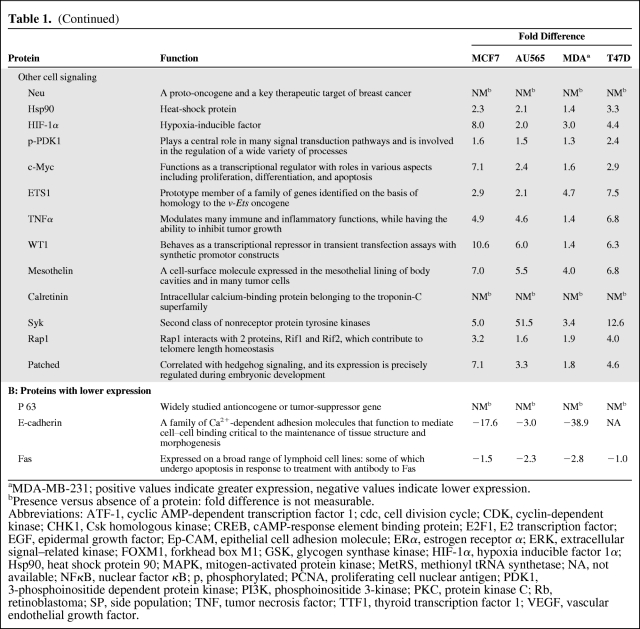
It is important to note that the proteins identified in this study do not act independently but rather as part of a complex signaling network. We present signal networks to identify the interactions among these proteins in human breast epithelial adenocarcinoma cell lines (Fig. 6I). Within the network analysis, degree centrality determines the gene's relative importance. The purpose of Signal-Net is to locate core regulatory factors. In one network, core regulatory factors connect most adjacent genes and have the biggest degrees. For different networks, core regulatory factors were determined by the degree of difference between two class samples [10]. It is possible to find characteristic variables of distance among genes.
Figure 6.
Comparison of proteins differentially expressed among breast cancer cells, nontumorigenic cells and SP cells. (A): Signal-Net in human breast epithelial adenocarcinoma cell lines. Nodes denote genes, and undirected links denote gene–gene interrelation. (B, C): Boxplots for comparison of protein expression in the different cell lines. Note: This figure may also be viewed with the article's online supplemental data.
Abbreviations: MC, MCF10A cells; SPC, side population cells; TC, tumorigenic cells.
By comparing the differential expression of proteins in SP cells, MCF7 cells, and nontumorigenic MCF10A cells, we found 63 proteins and phosphoproteins downregulated in MCF10A cells. Apoptotic proteins, such as Bad, transcription factors, such as CREB and eIF4B, ubiquitin family proteins (SUMO-1), and DNA topoisomerase (Topo-II) were significantly upregulated in SP cells (Fig. 6B), in comparison with their levels in tumorigenic cells and nontumorigenic MCF10A cells. Proteins connected with cell cycle regulation and proliferation, such as p-p70S6 kinase, cyclin B1, cyclin D1, and CDK4, were upregulated in tumorigenic cells, in comparison with SP cells and nontumorigenic MCF10A cells (Fig. 6C).
Comparison of Proteins That Were Differentially Expressed in SP Cells, Tumors, and Normal Tissues
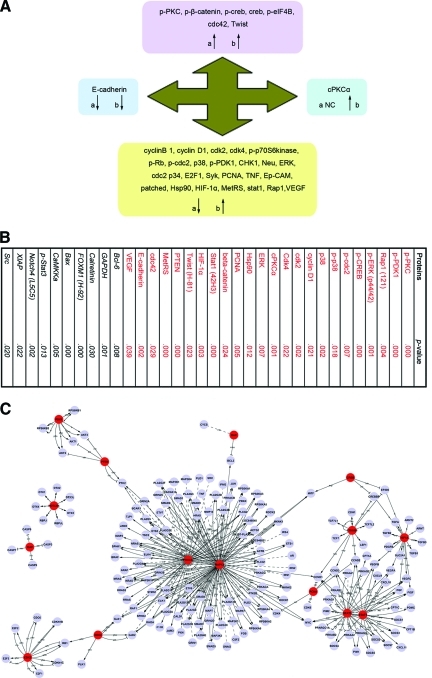
We compared the protein networks and interactions that are differentially regulated in SP cells, malignant mammary cells, and breast cancer tissues (Fig. 7I). We found seven proteins and phosphoproteins (p-PKC, p-β-catenin, p-CREB, CREB, p-eIF4B, cdc42, and Twist) that were upregulated and one protein (E-cadherin) that was downregulated in both SP cells and malignant mammary cells. Furthermore, 26 proteins and phosphoproteins that are involved in this network were differentially regulated in SP and malignant mammary cells than in non-SP and benign mammary cells. Among these, 25 proteins and phosphoproteins (cyclin B1, cyclin D1, CDK2, CDK4, p-p70S6 kinase, p-Rb, p-cdc2, p38, p-3-phosphoinositide dependent protein kinase 1, CHK1, Neu, ERK, cdc2 p34, E2F1, Syk, PCNA, TNF, Ep-CAM, Patched, heat shock protein [Hsp]90, HIF-1α, MetRS, sSTAT1, Rap1, and VEGF) that were downregulated in SP cells were upregulated in malignant mammary cells (MCF7, MDA-MB-231, AU565, and T47D). cPKCα, which showed no difference in expression in SP cells, was upregulated in malignant mammary cells. These results revealed that it is possible that these 26 proteins specially regulate and control differentiated tumor cells. Signal transduction in differentiated breast cancer cells is active because of the rapid proliferation and potency of invasiveness of these cells.
Figure 7.
Summary of differentially expressed proteins in BCSCs, breast cancer cells, and breast cancer tissues. (A): Differential expression of proteins in both SP and malignant mammary cells. a, SP versus non-SP; b, malignant cells versus benign mammary cells. (B): Differential expression of proteins between breast cancer tissues and adjacent normal tissues. (C): Signal-Net in breast cancer tissues. Note: This figure may also be viewed with the article's online supplemental data.
Abbreviations: BCSC, breast cancer stem cell; CaMKKα, calcium/calmodulin kinase kinase α; CDC, cell division cycle; CDK, cyclin-dependent kinase; CHK1, Csk homologous kinase; CREB, cAMP-response element binding protein; E2F1, E2 transcription factor; eIF4B, eukaryotic translation initiation factor 4B; Ep-CAM, epithelial cell adhesion molecule; ERK, extracellular signal–related kinase; FOXM1, forkhead box M1; GAPDH, glyceraldehyde-3-phosphate dehydrogenase; HIF, hypoxia inducible factor; Hsp90, heat shock protein 90; MetRS, methionyl tRNA synthetase; NC, no change; p, phosphorylated; PCNA, proliferating cell nuclear antigen; PDK1, 3-phosphoinositide dependent protein kinase; PKC, protein kinase C; PTEN, phosphatase and tensin homologue deleted on chromosome ten; Rb, retinoblastoma; SP, side population; STAT1, signal transducer and activator of transcription 1; TNF, tumor necrosis factor; VEGF, vascular endothelial growth factor.
For further confirmation, we identified proteins in breast cancer tissues that are differentially expressed than in adjacent normal tissues (Fig. 7B). In total, 35 breast cancer patients were enrolled in the study. Most patients (29 of 35) were diagnosed with invasive ductal carcinoma. Four patients were diagnosed with infiltrating lobular carcinoma and two patients were diagnosed with mucinous adenocarcinoma. ER or progesterone receptor was positively expressed in 17 of 35 patients, and human epidermal growth factor receptor 2 was overexpressed in six of 35 patients. Our results revealed that 34 proteins and phosphoproteins in the signaling pathway were differentially expressed between tumors and normal tissues. Because these proteins and phosphoproteins can interact with multiple partners, they are involved in cell cycle regulation (cyclin B1, cyclin D1, CDK2, CDK4, p-p70S6 kinase, p-cdc2, CHK1, and cdc2 p34), cell growth and proliferation (p-PKC, cPKCα, PCNA, E2F1, and VEGF), the MAPK pathway (p38, ERK, and cdc42), the EGF receptor family (Neu), DNA synthesis and repair (PCNA, CHK1, CREB, MetRS, and p-Rb), cell adhesion (Ep-CAM and E-cadherin), and other cell signaling (Patched, Hsp90, HIF-1α, Rap1, Syk, and TNF).
Complex patterns of signal transduction arise when cells are exposed to combinations of extracellular cues that vary in onset, duration, origin, and synchrony. Cells process these cues through an interconnected network of multifunctional, redundant molecules in order to elicit a set of phenotypic responses that subsequently impact function at the cell, tissue, and organ levels. Here, we constructed a Path-Net based on these differential expression networks in human breast cancer tissues (Fig. 7C).
We further compared the differential expression of proteins in the signaling network between BCSCs and tumor tissues. We found that 16 proteins and phosphoproteins (p-PKCa, p-CREB, p-cdc2, p-p38, cyclin D1, CDK4, ERK, β-catenin, HIF-1α, PCNA, E-cadherin, Bcl-6, MetRS, STAT1, CaMKKα, and VEGF) were differentially expressed in both SP cells and tumor tissues. β-catenin, p-PKCa, and p-CREB are upregulated in both SP cells and breast tumors, prompting these signaling proteins to possibly participate in the initiation of tumorigenesis. However, p-cdc2, p-p38, cyclin D1, CDK4, ERK, HIF-1α, PCNA, E-cadherin, Bcl-6, MetRS, STAT1, CaMKKα, and VEGF are downregulated in SP cells and actively expressed in tumor tissues, indicating that they are related to rapid proliferation and potency of invasiveness.
Discussion
Breast cancer research in the past decades has advanced our understanding of breast cancer biology and improved diagnosis and treatment. Uncovering the underlying signaling network differences aids in understanding the molecular mechanisms and underlying signaling network changes that occur in breast malignancy.
Through the use of specific cell-surface markers, BCSCs can be isolated from breast cancer cell lines and characterized. These BCSCs express one or more ABC transporters, one of the important characteristics of cancer stem/progenitor cells [11]. These transporters can efflux fluorescent dyes such as rhodamine and Hoechst 33342, which play a role in protecting BCSCs from xenobiotic toxins, and this property allows these cells to be separated on a cell sorter [12]. It has been reported in separate studies that the SP and the CD44+CD24−/low population overlap and include more tumorigenic cells than other populations [13]. The isolation of such T-ICs would likely lead to a better understanding of gene expression, cell surface proteins, and drug sensitivities of these cells.
In this report, we identified the rare population of BCSCs in breast cancer cells, the so-called SP cells. These SP cells had an approximately tenfold higher MFE than non-SP cells (9.6% versus 1.0%, respectively). This property verifies the high developmental and proliferative potency of SP cells.
Recently, GeneChip has been widely used to identify differences in gene expression in CSCs [14, 15]. We used microarrays to study differential gene-expression profiles between SP and non-SP cells. Seven hundred fifty-three probe sets showed a significant difference, with 63 probe sets showing a more than fourfold difference. On the basis of these data, we assigned functional annotations using the GO database and investigated the molecular functions of the genes. Gene-expression profiling has been widely used to predict clinical outcomes in patients with breast cancer [16]. In 2002, van de Vijver et al. [17] used microarray analysis to evaluate a 70-gene prognosis profile in 295 consecutive patients with primary breast carcinomas. That study indicated that the gene-expression profile is a more powerful predictor of disease outcome in young patients with breast cancer than standard systems based on clinical and histological criteria. However, in another study, Kreike et al. [18] reported negative results for the same. In a paper published in Clinical Cancer Research in 2006, the researchers reported that no significant differences in gene expression levels in primary breast cancer tumors between patients with and without local recurrence were identified. In 2007, Liu et al. [19] compared the gene-expression profile of CD44+CD24−/low tumorigenic breast cancer cells with that of normal breast epithelium and generated a 186-gene “invasiveness” gene signature (IGS). They found that there was a significant association between the IGS and both overall and metastasis-free survival (p < .001) in patients with breast cancer, which was independent of already established clinical and pathological variables. We compared the gene signature in the present study with the IGS, and our results were in accordance with those in that report, which stated that the differential genes were involved in DNA binding, cellular processes, cell surface receptors, and metabolism. These pathways have been shown to play critical roles in tumorigenesis, cell differentiation, and development.
To better understand the interplay of environmental cues, intracellular signals, and cellular behaviors that underlie disease states systematically, HTP techniques are required to measure quantitative variations in proteins and phosphoproteins in intracellular signaling networks. We developed a powerful proteomic system that is specifically designed to uncover the complex cell signaling networks in the protein profile and provide answers to how tumors develop [20, 21]. This Pathway Array technology is a powerful tool for analyzing differences in intracellular protein expression and phosphorylation in major cell signaling pathways, with HTP screening. The sensitivity of this system can be enhanced to 0.1 ng with a fluorescent label (Cy3 and Cy5) and with the use of phosphorimaging (more sensitive than conventional Western blotting). Over 80%–90% of the proteins identified by this technology can be confirmed by conventional Western blotting.
We compared the level of proteins by Pathway Array using 154 antibodies, focusing on the proteins and phosphorylation sites that are different in breast cancer SP cells, malignant mammary cells, and breast cancer tissues. Then, we filtered the differentially expressed proteins, summarized the pathway interaction of these proteins, and rebuilt Path-Net to identify the molecular mechanisms and core regulators of breast malignancy.
On the basis of the data presented here, we propose that many signaling pathways are restrained in SP cells, and that these are functionally linked to cell cycle regulation, DNA repair and replication, focal adhesion, the insulin signaling pathway, ubiquitin-mediated proteolysis, the GnRH signaling pathway, the ErbB signaling pathway, the mTOR signaling pathway, apoptosis, the MAPK signaling pathway, etc. The findings reported here may help in understanding the “quiescent stage” of this rare cell population. In contrast, most signal-transducing proteins are upregulated in non-SP and unsorted MCF7 cells and promote proliferation and development of these cells via active signal transmission.
Current knowledge of intracellular signal transduction is staggeringly complex. To identify network-level properties that affect cell function, it is necessary to mathematically model the dynamic, multivariate characteristics of signaling proteins within cells. We anticipate that these functional assays will complement existing proteomic understanding and find broad applicability in biological and clinical problems involving signal transduction and breast cancer.
Perhaps the most important outcome of this study extends beyond the breast cancer field to cancer research in general. With this knowledge, it should be possible to design therapies targeted to the unique properties of tumor stem cells, which can in turn enable selective killing. For example, proteins involved in cell cycle regulation and the Wnt signaling pathway are differentially regulated in the rare BCSCs and the more numerous non-BCSCs. Therefore, it is conceivable that we can focus investigations on some proteins in these two pathways, such as β-catenin and CREB, as potential sites for BCSC-targeted therapy.
The CSC hypothesis is a promising paradigm that could potentially influence cancer diagnosis and management, by relying primarily on the expression of target antigens.
Supplementary Material
Acknowledgments
This work was supported by Leading Academic Discipline Project of Shanghai Municipal Education Committee (No. J50208) and Shanghia Municipal Natural Science Foundation (No. 09ZR1417900).
Author Contributions
Conception/Design: Fengchun Zhang, Hongxia Wang
Provision of study material and experiment guidance: David Y. Zhang
Collection and/or assembly of data: Mingzhu Huang
Data analysis and interpretation: Mingzhu Huang
Manuscript writing: Hongxia Wang
Final approval of manuscript: Fengchun Zhang
References
- 1.Sell S. Stem cell origin of cancer and differentiation therapy. Crit Rev Oncol Hematol. 2004;51:1–28. doi: 10.1016/j.critrevonc.2004.04.007. [DOI] [PubMed] [Google Scholar]
- 2.Pierce GB, Johnson LD. Differentiation and cancer. In Vitro. 1971;7:140–145. doi: 10.1007/BF02617957. [DOI] [PubMed] [Google Scholar]
- 3.Potter VR. Phenotypic diversity in experimental hepatomas: The concept of partially blocked ontogeny. The 10th Walter Hubert Lecture. Br J Cancer. 1978;38:1–23. doi: 10.1038/bjc.1978.159. [DOI] [PMC free article] [PubMed] [Google Scholar]
- 4.Scharenberg CW, Harkey MA, Torok-Storb B. The ABCG2 transporter is an efficient Hoechst 33342 efflux pump and is preferentially expressed by immature human hematopoietic progenitors. Blood. 2002;99:507–512. doi: 10.1182/blood.v99.2.507. [DOI] [PubMed] [Google Scholar]
- 5.Kim M, Turnquist H, Jackson J, et al. The multidrug resistance transporter ABCG2 (breast cancer resistance protein 1) effluxes Hoechst 33342 and is overexpressed in hematopoietic stem cells. Clin Cancer Res. 2002;8:22–28. [PubMed] [Google Scholar]
- 6.Al-Hajj M, Wicha MS, Benito-Hernandez A, et al. Prospective identification of tumorigenic breast cancer cells. Proc Natl Acad Sci U S A. 2003;100:3983–3988. doi: 10.1073/pnas.0530291100. [DOI] [PMC free article] [PubMed] [Google Scholar]
- 7.Sheridan C, Kishimoto H, Fuchs RK, et al. CD44+/CD24− breast cancer cells exhibit enhanced invasive properties: An early step necessary for metastasis. Breast Cancer Res. 2006;8:R59. doi: 10.1186/bcr1610. [DOI] [PMC free article] [PubMed] [Google Scholar]
- 8.Patrawala L, Calhoun T, Schneider-Broussard R, et al. Side population is enriched in tumorigenic, stem-like cancer cells, whereas ABCG2+ and ABCG2− cancer cells are similarly tumorigenic. Cancer Res. 2005;65:6207–6219. doi: 10.1158/0008-5472.CAN-05-0592. [DOI] [PubMed] [Google Scholar]
- 9.Pardal R, Clarke MF, Morrison SJ. Applying the principles of stem-cell biology to cancer. Nat Rev Cancer. 2003;3:895–902. doi: 10.1038/nrc1232. [DOI] [PubMed] [Google Scholar]
- 10.Carlson MR, Zhang B, Fang Z, et al. Gene connectivity, function, and sequence conservation: Predictions from modular yeast co-expression networks. BMC Genomics. 2006;7:40. doi: 10.1186/1471-2164-7-40. [DOI] [PMC free article] [PubMed] [Google Scholar]
- 11.Bunting KD. ABC transporters as phenotypic markers and functional regulators of stem cells. Stem Cells. 2002;20:11–20. doi: 10.1002/stem.200011. [DOI] [PubMed] [Google Scholar]
- 12.Olempska M, Eisenach PA, Ammerpohl O, et al. Detection of tumor stem cell markers in pancreatic carcinoma cell lines. Hepatobiliary Pancreat Dis Int. 2007;6:92–97. [PubMed] [Google Scholar]
- 13.Tanaka H, Nakamura M, Kameda C, et al. The Hedgehog signaling pathway plays an essential role in maintaining the CD44+CD24−/low subpopulation and the side population of breast cancer cells. Anticancer Res. 2009;29:2147–2157. [PubMed] [Google Scholar]
- 14.Botchkina IL, Rowehl RA, Rivadeneira DE, et al. Phenotypic subpopulations of metastatic colon cancer stem cells: Genomic analysis. Cancer Genomics Proteomics. 2009;6:19–29. [PubMed] [Google Scholar]
- 15.Korkola JE, Houldsworth J, Chadalavada RS, et al. Down-regulation of stem cell genes, including those in a 200-kb gene cluster at 12p13.31, is associated with in vivo differentiation of human male germ cell tumors. Cancer Res. 2006;66:820–827. doi: 10.1158/0008-5472.CAN-05-2445. [DOI] [PubMed] [Google Scholar]
- 16.Paik S, Shak S, Tang G, et al. A multigene assay to predict recurrence of tamoxifen-treated, node-negative breast cancer. N Engl J Med. 2004;351:2817–2826. doi: 10.1056/NEJMoa041588. [DOI] [PubMed] [Google Scholar]
- 17.van de Vijver MJ, He YD, van't Veer LJ, et al. A gene-expression signature as a predictor of survival in breast cancer. N Engl J Med. 2002;347:1999–2009. doi: 10.1056/NEJMoa021967. [DOI] [PubMed] [Google Scholar]
- 18.Kreike B, Halfwerk H, Kristel P, et al. Gene expression profiles of primary breast carcinomas from patients at high risk for local recurrence after breast-conserving therapy. Clin Cancer Res. 2006;12:5705–5712. doi: 10.1158/1078-0432.CCR-06-0805. [DOI] [PubMed] [Google Scholar]
- 19.Liu R, Wang X, Chen GY, et al. The prognostic role of a gene signature from tumorigenic breast-cancer cells. N Engl J Med. 2007;356:217–226. doi: 10.1056/NEJMoa063994. [DOI] [PubMed] [Google Scholar]
- 20.Zhang DY, Ye F, Gao L, et al. Proteomics, pathway array and signaling network-based medicine in cancer. Cell Div. 2009;4:20. doi: 10.1186/1747-1028-4-20. [DOI] [PMC free article] [PubMed] [Google Scholar]
- 21.Ye F, Che Y, McMillen E, et al. The effect of Scutellaria baicalensis on the signaling network in hepatocellular carcinoma cells. Nutr Cancer. 2009;61:530–537. doi: 10.1080/01635580902803719. [DOI] [PubMed] [Google Scholar]
Associated Data
This section collects any data citations, data availability statements, or supplementary materials included in this article.


