Abstract
Background
To hasten and improve anticancer drug development, we created a novel approach to generating and analyzing preclinical dose-scheduling data so as to optimize benefit-to-toxicity ratios.
Methods
We applied mathematical methods based upon Norton-Simon growth kinetic modeling to tumor-volume data from breast cancer xenografts treated with capecitabine (Xeloda®, Roche) at the conventional schedule of 14 days of treatment followed by a 7-day rest (14 - 7).
Results
The model predicted that 7 days of treatment followed by a 7-day rest (7 - 7) would be superior. Subsequent preclinical studies demonstrated that this biweekly capecitabine schedule allowed for safe delivery of higher daily doses, improved tumor response, and prolonged animal survival.
Conclusions
We demonstrated that the application of Norton-Simon modeling to the design and analysis of preclinical data predicts an improved capecitabine dosing schedule in xenograft models. This method warrants further investigation and application in clinical drug development.
Keywords: Norton-Simon, mathematical model, chemotherapy schedule, capecitabine, Xeloda®
INTRODUCTION
Typically, anticancer drug development aims to determine a dose level and schedule for clinical use based on preclinical experiments and initial clinical trials that usually use toxicity as their endpoints[1]. The assumption is that maximum anticancer effects may be achieved by maximizing the amount of drug delivered as a function of time, using toxicity as the limiting factor[2]. This is in spite of evidence in clinical breast cancer management, as one example, that better anticancer results are not always associated with increased dose levels[3–6]. There is indeed a biochemical rationale for the prospect that an optimum dose-schedule may not be the maximum-tolerated dose schedule. Tachyphylaxis, the waning of medication effect when used on a continuous basis, may develop with ongoing exposure. Hence, depending on the schedule of administration, more drug may not be more effective drug.
There is a need, therefore, for a method of using preclinical data to determine the optimal schedule and dose level of an anticancer drug or regimen, rather than the most dose-intensive schedule (defined as the amount of drug per body weight or surface area as a function of time, eg, mg/m2/week). Moreover, the trial and error iterative approach to determining clinical dose schedules is laborious and expensive. Improved methods may therefore produce not only better regimens, but may be more cost efficient and expeditious.
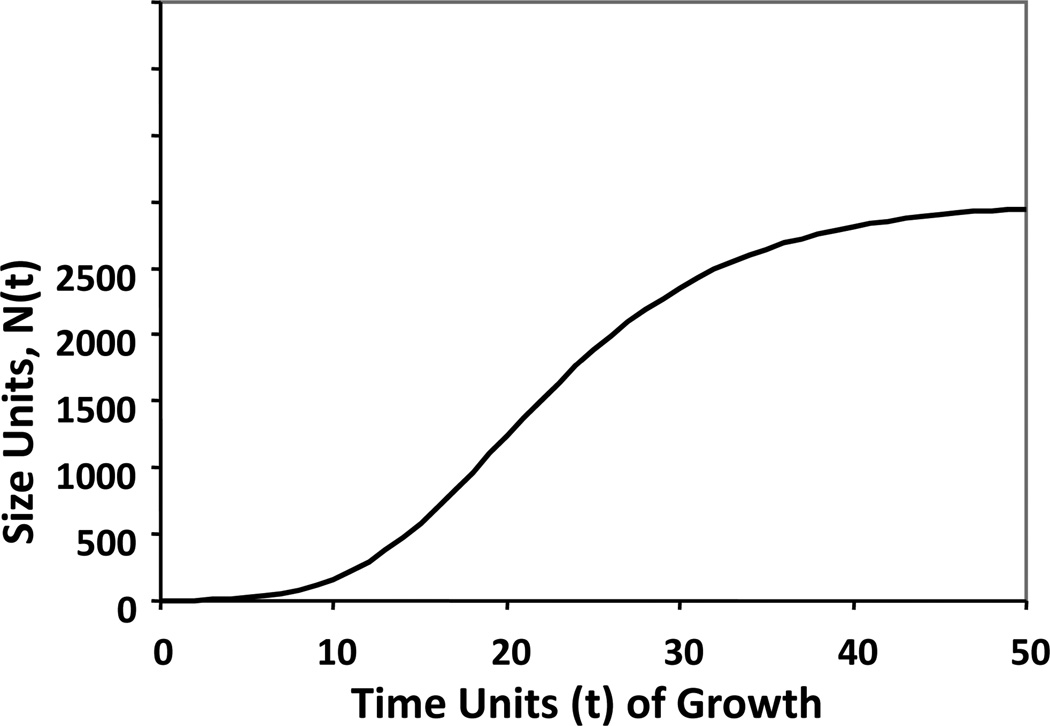
Mathematical modeling and simulation are potentially useful in this regard, just as these tools have proved to be useful in the physical, chemical, and economic sciences. Several mathematical models have been proposed to describe the natural history of breast cancer[7–14]. Of these, the Gompertz equation is particularly accurate in estimating the growth of normal organs and unperturbed malignant tumors. In Gompertzian growth, the relative rate of increase in population size (i.e., the rate of growth divided by the absolute size) falls exponentially as the population grows larger, eventually approaching a limiting plateau phase of slow, even imperceptible, absolute growth (Figure 1; APPENDIX) [15–18]. Norton and Simon previously demonstrated that when tumors, essentially populations of cancer cells, are perturbed by anticancer therapy, their rate of regression was proportional to their Gompertzian-predicted, unperturbed growth rates [7–10]. This observation led to the hypothesis that maximal benefit from bolus chemotherapy requires (1) defining a dose level of drug that yields maximum growth perturbation within acceptable limits of toxicity and (2) administering repeated cycles of drug at that dose level as rapidly as feasible by minimizing inter-treatment intervals[19]. This concept of dose density has been validated in preclinical and clinical experiments[20–24], leading to improved dosing schedules for the adjuvant treatment of women with early stage breast cancer and their improved survival.
Figure 1.
The Gompertzian growth curve representing an untreated population of tumor cells. D(t) = 0 for all values of t. The S-shaped pattern of unperturbed Gompertzian growth is evident.
We now describe a mathematical method, similarly derived from the Gompertz equation by which the dosing schedule for a drug may be determined based upon maximal efficacy rather than maximal tolerable toxicity. This paper will describe the derivation of the method, and the application of this method to predicting an alternative Capecitabine (Xeloda®) schedule.
Why Capecitabine?
Capecitabine is an orally administered pro-drug of 5-fluorouracil designed to exploit the differences in metabolic enzyme activity between tumor cells and normal, healthy tissue[25]. It has substantial antitumor activity as a single agent in refractory breast cancer, with reported response rates ranging between 15–29%, and median overall survival durations ranging between 10.1–15.2 months[26–29]. The drug is approved by the United States Food and Drug Administration (FDA) as monotherapy for treatment of patients with metastatic breast cancer resistant to anthracycline- and taxane-containing regimens, and also in doublets with docetaxel, ixabepilone and lapatinib for previously treated, metastatic breast cancer [30–33]
Multiple, conventional phase I and II trials have explored capecitabine dosing strategies including continuous and intermittent schedules across tumor types [34–36]. Ultimately, median time to progression appeared longest when capecitabine monotherapy was administered for 14 days, followed by a 7-day treatment rest (14 – 7) at a dose of 2,510 mg/m2/day in 2 divided daily doses. This dose and schedule became the FDA approved capecitabine recommended treatment.
Nevertheless, in practice this dosing schedule has proved to be problematic, which might be limiting the use of this very active agent. Dose interruptions and reductions have been necessary in ~34–65% of patients receiving capecitabine at the FDA-recommended dose level and schedule, and as many as 12–16% of patients in clinical trials have discontinued the drug because of toxicity rather than disease progression[29, 37]. In clinical practice, physicians have found it necessary to use reduced dose levels of the drug or to modify the 14 - 7 schedule empirically so as to avoid intolerable toxicity[38]. These practice patterns have been in the absence of theoretically motivated and experimentally determined guidelines. The need for an improved capecitabine dosing schedule which minimizes toxicity while maintaining or improving efficacy is apparent. Here, we describe the application of a novel mathematical method to optimize dosing schedule for capecitabine.
METHODS
Modeling theory
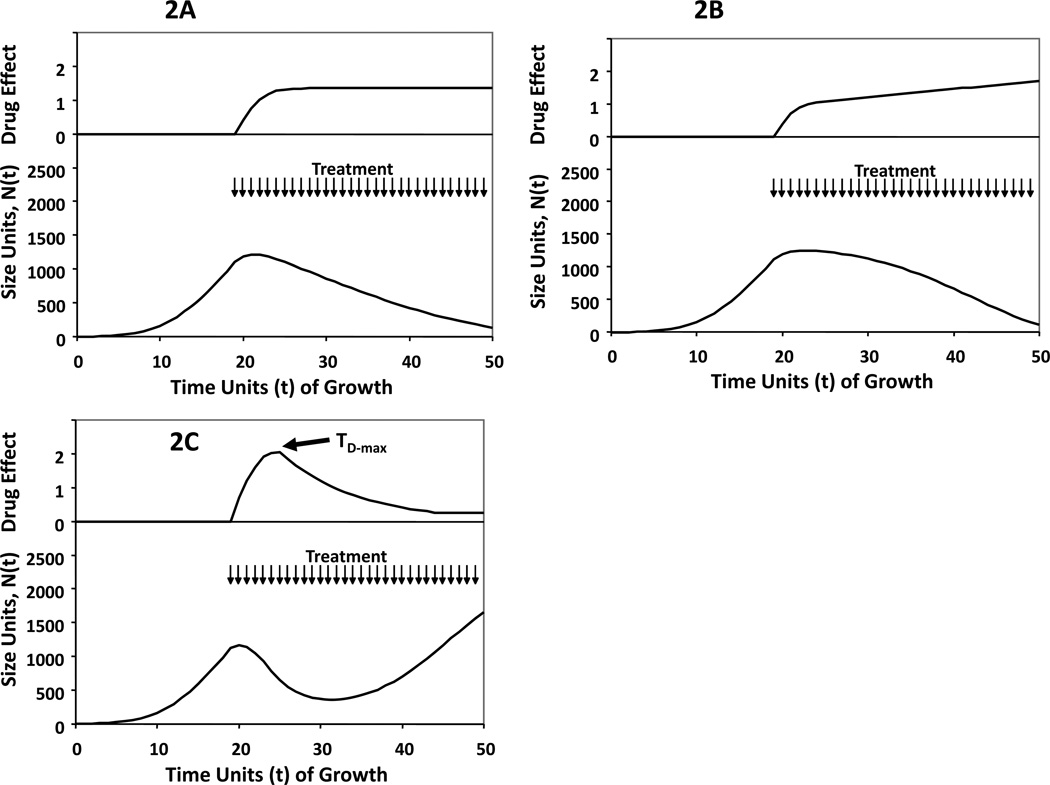
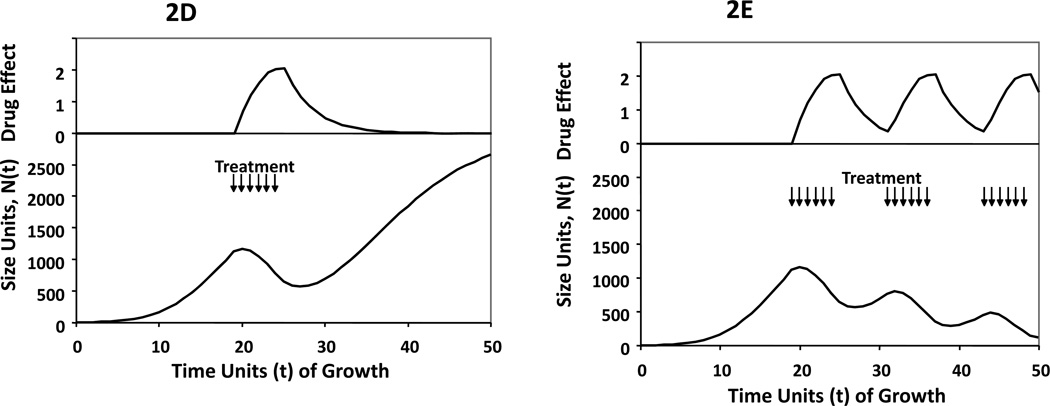
Oral anticancer medications have the potential for ease of frequent administration so as to prolong exposure of the cancer to drug effects. We hypothesized that if drug is administered at some continuous dosing interval, there are 3 likely possibilities regarding drug effects on Gompertzian growth over time: (1) the efficacy of therapy increases to a peak, and continues at that peak as long as therapy is applied (Figure 2A), (2) the efficacy of therapy increases with continued dosing (Figure 2B), and (3) the efficacy of therapy reaches a peak but then declines as therapy is continued (Figure 2C). For the first two scenarios, treatment should be continued as long as toxicity allows. However, in the third case, we hypothesize that the optimal way to schedule drug would be to dose continuously to the point of maximal impact of therapy, then stop (Figure 2D). Treatment beyond the point of maximal drug effect may shift the therapeutic index with toxicity outweighing a dimished antitumor benefit. After the shortest period of recovery feasible and restoration of maximum drug sensitivity for the tumor, repeated cycles should then be introduced (Figure 2E).
Figure 2.
Conceptual sketches of Gompertzian growth curves in response to treatment, illustrating proposed patterns of drug effect (2A, 2B and 2C). The top panels of each curve demonstrate the magnitude of drug effect over time, as calculated by measuring at each time point after the initiation of therapy, the value of one minus the ratio of the Gompertzian growth rate of the tumor in the treated state with that estimated from data that would be observed for a tumor of that size in the control state. Panels 2D and 2E represent the theoretical impact of treating to the point of maximal drug effect if response to therapy mimics scenario 2C. Treatment is signified by arrows at times of administration.
2A: Gompertzian growth perturbed by effective continuous treatment in a case where the efficacy of therapy D(t) increases to a stable plateau greater than zero.
2B: Gompertzian growth perturbed by effective continuous treatment in a case where the efficacy of therapy D(t) increases consistently as long as the treatment continues.
2C: Gompertzian growth perturbed by effective continuous treatment in a case where the efficacy of therapy D(t) increases to a peak, then decreases as treatment continues beyond the time of that peak, TD-max. In this case, D(t) remains greater than zero even for t > TD-max, so treatment is slowing growth but not causing tumor regression. That is, dD(TD-max)/dt = 0. In this case, we propose the best way to schedule drug would be continuous dosing between TRx and TD-max, then discontinuation.
2D: Gompertzian growth perturbed by effective treatment that is discontinued after TD-max. There is an exponentially declining D(t) after treatment discontinuation.
2E: Gompertzian growth perturbed by effective intermittent treatment where drug administration ends at the point of maximum drug effect. The length of each therapy cycle is constant, TD-max – TRx as guided by Figure 2C.
To estimate the impact of drug effect over time using Gompertzian models, one can compare the predicted rate of growth from unperturbed curves with the predicted rate of growth from treated curves over time. A rational dosing strategy can then be determined based on the time point of maximal impact of drug effect. Our preclinical experiments and mathematical representation of this method are described below.
Methods
Initially, mice bearing MX-1 human breast cancer xenografts received daily dosed capecitabine for 14 days, followed by a 7-day rest[39]. Control, untreated xenografts were compared with 2 dose levels of capecitabine (1.5 mmol/kg/day (~540 mg/kg) and 2.25 mmol/kg/day (~809 mg/kg)). Compound was formulated as a suspension in citrate buffer (pH 6.0) containing 5% gum arabic. Mean tumor volume over time was plotted for the 10 mice per cohort, and curve fitting of tumor growth data was performed by nonlinear, mixed-effects, population modeling using NONMEM V software.
Data were analyzed by measuring at each time point (t) after the initiation of therapy (TRx) the value of one minus the ratio of the Gompertzian growth rate of the tumor in the treated state with that estimated from data that would be observed for a tumor of that size in the control, unperturbed state:
Curve-fitting of tumor growth data was performed by nonlinear, mixed-effects, population modeling using NONMEM V software. The First Order estimation was used throughout the modeling.
The effect of multiple cycles of treatment were considered to be additive,
although the magnitude and duration of effect Di(t) for each of the n cycles were estimated separately. The curve D(t) was examined for pattern and dD(t)/dt for t>TRx was calculated so as to determine, if appropriate, a TD-max such that dD(TD-max)/dt = 0.
The next set of experiments sought to validate this model in a second xenograft system known to be responsive to capecitabine, and to compare the predicted, optimized dosing schedule with the conventional capecitabine dosing schedule of 14 – 7. KPL-4 human breast cancer xenografts received daily dosed capecitabine for 14 days, followed by a 7-day rest. Compound was formulated as a suspension in 2% Klucel LF, 0.1% Tween 80, 0.09% methylparaben, and 0.01% propylparaben. The 2% Klucel is a more optimal capecitabine formulation than the gum arabic; therefore, higher exposure and lower MTD is observed when compared with the MX-1 studies.
Efficacy data were graphically represented as the mean tumor volume + standard error of the mean (SEM). Tumor volumes of treated groups were presented as percentages of tumor volumes of the control groups (% T/C), using the formula: 100 × ([T - T0]/[C - C0]), where T represented mean tumor volume of a treated group on a specific day during the experiment, T0 represented mean tumor volume of the same treated group on the first day of treatment; C represented mean tumor volume of a control group on the specific day during the experiment, and C0 represented mean tumor volume of the same control group on the corresponding first day of treatment. Tumor volume (in cubic millimeters) was calculated using the ellipsoid formula: (D × [d2])/2 where D represents the large diameter of the tumor, and “d” represents the small diameter. In some cases, tumor regression and/or percent change in tumor volume was calculated using the formula: ([T-T0]/T0) × 100, where T represents mean tumor volume of the treated group at a particular day, and T0 represents mean tumor volume of the same treated group at initiation of treatment. Statistical analysis was determined by the Mann Whitney rank sum test (SigmaStat, version 2.0, Jandel Scientific, San Francisco, CA).
For the survival assessment, animals were evaluated for tumor re-growth following cessation of treatment. Results were plotted as the percentage survival against days after tumor implant (Stat View, SAS Institute, Cary NC). Tumor re-growth to a volume of 500 mm3 was considered as a surrogate for death when calculating ILS. The percent ILS was calculated as 100 × ([median survival day of treated group - median survival day of control group]/median survival day of control group). Median survival was determined by utilizing Kaplan-Meier survival analysis. Survival in treated groups was compared with the vehicle group by log-rank test, and survival comparisons between groups were analyzed by the Breslow-Gehan-Wilcoxon test (Stat View, SAS, Cary, NC). All differences between groups were considered significant when the probability value (P) was <.05.
RESULTS
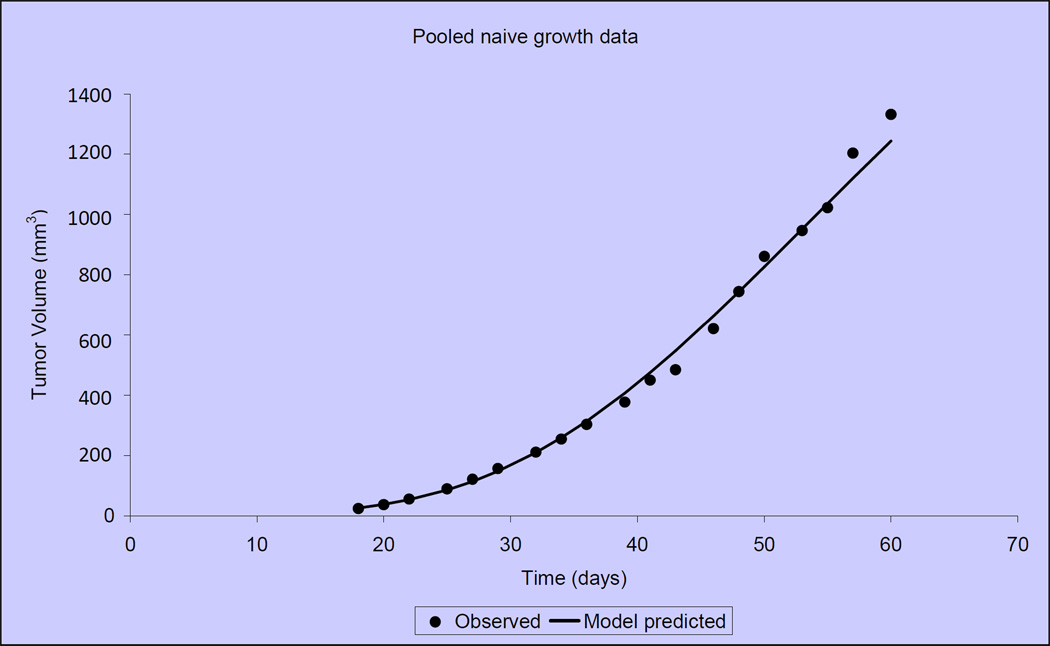
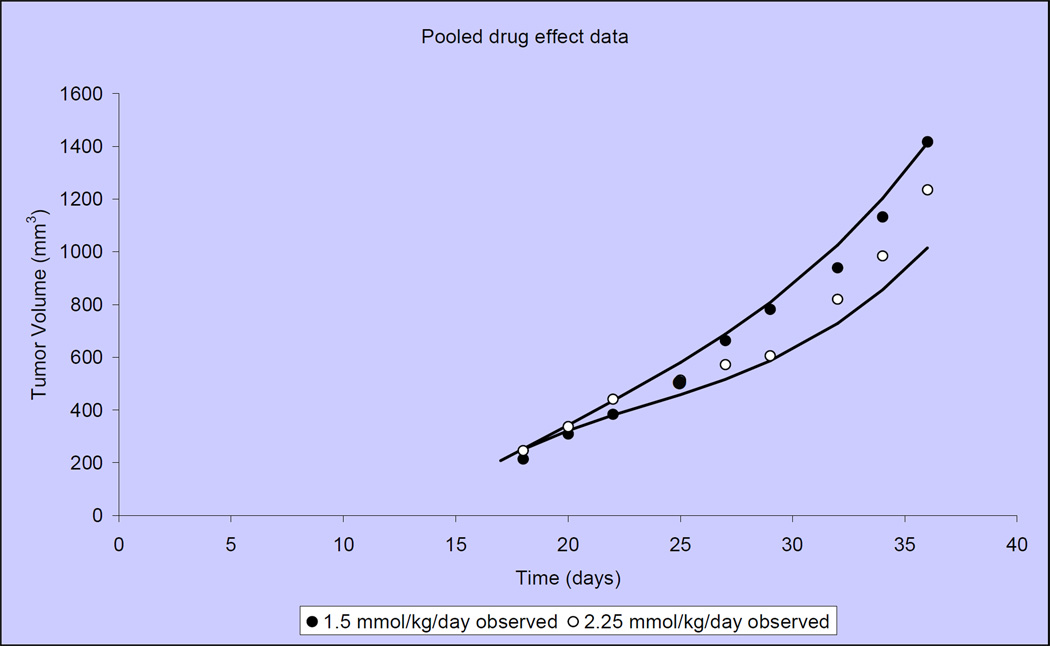
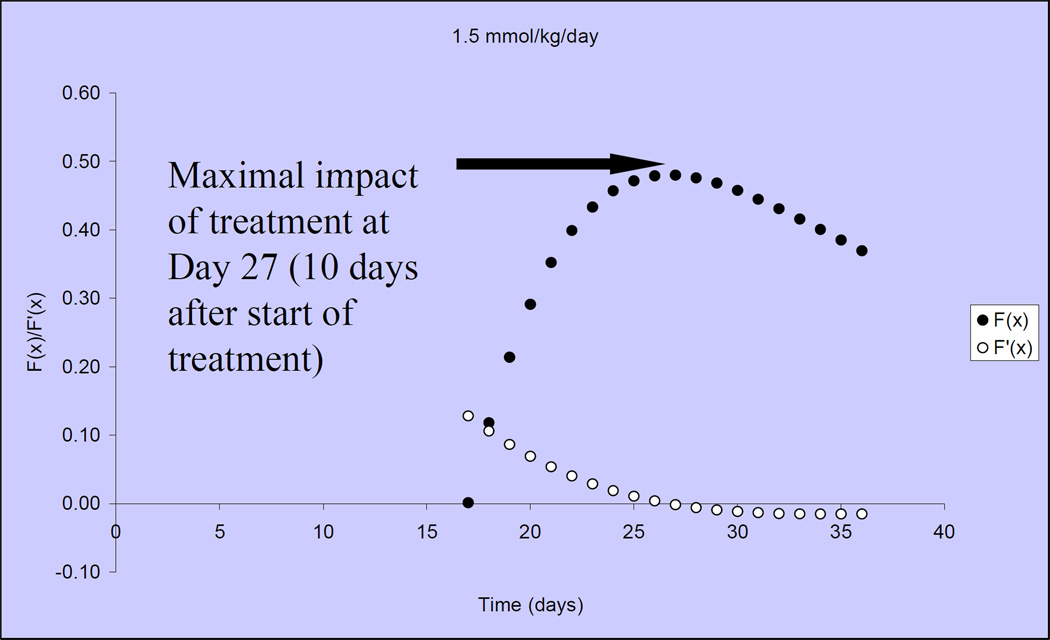
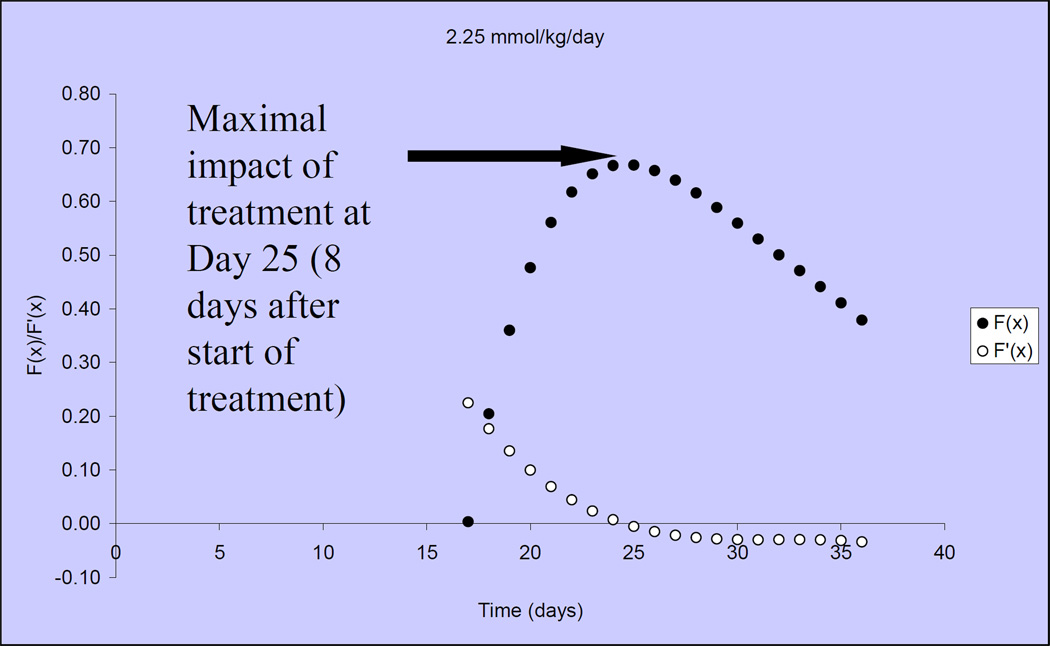
Figure 3 illustrates that tumor growth in untreated, control mice is closely fit by the Gompertzian function. Similarly, the Norton-Simon equation closely approximated tumor volumes for animals treated with capecitabine at 2 dose levels: 1.5 mmol/kg/day (~540 mg/kg/day) and 2.25 mmol/kg/day (809 mg/kg/day) (Figure 4)[40]. We observed that the impact of capecitabine follows the pattern of drug effect hypothesized in Figure 2C. At the lower dose level (1.5 mmol/kg/day or ~540 mg/kg/day), the maximal impact of treatment occurred ~10 days after the start of capecitabine (day 27) (Figure 5). At a capecitabine dose of 2.25 mmol/kg/day or ~809 mg/kg/day, the maximal impact of treatment occurred ~8 days after the start of therapy (Figure 6). For treatment days beyond this point, the impact of capecitabine drug effect decreases despite continued administration[40]. Based on these results, we hypothesized an optimal capecitabine dosing schedule would deliver drug for 7 consecutive days (to approximate point of maximal drug effect) followed by a 7 day rest (7—7).
Figure 3.
Treatment-naïve, MX-1 xenograft tumor volumes compared with predicted tumor volumes according to the Gompertzian model. Data shown are mean tumor volumes of 10 mice.
Figure 4.
Observed and predicted MX-1 xenograft tumor volumes when treated at 2 capecitabine doses (1.5 mmol/kg/day and 2.25 mmol/kg/day). Capecitabine is administered on the conventional 14-7 schedule. Mean tumor volumes shown for 10 mice per treatment group.
Figure 5.
The drug effect of capecitabine 1.5mmol/kg/day is shown over time, in solid circles, when dosing begins on Day 17. Open circles represent the rate of change in drug effect over time.
Figure 6.
The drug effect of capecitabine 2.25mmol/kg/day is shown over time, in solid circles, when dosing begins on Day 17. Open circles represent the rate of change in drug effect over time.
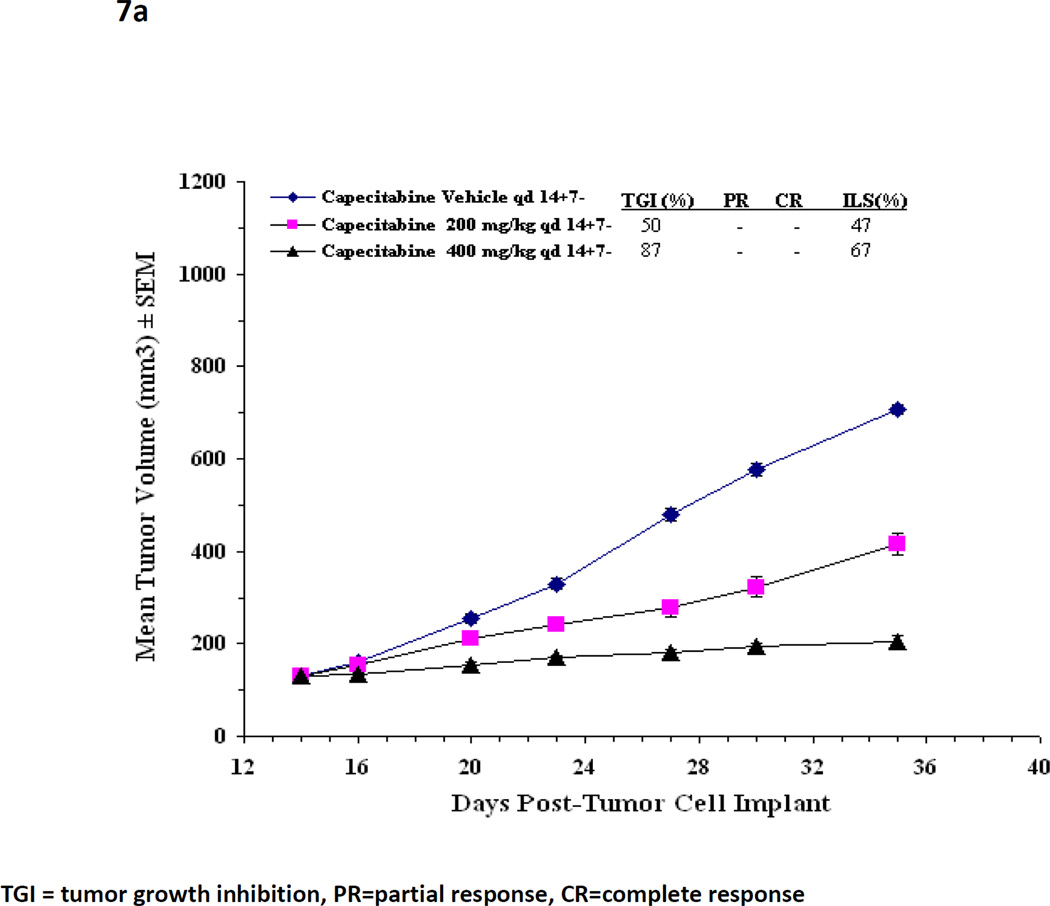
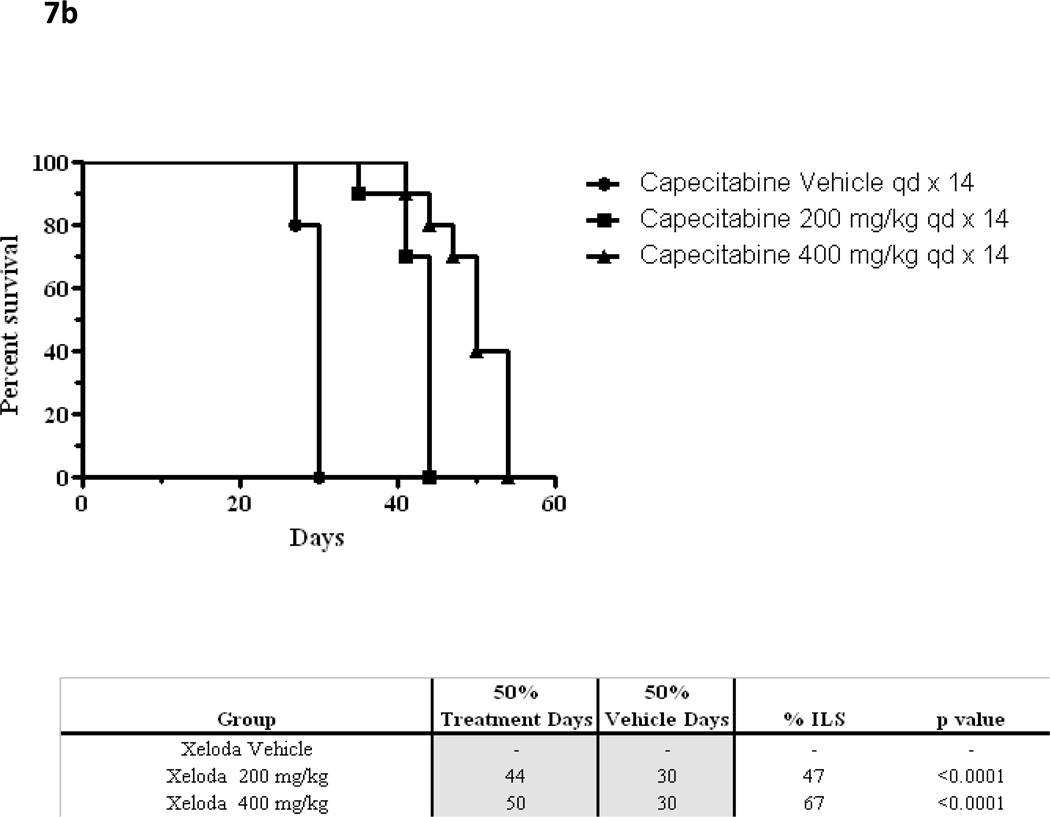
On the basis of the analysis done with MX-1, an experiment using a second xenograft system (KPL-4), compared (7 - 7) dosing with conventional (14—7) dose scheduling[41]. The KPL-4 cell-line was chosen to confirm findings in more than one breast cancer xenograft model known to be responsive to capecitabine. The (7 – 7) schedule was chosen to facilitate clinical extrapolation. Preclinical xenograft experiments in the KPL-4 model previously determined that the maximum tolerated dose (MTD) of capecitabine when administered on the conventional schedule (14 - 7) is 400 mg/kg/day. At this dose level, capecitabine slows tumor growth compared with control (% tumor growth inhibition TGI, p<0.05 both treated groups), and improves survival (% ILS, p<0.05 both treated groups) but does not cause tumor regression (Figure 7) [41].
Figure 7.
(a) In a KPL4 xenograft, mean tumor volumes over time are shown for capecitabine dosing by conventional schedule (14 – 7) at two dose levels and control. The maximum tolerated dose of capecitabine 14—7 has previously been established at 400mg/kg/d.
(b) Kaplan Meier survival curves for capecitabine at escalating doses when administered by conventional schedule (14—7).
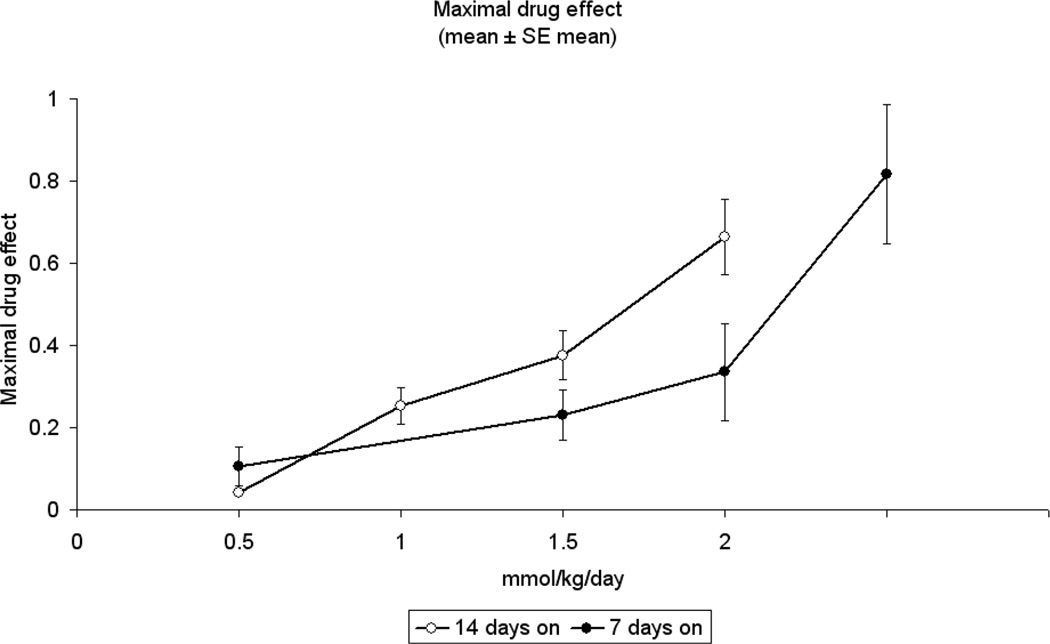
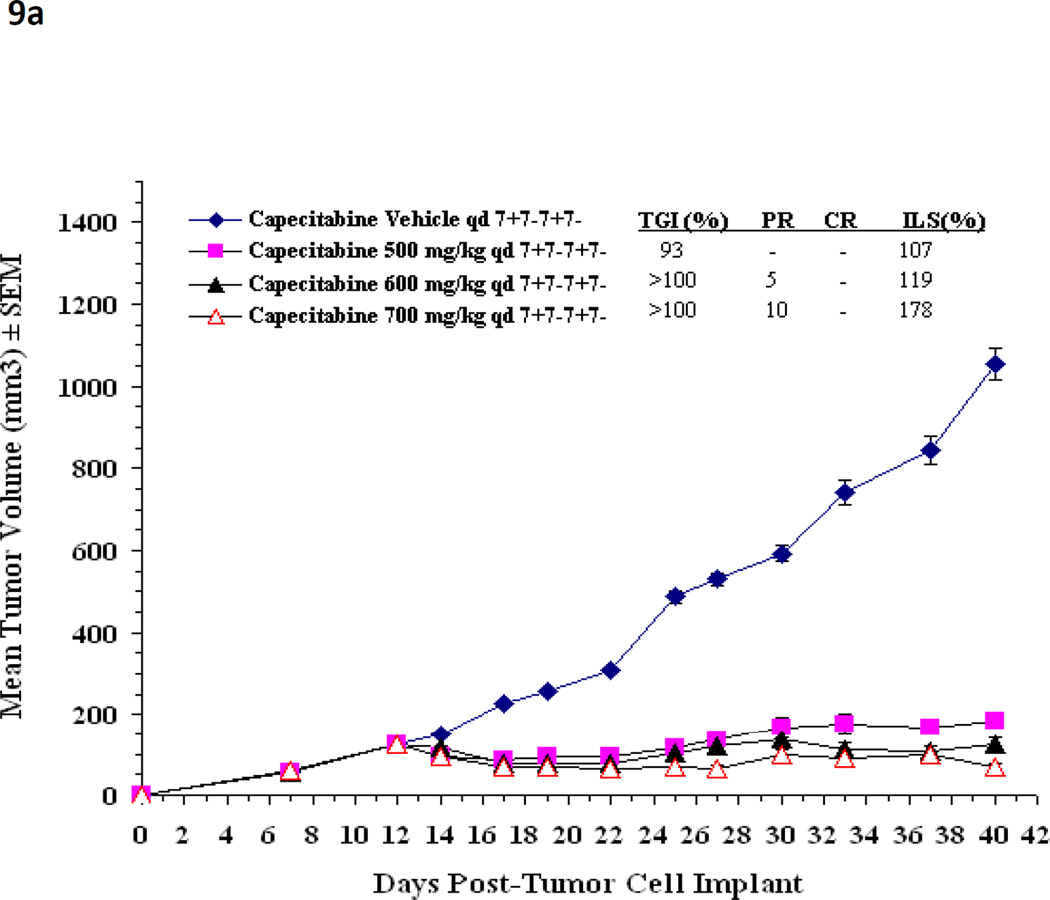
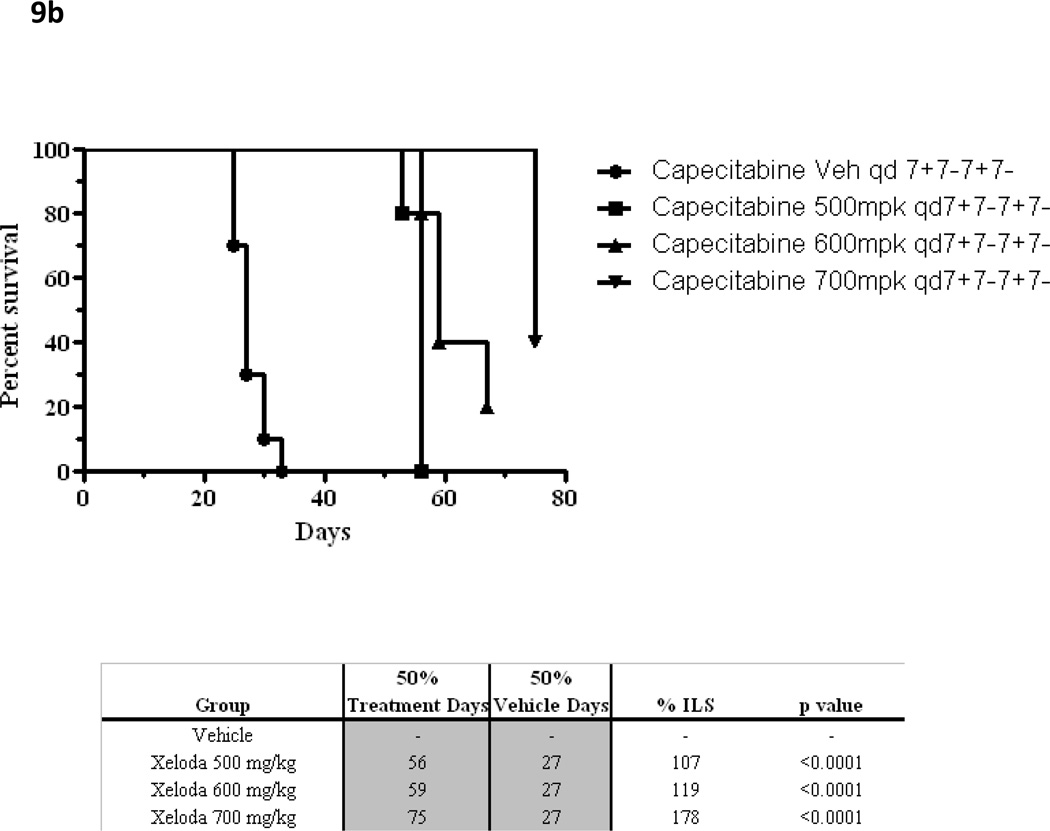
Using the methods described above, the maximal drug effect was determined for these 2 schedules when escalating doses of capecitabine were delivered daily. The 7 - 7 schedule permitted delivery of higher daily doses, yielding increased maximal drug effect compared with the 14 - 7 schedule (Figure 8). Similarly designed xenograft experiments testing capecitabine 7 - 7 achieved a significantly higher MTD (700 mg/kg/day) than previously possible on the 14 - 7 schedule[42]. In fact, dose escalation to 700 mg/kg/day had significantly higher antitumor activity when compared to the 500 mg/kg/day dose level (P<.001) or the 600 mg/kg/day dose level (P=.009) by the Mann Whitney Rank Sum test. As predicted by our mathematical model, the capecitabine 7 - 7 dosing schedule achieved greater antitumor activity. The 7 - 7 dosing schedule was associated with increased tumor growth inhibition, increased survival compared to vehicle control (all groups p<0.05 for %TGI and %ILS respectively) and, more importantly, with significant tumor regressions (Figure 9). Hence, the effect of multiple cycles of properly dosed and scheduled capecitabine follows the simulated pattern illustrated in Figure 2E.
Figure 8.
The maximal drug effect is summarized for KPL4 xenografts when given capecitabine at increasing doses. The solid circles represent the 7—7 schedule; open circles represent control (14—7). Capecitabine at 2.5mmol/kg/day was not deliverable at the 14—7 schedule due to mortality for study mice.
Figure 9.
(a) In a KPL4 xenograft, the mean tumor volume over time is shown for capecitabine 7—7 when administered at increasing dose level and control.
(b) Kaplan Meier survival curves for capecitabine at escalating doses when administered at the 7—7 dosing schedule.
DISCUSSION
Using our mathematical method, these data indicate that the maximum benefit from capecitabine occurs ~8–10 days after the start of therapy. Administration of additional drug beyond the point of maximum anticancer impact may contribute to additional toxicity without necessarily augmenting therapeutic benefit. Hence, the second week of administration in a conventional 14 - 7 capecitabine schedule may contribute more to the toxicity of treatment than to its anticancer effect. Cumulative toxicity over multiple cycles may result, unbalanced by therapeutic gain.
The 7—7 dosing schedule of capecitabine, predicted to be optimal by our model, appears to be supported by data from our preclinical xenograft experiments testing this hypothesis. Capecitabine 7—7 dosing demonstrated a higher MTD, with improved tumor regression and survival when compared to historical and preclinical controls (14—7).
We posit that a practical capecitabine dosing schedule of 7 days of therapy followed by a 7-day rest will maximize the benefit/toxicity ratio of this drug in clinical practice. Furthermore, the preclinical work described herein suggests that higher daily doses of drug may be delivered safely when this biweekly schedule is followed. This may increase the efficacy of the drug if the suggestion from our preclinical work of a rising dose-response relationship is established clinically.
While prospective clinical trials have explored alternate dosing strategies for capecitabine, many of these used the drug in combination with other cytotoxic therapies. A dose-escalation trial of biweekly capecitabine in combination with oxaliplatin for the treatment of advanced colorectal cancer defined the maximum tolerated dose of capecitabine in this regimen as 3,500 mg/m2/day[43]. Dose limiting toxicities included gastrointestinal symptoms such as diarrhea, nausea, vomiting and palmar plantar erythrodysesthesia. The 7 - 7 schedule was thus shown to be feasible and safe, but its single-agent efficacy or contribution to efficacy in this combination compared with the conventional schedule cannot be determined from this trial. A second randomized phase II trial explored high-dose gemcitabine with or without biweekly capecitabine for the treatment of metastatic pancreatic cancer[44]. Patients received capecitabine at 2,500 mg/m2/day for 7 days followed by a 7-day rest period. The results suggest that the combination regimen was well tolerated as ≥Grade 3 toxicities were infrequent. Comparative efficacy, however, remains indeterminate because of trial design.
Mathematical analysis of our preclinical data together with supporting results from prospective animal experiments has led to the hypothesis that capecitabine 7 - 7 may have an optimal efficacy/toxicity ratio compared with the conventional 14 - 7 schedule. We have completed a phase I clinical trial in patients with advanced breast cancer supporting this hypothesis[45]. Based on additional preclinical support, phase II studies of capecitabine 7 - 7 in combination with biological agents are ongoing[46, 47]. Furthermore, a prospective, randomized, phase III trial of the comparative efficacy and toxicity of the novel schedule versus the conventional schedule is planned through the SLACOM cooperative group. This modeling approach is also being applied early in the development of a new, cytotoxic agent and phase I/II studies are ongoing to explore predicted schedules clinically. [48]
Moving new anticancer agents expeditiously and economically through preclinical testing into clinical trials at optimal dose levels and schedules is one of the significant challenges in experimental oncology. There is an ethical as well as pragmatic imperative for defining methods to better accomplish this goal. Inordinate and unnecessary toxicity to patients, discontinuation of active regimens because of toxicity while the disease is still responsive, and rejection of potentially active new agents in the development process are just some of the unfortunate consequences of choosing suboptimal dose schedules for testing and marketing. The mathematical approaches described in this paper may be an efficient way of ameliorating this situation, which we intend to study further in the context of new drugs, drug combinations, and other novel therapeutics.
ACKNOWLEDGMENTS
The authors wish to thank Carol A. Pearce, MFA, MSKCC Department of Medicine Writer/Editor, for her review of this manuscript. We would also like to thank Yutaka Tanaka, Chugai Pharmaceutical Co Ltd, Kamakura, Japan, for performing the early MX-1 xenograft experiments for us.
APPENDIX
Gompertzian Growth
This pattern is described by the differential equation
where N(t) is the population size as a function of time t and α and β are constants such that:
Mathematical Representation of Hypothetical Responses to Dosing
If the Gompertzian growth perturbation due to treatment is expressed as a function of time, D(t), the above equation becomes:
Thus, if a tumor’s unperturbed growth prior to therapy is fit so as to estimate parameters α, β, and N(0), curve-fitting to the curve after initiation of therapy at time TRx may be used to determine the function D(t). D(t) is zero for values of t before TRx and greater than or equal to zero thereafter. It is a logical consequence of this formulation that the maximum anticancer effect at a time T > TRx would result from maximizing the definite integral while minimizing T –TRx.
REFERENCES
- 1.Chu E. Pharmacology of Cancer Chemotherapy: Drug Development. In: DeVita HaR., editor. Cancer Principles and Practice of Oncology. New York: Lippincott Williams and Wilkins; 2005. pp. 307–317. [Google Scholar]
- 2.Takimoto C. Pharmacology of Cancer Chemotherapy: Pharmacokinetics. In: DeVita HaR., editor. Cancer Principles and Practice of Oncology. New York: Lippincott Williams & Wilkins; 2005. pp. 317–327. [Google Scholar]
- 3.Fisher B, et al. Increased intensification and total dose of cyclophosphamide in a doxorubicin-cyclophosphamide regimen for the treatment of primary breast cancer: findings from National Surgical Adjuvant Breast and Bowel Project B-22. J Clin Oncol. 1997;15(5):1858–1869. doi: 10.1200/JCO.1997.15.5.1858. [DOI] [PubMed] [Google Scholar]
- 4.Henderson IC, et al. Improved outcomes from adding sequential Paclitaxel but not from escalating Doxorubicin dose in an adjuvant chemotherapy regimen for patients with node-positive primary breast cancer. J Clin Oncol. 2003;21(6):976–983. doi: 10.1200/JCO.2003.02.063. [DOI] [PubMed] [Google Scholar]
- 5.Winer EP, et al. Failure of higher-dose paclitaxel to improve outcome in patients with metastatic breast cancer: cancer and leukemia group B trial 9342. J Clin Oncol. 2004;22(11):2061–2068. doi: 10.1200/JCO.2004.08.048. [DOI] [PubMed] [Google Scholar]
- 6.Peters WP, et al. High-dose chemotherapy and peripheral blood progenitor cell transplantation in the treatment of breast cancer. Oncologist. 2000;5(1):1–13. doi: 10.1634/theoncologist.5-1-1. [DOI] [PubMed] [Google Scholar]
- 7.Norton L, et al. Predicting the course of Gompertzian growth. Nature. 1976;264:542–545. doi: 10.1038/264542a0. [DOI] [PubMed] [Google Scholar]
- 8.Norton L, Simon R. The growth curve of an experimental solid tumor following radiotherapy. Journal of the National Cancer Institue. 1977;58:1735–1741. doi: 10.1093/jnci/58.6.1735. [DOI] [PubMed] [Google Scholar]
- 9.Norton L, Simon R. Tumor size, sensitivity to therapy, and design of treatment schedules. Cancer Treatment Reports. 1977;61(7):1307–1315. [PubMed] [Google Scholar]
- 10.Norton L, Simon R. The Norton-Simon hypothesis revisited. Cancer Treatment Reports. 1986;70:163–169. [PubMed] [Google Scholar]
- 11.Speer J, et al. A stochastic numerical model of breast cancer that simulates clinical data. Cancer Res. 1984;44:4124. [PubMed] [Google Scholar]
- 12.Spratt JA, et al. Mammographic assessment of human breast cancer growth and duration. Cancer. 1993;71(6):2020–2026. doi: 10.1002/1097-0142(19930315)71:6<2020::aid-cncr2820710616>3.0.co;2-#. [DOI] [PubMed] [Google Scholar]
- 13.Spratt JA, et al. Decelerating growth and human breast cancer. Cancer. 1993;71(6):2013–2019. doi: 10.1002/1097-0142(19930315)71:6<2013::aid-cncr2820710615>3.0.co;2-v. [DOI] [PubMed] [Google Scholar]
- 14.Koscielny S, Tubiana M, Valleron AJ. A simulation model of the natural history of human breast cancer. Br J Cancer. 1985;52(4):515–524. doi: 10.1038/bjc.1985.222. [DOI] [PMC free article] [PubMed] [Google Scholar]
- 15.Norton L. A Gompertzian model of human breast cancer growth. Cancer Research. 1988;48:7067–7071. [PubMed] [Google Scholar]
- 16.Norton L. Evolving concepts in the systemic drug therapy of breast cancer. Semin Oncol. 1997;24(4) Suppl 10:S10-3–S10-10. [PubMed] [Google Scholar]
- 17.Norton L. Theoretical concepts and the emerging role of taxanes in adjuvant therapy. Oncologist. 2001;6 Suppl 3:30–35. doi: 10.1634/theoncologist.6-suppl_3-30. [DOI] [PubMed] [Google Scholar]
- 18.Piccart-Gebhart MJ. Mathematics and oncology: a match for life? J Clin Oncol. 2003;21(8):1425–1428. doi: 10.1200/JCO.2003.12.068. [DOI] [PubMed] [Google Scholar]
- 19.Norton L. Conceptual and practical implications of breast tissue geometry: toward a more effective, less toxic therapy. Oncologist. 2005;10(6):370–381. doi: 10.1634/theoncologist.10-6-370. [DOI] [PubMed] [Google Scholar]
- 20.Bonadonna G, Zambetti M, Valagussa P. Sequential or alternating doxorubicin and CMF regimens in breast cancer with more than three positive nodes. Ten-year results. Jama. 1995;273(7):542–547. [PubMed] [Google Scholar]
- 21.Skipper HE. Kinetics of mammary tumor cell growth and implications for therapy. Cancer. 1971;28(6):1479–1499. doi: 10.1002/1097-0142(197112)28:6<1479::aid-cncr2820280622>3.0.co;2-m. [DOI] [PubMed] [Google Scholar]
- 22.Skipper H. Analysis of multiarmed trials in which animals bearing different burdens of L1210 leukemia cells were treated with 2, 3, and 4 drug combinations delivered in different ways with varying dose intensities of each drug and varying average dose intensities. Southern Research Institute Booklet 7. 1986;420:87–92. [Google Scholar]
- 23.Citron ML, et al. Randomized trial of dose-dense versus conventionally scheduled and sequential versus concurrent combination chemotherapy as postoperative adjuvant treatment of node-positive primary breast cancer: first report of Intergroup Trial C9741/Cancer and Leukemia Group B Trial 9741. J Clin Oncol. 2003;21(8):1431–1439. doi: 10.1200/JCO.2003.09.081. [DOI] [PubMed] [Google Scholar]
- 24.Citron M, et al. Dose-dense (DD) AC followed by paclitaxel is associated with moderate, frequent anemia compared to sequential (S) and/or less DD Treatment: Update by CALGB on Breast Cancer Intergroup Trial C9741 with ECOG, SWOG, & NCCTG. American Society of Clinical Oncology. 2005 [Google Scholar]
- 25.Miwa M, et al. Design of a novel oral fluoropyrimidine carbamate, capecitabine, which generates 5-fluorouracil selectively in tumours by enzymes concentrated in human liver and cancer tissue. Eur J Cancer. 1998;34(8):1274–1281. doi: 10.1016/s0959-8049(98)00058-6. [DOI] [PubMed] [Google Scholar]
- 26.Blum JL, et al. Multicenter, Phase II study of capecitabine in taxane-pretreated metastatic breast carcinoma patients. Cancer. 2001;92(7):1759–1768. doi: 10.1002/1097-0142(20011001)92:7<1759::aid-cncr1691>3.0.co;2-a. [DOI] [PubMed] [Google Scholar]
- 27.Blum JL, et al. Multicenter phase II study of capecitabine in paclitaxel-refractory metastatic breast cancer. J Clin Oncol. 1999;17(2):485–493. doi: 10.1200/JCO.1999.17.2.485. [DOI] [PubMed] [Google Scholar]
- 28.Reichardt P, et al. Multicenter phase II study of oral capecitabine (Xeloda(")) in patients with metastatic breast cancer relapsing after treatment with a taxane-containing therapy. Ann Oncol. 2003;14(8):1227–1233. doi: 10.1093/annonc/mdg346. [DOI] [PubMed] [Google Scholar]
- 29.O'Shaughnessy JA, et al. Randomized, open-label, phase II trial of oral capecitabine (Xeloda) vs. a reference arm of intravenous CMF (cyclophosphamide, methotrexate and 5-fluorouracil) as first-line therapy for advanced/metastatic breast cancer. Ann Oncol. 2001;12(9):1247–1254. doi: 10.1023/a:1012281104865. [DOI] [PubMed] [Google Scholar]
- 30.Food and Drug Administration. FDA approves Xeloda for breast cancer. U.S. Department of Health and Human Services; 1998. [Google Scholar]
- 31.Food and Drug Administration. FDA Approves Xeloda in Combination with Taxotere for Advanced Breast Cancer. US Dept of Health and Human Services; 2001. [Google Scholar]
- 32.Perez EA, et al. Efficacy and safety of ixabepilone (BMS-247550) in a phase II study of patients with advanced breast cancer resistant to an anthracycline, a taxane, and capecitabine. J Clin Oncol. 2007;25(23):3407–3414. doi: 10.1200/JCO.2006.09.3849. [DOI] [PubMed] [Google Scholar]
- 33.Geyer CE, et al. Lapatinib plus capecitabine for HER2-positive advanced breast cancer. N Engl J Med. 2006;355(26):2733–2743. doi: 10.1056/NEJMoa064320. [DOI] [PubMed] [Google Scholar]
- 34.Budman DR, et al. Preliminary studies of a novel oral fluoropyrimidine carbamate: capecitabine. J Clin Oncol. 1998;16(5):1795–1802. doi: 10.1200/JCO.1998.16.5.1795. [DOI] [PubMed] [Google Scholar]
- 35.Mackean M, et al. Phase I and pharmacologic study of intermittent twice-daily oral therapy with capecitabine in patients with advanced and/or metastatic cancer. J Clin Oncol. 1998;16(9):2977–2985. doi: 10.1200/JCO.1998.16.9.2977. [DOI] [PubMed] [Google Scholar]
- 36.Van Cutsem E, et al. Capecitabine, an oral fluoropyrimidine carbamate with substantial activity in advanced colorectal cancer: results of a randomized phase II study. J Clin Oncol. 2000;18(6):1337–1345. doi: 10.1200/JCO.2000.18.6.1337. [DOI] [PubMed] [Google Scholar]
- 37.Miller KD, et al. Randomized phase III trial of capecitabine compared with bevacizumab plus capecitabine in patients with previously treated metastatic breast cancer. J Clin Oncol. 2005;23(4):792–799. doi: 10.1200/JCO.2005.05.098. [DOI] [PubMed] [Google Scholar]
- 38.Hennessy BT, et al. Lower dose capecitabine has a more favorable therapeutic index in metastatic breast cancer: retrospective analysis of patients treated at M.D. Anderson Cancer Center and a review of capecitabine toxicity in the literature. Ann Oncol. 2005;16(8):1289–1296. doi: 10.1093/annonc/mdi253. [DOI] [PubMed] [Google Scholar]
- 39.Yanagisawa M, F-Ouchi K, Tanaka Y. Optimal dosing schedule of capecitabine administration in human mammary tumor xenograft models. Proc AACR. 2004:225. [Google Scholar]
- 40.Norton L, et al. Annual Meeting of American Association for Cancer Research. Anaheim, CA: 2005. Optimizing Chemotherapeutic Dose-Schedule (CDS) by Norton-Simon Modeling: Capecitabine (Xeloda®) [Google Scholar]
- 41.Higgins B, et al. Antitumor activity of capecitabine and bevacizumab combination in a human estrogen receptor-negative breast adenocarcinoma xenograft model. Anticancer Res. 2007;27(4B):2279–2287. [PubMed] [Google Scholar]
- 42.Traina T, et al. In Vivo Activity of a Novel Regimen of Capecitabine in a Breast Cancer Xenograft Model. Breast Cancer Research and Treatment; San Antonio Breast Cancer Symposium Proceedings; 2006. p. Abstract 6071. [Google Scholar]
- 43.Scheithauer W, et al. Intermittent weekly high-dose capecitabine in combination with oxaliplatin: a phase I/II study in first-line treatment of patients with advanced colorectal cancer. Ann Oncol. 2002;13(10):1583–1589. doi: 10.1093/annonc/dkf281. [DOI] [PubMed] [Google Scholar]
- 44.Scheithauer W, et al. Biweekly high-dose gemcitabine alone or in combination with capecitabine in patients with metastatic pancreatic adenocarcinoma: a randomized phase II trial. Ann Oncol. 2003;14(1):97–104. doi: 10.1093/annonc/mdg029. [DOI] [PubMed] [Google Scholar]
- 45.Traina TA, et al. Phase I study of a novel capecitabine schedule based on the Norton-Simon mathematical model in patients with metastatic breast cancer. J Clin Oncol. 2008;26(11):1797–1802. doi: 10.1200/JCO.2007.13.8388. [DOI] [PubMed] [Google Scholar]
- 46.Traina T, et al. Safety of a novel capecitabine dosing schedule when combined with lapatinib in patients with HER2-positive metastatic breast cancer refractory to trastuzumab. Journal of Clinical Oncology. 2009;27(18S) [Google Scholar]
- 47.Traina TA, et al. A novel capecitabine dosing schedule combined with bevacizumab is safe and active in patients with metastatic breast cancer: A phase II study. J Clin Oncol. 2008 May 20;26 suppl doi: 10.1200/JCO.2007.13.8388. abstr 1101. [DOI] [PubMed] [Google Scholar]
- 48.Lewis J, et al. Evaluation of indibulin, a novel tubulin targeting-agent, in combination with capecitabine, with mathematically optimized dose scheduling. J Clin Oncol (Meeting Abstracts) 2009;27(15s) suppl abstr 2538. [Google Scholar]


