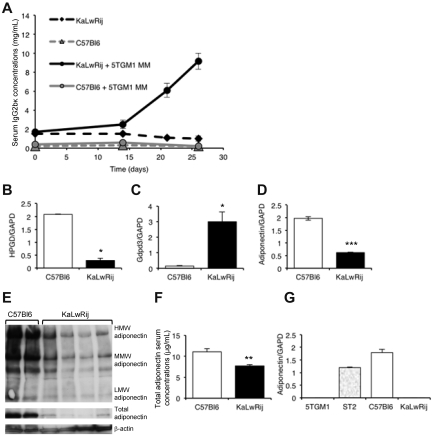
Figure 1.
Comparison of permissive KaLwRij and non-permissive C57Bl6 bone marrow microenvironments. (A) Tumor burden in non-permissive C57Bl6 and myeloma-permissive KaLwRij mice inoculated with 5TGM1 myeloma cells, determined by measuring myeloma-specific IgG2bκ concentrations. P < .01. n = 8. (B-D) Quantitative RT-PCR measurements of hydroxyprostaglandin dehydrogenase 15 (NAD HPGD), glycerophosphodiesterase domain containing 3 (Gdpd3), and adiponectin/GAPDH ratio in C57Bl6 and KaLwRij bone marrow. (E) Expression of adiponectin in bone marrow from C57Bl6 and KaLwRij mice was determined by Western blot. Each lane represents bone marrow from an individual mouse. (F) Serum concentrations of adiponectin in C57Bl6 and KaLwRij mice. (G) Quantitative RT-PCR measurements of adiponectin expression in 5TGM1 myeloma cells, and ST2, C57Bl6, and KaLwRij BM stromal cells (see also supplemental Figure 1). Data are mean ± SEM. *P < .05, **P < .01, and ***P < .001, compared with C57Bl6.

