

Abstract
This study was designed to investigate the effects of hypertonic/hyperoncotic solution on blood-brain barrier damage, brain edema and morphological changes of rats during whole body hyperthermia. 90 adult male Sprague-Dawley rats were randomized into 5 groups: Control group (a room temperature for 4 hours); Whole body hyperthermia group without solution treatment; Whole body hyperthermia group with Ringer's solution treatment; Whole body hyperthermia group with hydroxyethyl starch and Ringer's solution treatment; Whole body hyperthermia group with Hypertonic/hyperoncotic solution treatment. All rats except those of control group were housed in a heated container and maintained at 36°C for 3 hours until the rectal temperature reached 41-42°C. Corresponding solutions were administered intravenously at the beginning of whole body hyperthermia within 30 minutes as designed. Following whole body hyperthermia, rats were subsequently cooled down for 1h. Evans blue was administered intravenously when the rectal temperature was cooled down to 37°C. The leakage of Evans blue-albumin and water content of brain were calculated and morphological changes were investigated. In group with hypertonic/hyperoncotic solution treatment, brain water content and the leakage of Evans blue-albumin were the lowest among the four whole body hyperthermia groups. Compared with the other three whole body hyperthermia groups, in which profound to moderate damages to blood-brain barrier and brain tissue and cells were found, there were only slight morphological changes in the group with hypertonic/hyperoncotic solutionon treatment. Treatment with hypertonic/hyperoncotic solution appeared to attenuate the injury to blood-brain barrier and reduce brain edema and cell morphological changes in whole body hyperthermia rats.
Keywords: Whole body hyperthermia, hypertonic/hyperoncotic solution, brain morphological changes, brain edema, blood-brain barrier
Introduction
Whole body hyperthermia (WBH) has been a clinical thermotherapy approach to treat some malignant tumor and infectious diseases. But extensive vasodilatation and profuse sweating inevitably occur during the process of WBH resulting in hemodynamic instability. A great quantity of crystal or colloid solution or even vasoactive drugs has to be administered to correct this instability. Large volumes of infused fluids infused can sometimes lead to some side-effects such as pulmonary edema and heart failure during WBH [1-3]. Hypertonic/ hyperoncotic solution (HHS) is composed of 4.2% sodium chloride and 7.6% Hydroxyethyl starch 40. Its beneficial effects in the emergency treatment of shock and traumatic brain injury with relative small volume have been well described in many other studies [4-6]. Previous experiments in our clinical researches on WBH suggested that intravenous administration of 3.75% HHS 8 ml/kg could reduce the need for crystalloid solution and/or colloid solution, while improving the hemodynamics [7] and reducing the incidence of pulmonary edema. But its effects on brain tissue during WBH are not clear. Our previous animal studies showed that the elevation of internal body temperature to 41-42°C would lead to the leakage of Evans blue-albumin (EB-albumin) across the blood-brain barrier (BBB) and injuries to brain neurons [8]. The present investigation was undertaken to find out how intravenously administered HHS affected the injury to the BBB, brain edema and morphological changes in rats during WBH. We hypothesized that the damages to BBB, the formation of edema and morphological changes in this rat model of hyperthermia would be attenuated the most by the HHS treatment.
Materials and methods
Animal model of WBH
The current study was approved by the animal experimental ethics committee of Southern Medical University, China and all procedures were carried out according to animal welfare policies of the National Institutes of Health Guidelines for Care and Handling of Animals. Ninety male specific pathogen-free Sprague-Dawley rats (220-300g) were housed at controlled ambient temperature (22±1°C) with a light/dark cycle and free access to food and water. They were randomly allocated to different experimental groups by using random digits table. Rats kept at room temperature for four hours were used as controls. Rats in the WBH group were kept in a biological oxygen demand incubator (BOD, wind velocity 25 cm/sec) for 3 hours. For imitation of the climate in southern China and condition of clinical hyperthermia, the relative humidity was set at 65%) were maintained at 36 °C for three hours and then maintained at room temperature to cool down for about one hour [8]. Femoral artery and vein cannulas were respectively inserted for monitoring mean arterial blood pressure (MAP)and infusion after all rats were anesthetized with 3% pentobarbital. MAP and rectal temperature (T) were recorded through transducers connected to a monitor (Ohmida Datex, USA). Arterial blood gas and electrolytes analysis were respectively performed with a blood gas analyser (NOVA CCX, USA) at the beginning of WBH, at the end of solution administration and at the end of WBH.
Experimental protocol
Rats were randomly allocated into five groups (n=18 per group): (i) Control group, rats were kept at room temperature (22±1°C) for 4 hours without any treatment (C group); (ii) HT group, rats were exposed to WBH without solution treatment; (iii) RS group, rats were exposed to WBH with Ringer's solution treatment and 3.6ml/100g Ringer's solution was infused at the beginning of WBH; (iv) HRS group, rats were exposed to WBH with hydroxyethyl starch and Ringer's solution treatment and 1.8ml/100g Ringer's solution+0.9ml/100g hydroxyethyl starch 130/0.4 (Voluven, 6% HES 130/0.4, 14BE7338, Fresenlus Kabi Deutschland GmbH, Germany) were infused at the beginning of WBH; (v) HHS group, rats were exposed to WBH with Hypertonic/hyperoncotic solution (HHS, i.e. Holme, is composed of 4.2% sodium chloride and 7.6% Hydroxyethyl starch 40 with an osmotic pressure of 1440mOsm/L. 08011802, Shanghai Huayuan Changfu CO. LTD., China) treatment and 0.8ml/100g HHS were infused at the beginning of WBH. On average, 1ml HHS can expand the volume of effective circulation by 4.5ml and this effect can last as long as four hours after 5 to 10 minutes of its application [9]. It has also been demonstrated that, during WBH, the administration of HHS at 8ml/kg could reduce the amount of solution needed and could effectively maintain hemodynamic stability [7]. For reasons above, we employed the fluid therapy scheme described above.
Two stages exist in an integrity WBH treatment. In the first stage, rats were kept in a heated container at 36°C for 3h until the rectal temperature reached 41-42°C. And subsequently in the second stage, rats were cooled down for 1h. Different solutions were infused intravenously within 30 minutes at the beginning of WBH as designed. Among eighteen rats in three groups, six rats were used to investigate BBB injury and brain water content, six for morphological evaluations of the brain with light microscopy, and the remaining six for morphological evaluations of the brain with electron microscopy.
Determination of EB-albumin leakage in brain tissue
To determine the injury of BBB at the end of WBH, EB (2%, 3 mL/kg) were administered into right femoral vein and allowed to circulate and distribute for 5 minutes when the rats' rectal temperature was cooled to 37°C (about one hour after they were moved out of BOD) [10, 14]. The rats were rinsed with 150 ml normal saline solution and subsequently perfused with 200 ml of PBS by transcardiac infusion. Brain tissue samples (0.2∼0.3 g) from right brain hippocampus were dissected out and weighed immediately to record wet weight. After homogenization of these samples in 3 ml of 0.1 M PBS and centrifugation at 1,500 g for 5 min at 4°C, 0.7 ml of the supernatant was mixed with 0.7 ml of 100% (w/v) trichloroacetic acid. The mixture was incubated at 4°C for 18 h and then centrifuged at 1,500 g for 10 min at 4°C. The concentration of EB-albumin in the supernatant was determined at 632 nm with a spectrophotometer. The content of EB-albumin (μg/g brain tissue wet weight) was calculated by comparing it with standard solution.
Measurement of the water content of brain tissue
The formation of brain edema was investigated by using the water content of brain tissue obtained from the difference between wet and dry weight of the samples. After their wet weight was determined as described above, all brain tissue samples were incubated at 90°C for 72 hours to determine their dry weight. Brain water content was calculated by (wet weight — dry weight)/ wet weight × 100% [11].
Evaluation of brain tissue structure changes
At the end of WBH, all rats were rinsed with 150ml of 37°C saline containing 15,000U heparin. Then the rats were perfused with 200ml of ice-cooled fixative (2% glutaraldehyde, 4% paraformaldehyde in 0.1M PBS) for 20-25 minutes and subsequently were fixated by 300ml of the same fixative for two hours.
To investigate the structure changes with light microscopy, tissue samples of hippocampus were fixated for 48 hours in 0.1M PBS containing 4% paraformaldehyde at 4°C. Then the samples were dehydrated with alcohol and embedded in paraffin, and approximately 3μm thick paraffin sections in coronal plane were cut and stained with hematoxylin and eosin (H & E) [12].
To investigate the structure changes with electron microscopy, 1mm3 of hippocampus were postfixed in 0.1M PBS containing 2% glutaraldehyde for overnight in at 4°C and then were dehydrated with alcohol and embedded in Epon [13]. Before being inspected with a Hitachi H7500 transmission electron microscope, samples were cut into ultrathin sections by using a diamond knife on a LKB Ultramicrotome and stained with lead acetate and uranyl citrate.
Statistical analysis
Values in the text and figures were presented as means ± standard errors (SD) and analyzed by using SPSS 13.0 software (SPSS Inc., Chicago, IL, USA). One-way analysis of variance (ANOVA) was used for multiple comparisons between groups and the least significant difference test was used for intragroup comparison. A P-value less than 0.05 was considered significant.
Results
Mean body mass and baseline rectal temperature of the rats did not differ among all five groups. The increase of rectal temperature during WBH showed no significant difference among the four WBH groups (Figure 1).
Figure 1.

Rectal temperature changes of rats in five groups (n=12).
Changes of MAP
As shown in Figure 2, from 45 min after the initiation of WBH to the end of the study (240 min), MAP was significantly decreased in the HT group when compared to baseline MAP and to MAP in the C group. During the final 75-90 min, MAP in the RS group and HRS group was significantly decreased when compared with MAP in the C group.
Figure 2.
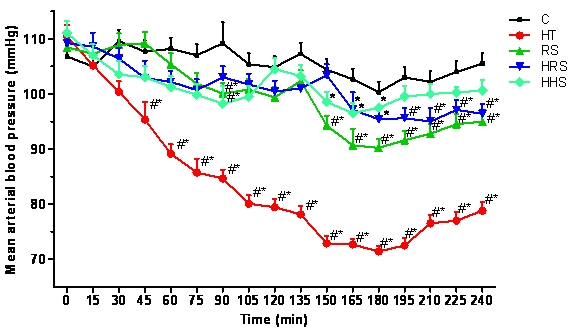
MAP changes of rats in five groups (n=12). *P<0.05 vs the control group; #P<0.05 vs T0.
Electrolytes and arterial blood gas analysis
Before the initiation of WBH, there were no significant differences in hematocrit, arterial pH, PaO2, PaCO2, concentration of Na+ and K+ in the five groups. When compared to the C group or the beginning of WBH, hematocrit, PH, PaO2, and PaCO2 values significantly changed during WBH in all WBH groups except hematocrit in the HHS group. The concentration of Na+ and K+ increased significantly both in the HT group and the HHS group. Although the concentration of Na+ increased after HHS was infused, it was almost normal at the end of WBH (Table 1).
Table 1.
Changes of electrolytes and arterial blood gas analysis in rats in five groups
| Type of expt. | Groups | at the beginning of WBH | at the end of iv. solution | at the end of WBH |
|---|---|---|---|---|
| C | 39.16±3.65 | 40.65±3.10 | 40.43±3.38 | |
| HT | 39.68±2.39 | 41.36±2.75##** | 43.22±3.06##** | |
| haematocrit (%) | RS | 41.56±3.32 | 37.34±3.56##* | 38.32±4.88# |
| HRS | 40.45±3.68 | 37.48±4.15##* | 38.55±2.67## | |
| HHS | 38.66±2.82 | 38.34±2.22 | 39.64±2.36 | |
| C | 7.41±0.07 | 7.40±0.04 | 7.41±0.05 | |
| HT | 7.40±0.06 | 7.35±0.04#** | 7.29±0.05##** | |
| pH | RS | 7.42±0.04 | 7.40±0.05** | 7.37±0.06#** |
| HRS | 7.40±0.05 | 7.38±0.06** | 7.36±0.05##** | |
| HHS | 7.40±0.07 | 7.38±0.07** | 7.36±0.06##** | |
| C | 38.38±3.68 | 38.66±3.62 | 38.23±3.56 | |
| HT | 39.77±4.10 | 43.86±3.44#** | 46.44±2.65##** | |
| PaCO2 (mmHg) | RS | 38.89±4.15 | 40.45±4.38** | 41.63±3.56#** |
| HRS | 40.26±4.09 | 41.11±4.18** | 42.31±4.36##** | |
| HHS | 39.21±4.37 | 40.90±4.01** | 41.56±3.46#** | |
| C | 88.45±2.66 | 87.65±3.22## | 88.13±3.76## | |
| HT | 88.29±3.76 | 77.54±4.32#** | 59.57±3.52##** | |
| PaO2(mmHg) | RS | 88.67±3.75 | 77.23±4.39##** | 66.73±3.43##** |
| HRS | 89.08±4.22 | 79.45±5.44##** | 66.36±4.33##** | |
| HHS | 89.13±3.89 | 82.98±4.13## | 73.57±4.68##** | |
| C | 139.48±3.12 | 140.01±3.43 | 140.17±3.56 | |
| HT | 138.89± 1.65 | 143.26±3.18#** | 147.33±2.19##** | |
| Na+ (mmol/L) | RS | 140.37±2.42 | 139.66±2.55 | 141.00±3.59 |
| HRS | 139.11±2.69 | 139.340±2.43 | 140.19±2.34 | |
| HHS | 139.93±2.89 | 153.20±3.86##** | 144.53±3.65##** | |
| C | 4.20±0.41 | 4.16±0.39 | 4.32±0.22 | |
| HT | 4.12±0.23 | 4.49±0.47#** | 4.45±0.82##** | |
| K+ (mmol/L) | RS | 4.23±0.13 | 4.11±0.66 | 4.12±0.45 |
| HRS | 4.09±0.39 | 4.43±0.24 | 4.37±0.46 | |
| HHS | 4.62±0.34 | 4.65±0.28##** | 4.72±0.21##** |
Datas are mean ± SD; n = 18.
P<0.05
P<0.01 vs at the beginning of WBH;
P<0.05
P<0.01 vs the control group. C= control group; HT = WBH without solution treatment group; RS= WBH with Ringer's solution intravenous injection group; HRS= WBH with hydroxyethyl starch and Ringer's solution intravenous injection group; HHS= WBH with Hypertonic/ hyperoncotic solutions intravenous injection group.
Brain water content and leakage of EB-albumin
Compared to the C group, brain water content and leakage of EB-albumin increased significantly in the four WBH groups. However, HHS treatment can partially attenuate the increase of brain water content and the leakage of EB-albumin compared with the HT group (Table 2).
Table 2.
Brain water content and EB value in five group
| Groups | Water content (%) | EB(μg/g) |
|---|---|---|
| C | 78.15±0.57 | 2.26±0.09 |
| HT | 82.83±0.54**# | 9.79±0.48**# |
| RS | 81.96±0.57** | 8.41±0.33**# |
| HRS | 80.22±0.60** | 6.98±0.61** |
| HHS | 79.15±0.26* | 5.87±0.38* |
Datas are mean ± SD; n=6.
P<0.05 vs control group
P<0.01 vs control group;
P<0.05 vs HHS group. C= control group; HT= WBH without solution treatment group; RS= WBH with Ringer's solution intravenous injection group; HRS= WBH with hydroxyethyl starch and Ringer's solution intravenous injection group; HHS= WBH with Hypertonic/hyperoncotic solutions intravenous injection group.
Light Microscopy examination
Moderate to profound hippocampus tissue and cell damage was found under microscopy in all of the WBH groups except the HHS group. Figure 3A showed the normal hippocampus tissue and cells under high power microscopy. Under low power (Figure 3B), the light micrographs of HT group showed considerable tissue damage mostly vacuolation (marked by #). Under high power (Figure 3C), the light micrographs from HT group indicated cellular edema and sponginess (@), perivascular edema ($), and darkly stained neurons (*). Compared with HT group, there were less extensive perivascular edema and vacuolation in RS group (Figure 3D, E). In HRS group, vacuolation, edema and sponginess were still obvious and neurons were not arranged in order (Figure 4F, G). While in HHS group, no significant tissue structural changes were found under low power micrograph and only insignificant edema and sponginess as well as a slightly widened perivascular gap. Continuity of neurons was visible under high power microscopy (Figure 3H, I).
Figure 3.

Moderate to profound hippocampus tissue and cell damages were found under microscopy in WBH groups except HHS group. A showed the normal hippocampus tissue and cells under high power microscopy. Under low power (B), the light micrographs of HT group showed considerable tissue damage mostly vacuolation (marked by #). Under high power (C), the light micrographs from HT group indicated cellular edema and sponginess (@), perivascular edema ($), and darkly stained neurons (*). Compared with HT group, there were less extensive perivascular edema and vacuolation in RS group (D, E). In HRS group, vacuolation, edema and sponginess were still obvious and neurons were not arranged in order (F, G). While in HHS group, no significant tissue structural changes were found under low power micrograph and only trivial edema and sponginess as well as slightly widen perivascular gap and continuous neurons were visible under high power microscopy (H, I).
Figure 4.

Ultrastructural studies further confirmed BBB and neuron damages of hippocampus in WBH groups. In HT group, there were large quantities of swollen astrocytic foot processes and perivascular edema was serious (A). While in HHS group, the structure of tight junction between endothelial cells was normal and there were much fewer swollen astrocytic foot processes and slighter perivascular edema than that in HT group (B). Swollen neurons with vacuolated cytoplasm, ruptured cloudy mitochondrion carinas and without rough endoplasmic reticulum were seen in RS group (C). But these pathologic changes were not so apparent in HHS group and clear neuron nucleoli, plenty organellae such as rough endoplasmic reticulum could be seen under electron microscopy (D). Damages to glial cells such as swollen nucleoli and vacuolated cytoplasm were found in HRS group, while not in HHS group (E), in which there were many rough endoplasmic reticulum, Golgi apparatus and mitochondria (F).Normal neuron in control group (G). Bars: A=2um; B=2um; C=2um; D=2um; E=2um; F=1um; G=2um.
Electron microscopy examination
Ultrastructural studies further confirmed BBB and neuron damages of hippocampus in WBH groups. In HT group, there were large quantities of swollen astrocytic foot processes and perivascular edema was serious (Figure 4A). In the HHS group, the structure of the tight junction between endothelial cells was normal and there were many fewer swollen astrocytic foot processes and less perivascular edema than that in the HT group (Figure 4B). Swollen neurons with vacuolated cytoplasm, ruptured cloudy mitochondrion carinas and with no rough endoplasmic reticulum were seen in RS group (Figure 4C). But these pathologic changes were not so apparent in HHS group and clear neuron nucleoli, plentiful organellae such as rough endoplasmic reticulum could be seen under electron microscopy (Figure 4D). Damages to glial cells such as swollen nucleoli and vacuolated cytoplasm were found in the HRS group, while not in HHS group (Figure 4E), in which there were many rough endoplasmic reticulum, golgi apparatus and mitochondria (Figure 4F).
Discussion
Recently it has been recognized that WBH, used as an adjunct to cytotoxic therapy for cancer, can cause inhibition of DNA repair, increased drug permeation and decreased resistance to DNA damaging agents [14]. The latest clinical and experimental results suggest that WBH enhances cytotoxic ionizing radiation and chemotherapy [15-17]. But WBH-induced severe side effects, including unstable hemodynamics and altered brain function inevitably occurred. In patients, a large volume of fluid had to be used to keep hemodynamics stable. Previous experiments in our clinical researches on WBH suggested that intravenous administration of 3.75% HHS improved the hemodynamics [7] and avoided the incidence of pulmonary edema due to the large volume of fluids required, while reducing the need for crystal solution and/or colloid solution. However, its effects on alterations of BBB during WBH are still not clear.
It was believed that WBH-induced brain dysfunction resulted from the breakdown of BBB [18]. BBB is a regulatory interface situated between capillaries and neural tissues in brain. It consists primarily of endothelium cells of capillary, basal membrane, and the foot process of glial cells. Normally to maintain the cerebral homeostasis, a micromolecular substance like H2O can freely pass through BBB, while a small molecular substance like albumin cannot. But this homeostasis is disrupted by the breakdown of BBB structure and the consequent elevated permeability to a large molecular substance such as albumin. Since Evans blue is bound to plasma albumin, the distribution of albumin can be traced in the blood and tissue. The results of the present study indicated that WBH induced the destruction of glia cell processes and the tight junction between endothelial cells resulting in the breakdown of BBB and increased BBB permeability. This was verified by the WBH-induced higher brain water content and EB-albumin leakage. Besides the breakdown of BBB, other brain pathological alterations including perivascular edema occurred following WBH in this research.
WBH treatment consists of two stages: the heating stage and cooling stage. We have observed that many patients suffered from varying degrees of brain edema at the end of WBH, thus we choose this time to make most of the measurements. The significant new findings of the present study were that HHS attenuated the WBH-induced breakdown of BBB, brain perivascular edema. HHS, a hypertonic solution described above, has the ability to increase blood flow volume in a short time by facilitating the return of liquid into blood vessels by following osmotic pressure gradient. This promotes stable hemodynamics including stable cerebral blood circulation. Data in the present study demonstrated that without treatment with HHS there was profound hypotension along with dramatically altered electrolytes and arterial blood gases during WBH. Thus we speculated that one of mechanisms by which HHS had protective effects on WBH-induced brain damages was its capacity to maintain stable hemodynamics and a stable microenvironment following heat stress.
One of the important components of HHS is HES, a synthetic colloid with molecular weight of 130kD which is unable to permeate capillaries. It had been demonstrated that HES could attenuate the increased microvascular permeability and reduce capillary leakage by mechanisms such as the electrical charge of the molecules, structural changes in the interstitial matrix, formation of vesicular transmembrane channels and even a direct sealing effect [19-21]. Moreover, HES has anti-inflammatory actions by inhibiting endotheliocyte activation and neutrophil adhesion [22-23]. Another constituent of HHS is 4.2% sodium chloride, which plays a role in increasing plasma crystal osmotic pressure. Therefore, compared to HES, HHS is a mixture of crystalloid and colloid solution. Its special hypertonic characteristic and impermeability to capillaries or even damaged capillaries together with its anti-inflammatory effect contribute to the attenuated WBH-induced BBB breakdown.
Generally, the pathophysiological changes of brain tissue was mainly caused by the factors such as arterial PCO2, PO2, PH, HCT, and body temperature, etc [24]. So we did not showed the parameters of HCO3-, base excess and O2 content in this paper, although they were also included in the results of Blood Gas Analyzer. Our results revealed that compared with the control group, data in every hyperthermia infusion groups showed a significant difference during or at the end of high temperature period, while there was no meaningful difference within the hyperthermia infusion groups. This result ruled out the possibility that the pathophysiological changes of brain tissue in each hyperthermia group were caused by the difference of acid-base balance.
In conclusion, our novel investigation suggested that treatment with HHS was capable of preventing the brain from suffering BBB breakdown and other WBH-induced severe brain neuron and tissue injury. It would be important to see whether the long term outcome of brain damage would be improved by infusion of HHS or by HHS infusion at different stages of the WBH process which would produce different effects on WBH-induced brain damage. This could be explored in future investigations.
Acknowledgments
This investigation was supported by grants from The Science and Technology Bureau of Shenzhen, China. The expert technical assistance of professor Huang Qiao-bing and Guo Jing-qiang from The Southern Medical University of China and Liu Zhi-hen from Harvard Medical college of USA are gratefully acknowledged.
References
- 1.Hall DM, Baumgardner KR, Oberley TD, Gisolfi CV. Splanchnic tissues undergo hypoxic stress during whole body hyperthermia. Am J Physiol. 1999;276:G1195–G1203. doi: 10.1152/ajpgi.1999.276.5.G1195. [DOI] [PubMed] [Google Scholar]
- 2.Kerner T, Deja M, Ahlers O, Hildebrandt B, Dieing A, Riess H, Wust P, Gerlach H. Monitoring arterial blood pressure during whole body hyperthermia. Acta Anaesthesiol Scand. 2002;46:561–566. doi: 10.1034/j.1399-6576.2002.460514.x. [DOI] [PubMed] [Google Scholar]
- 3.Youtan Liu, Shaonong Huang, Zhicong Chen, Feiyan Zhong, Jianfang Lu, Jianyan Chen, Yonghui Zheng. Hemodynamic changes during veno-venous perfusion-induced systemic hyperthermia in patients with advanced malignant tumor. Bulletin of The Academy of Military Medical Sciences. 2004;28:160–162. [Google Scholar]
- 4.Rozet I, Tontisirin N, Muangman S, Vavilala MS, Souter MJ, Lee LA, Kincaid MS, Britz GW, Lam AM. Effect of Equiosmolar Solutions of Mannitol versus Hypertonic Saline on Intraoperative Brain Relaxation and Electrolyte Balance. Anesthesiology. 2007;107:697–704. doi: 10.1097/01.anes.0000286980.92759.94. [DOI] [PubMed] [Google Scholar]
- 5.Noppens RR, Christ M, Brambrink AM, Koerner IP, Heimann A, Kempski O. An early bolus of hypertonic saline hydroxyethylstarch improves long-term outcome after global cerebral ischemia. Crit Care Med. 2006;34:2194–2200. doi: 10.1097/01.CCM.0000228915.94169.B1. [DOI] [PubMed] [Google Scholar]
- 6.Ziai WC, Toung TJ, Bhardwaj A. Hypertonic saline: first-line therapy for cerebral edema? J Neurol Sci. 2007;261:157–166. doi: 10.1016/j.jns.2007.04.048. [DOI] [PubMed] [Google Scholar]
- 7.Youtan Liu, Shaonong Huang, Miaoning Gu, Jianfang Lu, Xinping Yang, Feiyan Zhong, Zhicong Chen, Han Yang. Influence of infusing Hypertonic/hyperoncotic solution on the hemodynamics and blood gas-electrolytes changes during venovenous perfusion induced systemic hyperthermia. Journal of Southern Medical University. 2008;28:160–162. [Google Scholar]
- 8.Youtan LIU, Lifang ZHAN, Miao-ning GU, Shaonong Huang, Zhenlong Zhao, Zhengyi Li, Xinping Yang, Jinqiang Guo. The research of whole body hyperthermia model in rats. Chinese Critical Care Medicine. 2009;21:51–54. [Google Scholar]
- 9.Yu Wei-feng. China: Publishing House of The Second Military Medical University; 2001. Anesthesia and Resuscitation; pp. 203–210. [Google Scholar]
- 10.Qi X, Inagaki K, Sobel RA, Mochly-Rosen D. Sustained pharmacological inhibition of δPKC protects against hypertensive encephalopathy through prevention of blood-brain barrier breakdown in rats. J Clin Invest. 2008;118:173–182. doi: 10.1172/JCI32636. [DOI] [PMC free article] [PubMed] [Google Scholar]
- 11.Sharma HS, Dey PK. Role of 5-HT on increased permeability of blood-brain barrier under heat stress. Indian J Physiol Pharmacol. 1984;28:259–267. [PubMed] [Google Scholar]
- 12.Sharma HS. Pathophysiology of blood-brain barrier, brain edema and cell injury following hyperthermia: new role of heat shock protein, nitric oxide and carbon monoxide. An experimental study in the rat using light and electron microscopy. Acta Univ Ups. 2000;19:335–337. [Google Scholar]
- 13.Sharma HS, Cervós-Navarro J. Brain oedema and cellular changes induced by acute heat stress in young rats. Acta Neurochir Suppl (Wien) 1990;51:383–386. doi: 10.1007/978-3-7091-9115-6_129. [DOI] [PubMed] [Google Scholar]
- 14.Robins HI, Peterson CG, Mehta MP. Combined modality treatment for central nervous system malignancies. Semin Oncol. 2003;30:11–22. doi: 10.1016/s0093-7754(03)00271-9. [DOI] [PubMed] [Google Scholar]
- 15.Dewhirst MW, Viglianti BL, Lora-Michiels M, Hanson M, Hoopes PJ. Basic principles of thermal dosimetry and thermal thresholds for tissue damage from hyperthermia. Int J Hyperthermia. 2003;19:267–294. doi: 10.1080/0265673031000119006. [DOI] [PubMed] [Google Scholar]
- 16.Haveman J, Sminia P, Wondergem J, van der Zee J, Hulshof MC. Effects of hyperthermia on the central nervous system: What was learnt from animal studies? Int J Hyperthermia. 2005;21:473–487. doi: 10.1080/02656730500159079. [DOI] [PubMed] [Google Scholar]
- 17.Sharma HS, Hoopes PJ. Hyperthermia induced pathophysiology of the central nervous system. Int J Hyperthermia. 2003;19:325–354. doi: 10.1080/0265673021000054621. [DOI] [PubMed] [Google Scholar]
- 18.Sharma HS. Heat-related deaths are largely due to brain damage. Indian J Med Res. 2005;121:621–623. [PubMed] [Google Scholar]
- 19.Zikria BA, King TC, Stanford J, Freeman HP. A biophysical approach to capillary permeability. Surgery. 1989;105:625–631. [PubMed] [Google Scholar]
- 20.Michel CC, Curry FE. Microvascular permeability. Physiol Rev. 1999;79:703–761. doi: 10.1152/physrev.1999.79.3.703. [DOI] [PubMed] [Google Scholar]
- 21.Vincent JL. Plugging the leaks? New insights into synthetic colloids. Crit Care Med. 1991;19:316–318. doi: 10.1097/00003246-199103000-00003. [DOI] [PubMed] [Google Scholar]
- 22.Collis RE, Collins PW, Gutteridge CN, Kaul A, Newland AC, Williams DM, Webb AR. The effect of hydroxyethyl starch and other plasma volume substitutes on endothelial cell activation: an in vitro study. Intensive Care Med. 1994;20:37–41. doi: 10.1007/BF02425053. [DOI] [PubMed] [Google Scholar]
- 23.Kaplan SS, Park TS, Gonzales ER, Gidday JM. Hydroxyethyl starch reduces leukocyte adherence and vascular injury in the newborn pig cerebral circulation after asphyxia. Stroke. 2000;31:2218–2223. doi: 10.1161/01.str.31.9.2218. [DOI] [PubMed] [Google Scholar]
- 24.Alan R. Harcourt Asia Churchill Livingstone. 3rd Edition. 1999. Aitkenhead, Greham Smith. Textbook of Anaesthesia; pp. 603–606. [Google Scholar]