Abstract
OBJECTIVE: To evaluate the effect of plaque composition on renal function after renal artery intervention (RAI).
PATIENTS AND METHODS: In 33 consecutive patients with atherosclerotic renal artery stenosis (enrolled between January 1, 2007, and April 30, 2009), renal angiography, pressure gradients across the lesion, and intravascular ultrasonography (IVUS) with virtual histology (VH)–derived plaque characteristics were assessed. In 25 patients who underwent RAI, estimated glomerular filtration rate (eGFR) was evaluated at baseline and at 3 months.
RESULTS: Mean pressure gradients across the lesion were poorly associated with baseline eGFR (r=–0.37; P=.07). In gray scale IVUS data, only remodeling index was significantly correlated with baseline eGFR (r=–0.38; P=.03). Plaque components classified by VH-IVUS had no correlation with baseline eGFR. During follow-up of 25 patients, the improvement in eGFR after RAI was observed in 9 patients, unchanged in 3, and deteriorated in 13. Overall, follow-up eGFR (median, 49.0 mL/min/1.73 m2; interquartile range [IQR], 40.6-63.9 mL/min/1.73 m2) was unchanged compared with baseline eGFR (median, 53.8 mL/min/1.73 m2; IQR, 41.4-63.4 mL/min/1.73 m2; P=.38). The percent change in eGFR (median, –0.2%; IQR, –16.0% to 16.0%) after RAI had a significant negative correlation with the mean percentage of necrotic core classified by VH-IVUS (r=–0.47; P=.02), and the mean percentage of necrotic core was significantly larger in patients with deterioration of eGFR than in patients without deterioration of eGFR (median, 12.7%; IQR, 9.5%-19.5%; vs median, 8.3%; IQR, 5.5%-11.6%; P=.04).
CONCLUSION: In patients with atherosclerotic renal artery stenosis, the change in eGFR after RAI was related to plaque composition classified by VH-IVUS. The evaluation of plaque composition may provide more insights into the change in renal function after RAI.
BP = blood pressure; CSA = cross-sectional area; eGFR = estimated glomerular filtration rate; FMD = fibromuscular dysplasia; IVUS = intravascular ultrasonography; IQR = interquartile range; Pa = abdominal aorta pressure; Pd = distal renal artery pressure; RAI = renal artery intervention; RAS = renal artery stenosis; VH = virtual histology
Renal artery intervention (RAI) is widely performed for atherosclerotic renal artery stenosis (RAS).1 However, in a significant proportion of patients, renal function may deteriorate after RAI, and recent studies have demonstrated no significant difference in improvement of renal function between RAI with medical therapy and medical therapy alone.2,3 Kennedy et al4 suggested that restoration of renal function after RAI might be associated with improvement in long-term survival. Therefore, if there are predictors of deterioration in renal function after RAI, recent results after RAI may be improved.
Previous studies have reported that renal angiography may overestimate the actual stenosis severity5 and that hyperemic systolic gradient across the lesion using a pressure guidewire may be useful in predicting blood pressure (BP) improvement after RAI.6 Moreover, intravascular ultrasonography (IVUS) with virtual histology (VH) has enabled tissue characterization of atherosclerotic plaque,7,8 and the plaque composition in coronary plaques detected by VH-IVUS was associated with impairment of the coronary microcirculation after coronary intervention.9,10 Therefore, plaque composition of RAS may be associated with the change in renal function after RAI. The current study is an extension of our previous study,11 and we investigated the association between lesion characteristics and the change in renal function after RAI.
PATIENTS AND METHODS
The study consisted of 33 consecutive patients who underwent renal angiography and VH-IVUS because of insufficiently controlled hypertension (systolic BP >140 mm Hg or diastolic BP >90 mm Hg while taking ≥2 antihypertensive drugs) and/or impaired renal function or a history of acute pulmonary edema, who were enrolled between January 1, 2007, and April 30, 2009. Patients with in-stent restenosis, total occlusion, and fibromuscular dysplasia (FMD) were excluded from this study. This retrospective study was approved by the Mayo Clinic Institutional Review Board.
Renal Artery Angiography and Pressure Measurements
Selective renal artery angiography was performed, and angiographic stenosis was quantified with an automated edge detection method. All patients received intravenous heparin, 5000 U, and aspirin, 325 mg, before the procedure. After renal angiography, the pressure measurement across the lesion was performed using a 0.014-in pressure guidewire (Radi Medical Systems, Uppsala, Sweden) with an angiographic diameter stenosis greater than 30%. The pressure wire was advanced into the distal portion of the main renal artery beyond the lesion, and distal renal artery pressure (Pd) was measured using the pressure wire. Simultaneously, abdominal aorta pressure (Pa) was obtained through a 6F guiding catheter. The pressure gradient (Pa-Pd) and pressure ratio (Pd/Pa) were calculated in systolic and mean pressures. Pressure data from 26 patients were used for data analysis. Patients with a serum creatinine level greater than 2.0 mg/dL (to convert to micromoles per liter, multiply by 88.4) or greater than 1.2 mg/dL with diabetes mellitus underwent intravenous hydration with normal saline and received acetylcysteine before the procedures, and the same administration was also performed at the physician’s discretion in some other patients. A nonionic iso-osmolar contrast media (iodixanol) was used during procedures.
Procedures and Analysis of IVUS Images
The IVUS study was performed using a 20-MHz, 2.9F imaging catheter (Volcano Therapeutics, Rancho Cordova, CA) as previously described.11 The IVUS catheter was advanced into the distal, normal-looking portion of the renal artery beyond the lesion. IVUS imaging was performed using slow manual pullback, and VH-IVUS data were obtained by a dedicated VH-IVUS console (Volcano Therapeutics) and were recorded on a DVD-R for offline analysis.11 After IVUS imaging, RAI was performed using a standard technique. Because this study is retrospective, a strict indication for RAI was lacking. Therefore, RAI was performed on the basis of the operator’s judgment. Stent size was determined according to media-to-media diameter measured by IVUS at the distal, normal-looking segment, and prestenting or poststenting dilation was also performed on the basis of the operator’s decision.
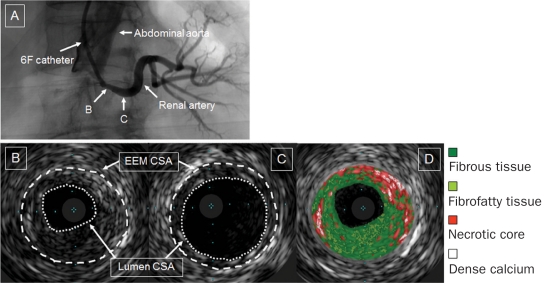
Cross-sectional images were quantified at the lesion as follows: cross-sectional area (CSA) of the external elastic membrane, CSA of the lumen, and CSA of the plaque and media (Figure 1). The percentage of plaque burden was defined as the CSA of the plaque and media divided by the CSA of the external elastic membrane times 100. The reference site was the most normal-looking segment in the distal main renal artery (Figure 1)11,12 because atherosclerotic RAS is typically observed at the ostium or the proximal portion of the main renal artery.1 A remodeling index was calculated as the CSA of the external elastic membrane at the minimum lumen site divided by the CSA of the external elastic membrane at the reference site. These analyses were performed by 2 experienced operators (T.T., T.K.) who were unaware of clinical results. Both interobserver and intraobserver variability of IVUS data were previously described.11 The VH-IVUS analysis was performed at each frame in the lesion. Each frame was classified following 4 components: fibrous tissue, fibrofatty tissue, necrotic core, and dense calcium (Figure 1).7,8,11 The reproducibility of plaque components classified by VH-IVUS was previously reported.13,14 The VH-IVUS data were reported as a percentage of each component of the total plaque. The mean percentage of the entire lesion was used for the comparison with renal function.
FIGURE 1.
Intravascular ultrasonograms of atherosclerotic renal artery stenosis. Renal angiography revealed ostial renal artery stenosis (A). Images of the cross-sectional areas (CSAs) of the external elastic membrane (EEM) and the lumen are shown at the minimum lumen site (B) and the distal reference site (C). Each plaque component at the minimum lumen site is classified by intravascular ultrasonography with virtual histology: fibrous tissue (green), fibrofatty tissue (light green), necrotic core (red), and dense calcium (white) (D).
Assessments of Renal Function and BP
Blood samples were drawn before renal angiography, and the serum creatinine concentration was measured. The serum creatinine levels were used to calculate the estimated glomerular filtration rate (eGFR). The eGFR was calculated using the isotope dilution mass spectrometry–traceable Modification of Diet in Renal Disease Study equation15: 175 × (Creatinine)–1.154 × (Age)–0.203 × (0.742 if Female) × (1.212 if African American). Three months after the RAI, the blood test result was reassessed and the eGFR calculated. The blood tests at baseline and follow-up were performed at our institution. In addition, percent change in eGFR ([eGFR at 3 months – eGFR at baseline]/eGFR at baseline × 100) was calculated. An automated oscillometric device was used to measure the BP on the upper arm of the patient while he or she was in the sitting position. An average of at least 2 measurements was used for the analysis. The percent change in BP ([BP at 3 months – BP at baseline]/BP at baseline × 100) was calculated as well.
Statistical Analyses
Continuous variables are expressed as median and interquartile range (IQR), and categorical values as percentages. In patients with bilateral lesions, pressure gradient and IVUS data from the lesion with smaller minimum lumen CSA detected by IVUS were selected for the assessment of the association among parameters. All pressure gradient and several IVUS data were not normally distributed. Therefore, the Spearman rank correlation test was applied to investigate the association. In 28 (85%) of 33 patients, RAI was performed, and the serum creatinine level at 3 months was available in 25 of 28 patients who had undergone RAI. Furthermore, BP at 3 months was available in 23 (92%) of 25 patients. The Wilcoxon signed rank test was conducted to evaluate the changes in BP (n=23) and eGFR (n=25). Statistical analysis was performed with JMP statistical software, version 7.0 (SAS Institute Inc, Cary, NC). P <.05 was considered significant.
RESULTS
Patient Characteristics and Clinical Results
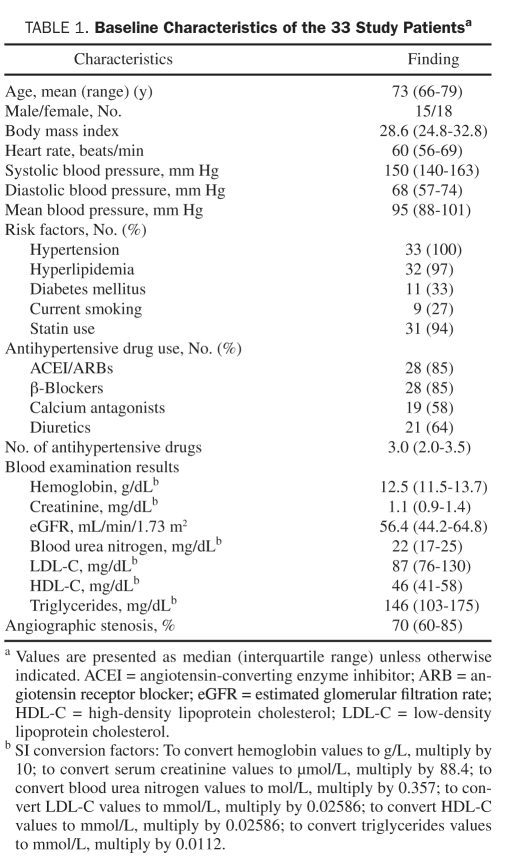
The demographics of the patients are summarized in Table 1. Sixteen patients had bilateral renal artery stenoses, and the remaining 17 patients had unilateral stenosis. Baseline eGFR and systolic BP were 56.4 mL/min/1.73 m2 (IQR, 44.2-64.8 mL/min/1.73 m2) and 150 mm Hg (IQR, 140-163mm Hg), respectively. The RAI was performed on the basis of the operator’s decision in 28 (85%) of 33 patients, and 8 patients underwent RAI on both renal artery lesions. We performed RAI in 36 renal arteries. Of all the lesions that underwent RAI, more than 60% had angiographic stenosis. A bare metal stent was implanted without complications, and no lesions had residual stenosis greater than 30% after implantation of stents in all patients.
TABLE 1.
Baseline Characteristics of the 33 Study Patientsa
Association Between VH-IVUS Findings or Pressure Gradients and Baseline Renal Function
The minimum CSA of the lumen had a significant negative correlation with baseline mean BP (r=–0.37, P=.03) but not with baseline eGFR. Only remodeling index had a negative correlation with baseline eGFR (r=–0.38, P=.03). A total of 367 frames (11±1 frames per lesion) were classified by VH-IVUS, but no significant association was found between any plaque component and baseline eGFR. Systolic pressure gradient (Pa-Pd) (median, 8.5 mm Hg; IQR, 4.8-39.0 mm Hg) and ratio (Pd/Pa) (median, 0.93; IQR, 0.77-0.97) were not correlated with baseline eGFR. However, mean pressure gradient (median, 3.0 mm Hg; IQR, 1.0-9.5 mm Hg) and ratio (median, 0.96; IQR, 0.88-0.98) had a poor association with baseline eGFR (r=–0.37, P=.07; and r=0.37, P=.07; respectively).
Changes in Renal Function and BP
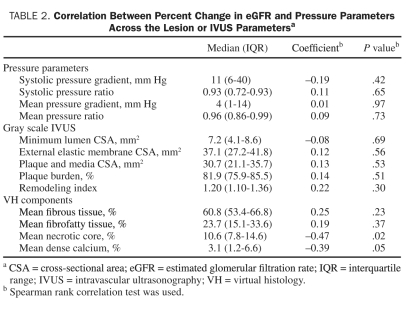
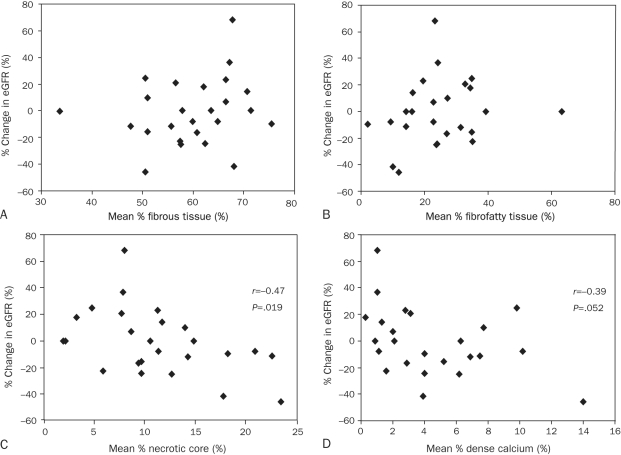
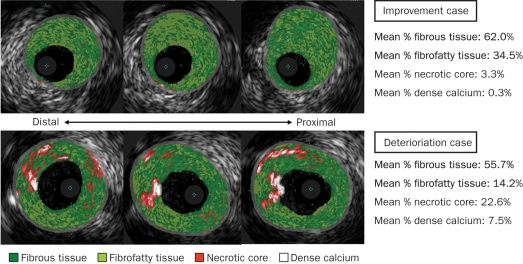
Three-month follow-up data were available in 25 of 28 patients who had undergone RAI. Six of 11 patients with bilateral stenoses underwent RAI on both lesions. All 25 patients were undergoing statin treatment, and the median number of antihypertensive drugs was 3.0 (IQR, 2.0-4.0) at the end of follow-up. In only 2 patients the number of antihypertensive drugs was changed after RAI. Improvement in eGFR after RAI was observed in only 9 patients. Overall, follow-up eGFR (median, 49.0 mL/min/1.73 m2; IQR, 40.6-63.9 mL/min/1.73 m2) was not significantly different than baseline eGFR (median, 53.8 mL/min/1.73 m2; IQR, 41.4-63.4 mL/min/1.73 m2; P=.38), and percent change in eGFR (median, –0.2%; IQR, –16.0% to 16.0%) had a significant correlation with baseline creatinine and eGFR (r=0.57, P=.003; and r=–0.53, P=.006; respectively). Other baseline parameters, including BP, routine blood tests, and angiographic stenosis, were not correlated with percent change in eGFR. Gray scale VH-IVUS data were not associated with percent change in eGFR (Table 2). However, mean percentage of necrotic core was negatively correlated with percent change in eGFR (r=–0.47, P=.02) (Table 2, Figure 2, and Figure 3), and mean percentage of necrotic core was significantly larger in patients with deterioration in eGFR (n=13) than in patients without deterioration in eGFR (n=12) (median, 12.7%; IQR, 9.5%-19.5%; vs median, 8.3%; IQR, 5.5%-11.6%; P=.04). The mean volume of contrast media (median, 90 mL; IQR, 65-125 mL) used during RAI had no correlation with percent change in eGFR (P=.37). No difference was found in percent change in eGFR between patients premedicated with (n=13) and without acetylcysteine and hydration (n=12) (P=.16) or with (n=16) and without poststenting dilation (n=9) (P=.73). No procedural differences were found in RAI between patients with (n=9) and without (n=16) improvement in renal function. Furthermore, mean percentages of necrotic core of treated unilateral lesions (n=19) compared with treated bilateral lesions (n=6) were not different (P=.90), and percent change in eGFR was not significantly different between patients with treated unilateral lesions (n=19) vs those with treated bilateral lesions (n=6) (P=.23).
TABLE 2.
Correlation Between Percent Change in eGFR and Pressure Parameters Across the Lesion or IVUS Parametersa
FIGURE 2.
Correlation between each plaque component and percent change in estimated glomerular filtration rate (eGFR) at 3 months after renal artery intervention. Mean percentage of fibrous (A) and fibrofatty (B) tissues is not associated with percent change in eGFR. Mean percentage of necrotic core has a significant negative correlation with percent change in eGFR (C). Mean percentage of dense calcium is poorly associated with percent change in eGFR (D).
FIGURE 3.
Representative intravascular ultrasonography (IVUS) with virtual histology (VH) images in patients with improvement vs deterioration of renal function after renal artery intervention. Each plaque component is color labeled in the VH-IVUS images. Upper panel shows that renal plaques have only a small amount of necrotic core, and percent change in estimated glomerular filtration rate (eGFR) after intervention is 18.0%. Bottom image shows plaques with much necrotic core and a percent change in eGFR of –11.4%.
Follow-up BP data were available in 23 of 25 patients, and systolic BP in 19 patients decreased after RAI. Overall, systolic BP decreased significantly after RAI (median, 150 mm Hg; IQR, 140-164 mm Hg; vs median, 131 mm Hg; IQR, 121-140 mm Hg; P<.001), and percent change in systolic BP had a negative significant correlation with baseline systolic BP (r=–0.55, P=.007). In gray scale and VH-IVUS data, only mean percentage of dense calcium was significantly associated with percent change in systolic BP (r=–0.45, P=.03). No relationship was found between percent changes in eGFR and systolic BP (P=.84).
Of 25 follow-up patients, 20 had pressure gradient data across the lesion before RAI. In these patients, any pressure gradient or ratio did not have significant correlations with percent changes in eGFR and systolic BP.
DISCUSSION
The current study demonstrates that, in patients with atherosclerotic RAS, renal function in response to RAI is significantly correlated with the tissue characteristics of the renal atherosclerotic plaques classified by VH-IVUS. The current study underscores the heterogeneous response to RAI and suggests that plaque composition evaluated by VH-IVUS might provide more insights into the change in renal function after RAI.
Association Between Structural States and Impaired Renal Function
A previous study reported the utility of IVUS in the confirmation of optimal stent apposition and expansion during RAI.12 Therefore, structural evaluation by IVUS may provide more information regarding the need for intervention. In this study, baseline eGFR did not significantly correlate with the minimum CSA of the lumen, although baseline eGFR significantly correlated with remodeling index. Thus, the reduction of renal blood flow induced by RAS may not be a main contributor to impairing GFR. This finding is supported by the fact that renal function does not progressively decrease in patients with RAS caused by FMD despite significant obstruction of the renal artery.16 Furthermore, the kidney without stenosis in patients with unilateral atherosclerotic RAS could not fully compensate for the decrease in GFR of the kidney with stenosis, and the GFR of the kidney without stenosis in patients with unilateral atherosclerotic RAS was decreased compared with that of the kidney without stenosis in patients with unilateral FMD stenosis.17 Patients with atherosclerotic RAS had other vascular atherosclerotic diseases18; systemic atherosclerosis may progress and extend to the renal microcirculation, affecting the GFR even in the nonstenotic kidney. Thus, structural values of the main renal plaque associated with baseline eGFR may reflect the degree of atherosclerotic change in renal microcirculation. However, plaque components classified by VH-IVUS had no correlation with baseline eGFR, and renal plaque composition may not directly reflect the property of microcirculation associated with present renal function.
Influence Of Hemodynamic State on Renal Dysfunction
The physiologic significance of atherosclerotic lesions may not be accurately predicted by renal angiography, and Leesar et al6 have suggested that hyperemic systolic gradient may be helpful in predicting BP improvement. Although we performed only rest pressure gradients, these data had poor correlations with baseline eGFR. Thus, the stenosis severity may somewhat contribute to decreasing GFR, although atherosclerosis in renal microcirculation may be the main contributor to impairing GFR in patients with atherosclerotic RAS.
Responses to RAI
There is growing controversy regarding the need and the efficiency of intervention for atherosclerotic RAS. Recent studies have demonstrated that RAI may not lead to significant benefits beyond medical therapy. However, these studies also showed a small benefit of RAI on attenuation of deterioration in renal function.2,3 Moreover, a previous study demonstrated that high baseline creatinine concentrations tended to cause a large decrease in creatinine level after RAI,19 and our results also showed that baseline eGFR and creatinine level were significantly correlated with percent change in eGFR. Therefore, appropriate patient selection for RAI may improve the outcomes after RAI. This study revealed that percent change in eGFR was inversely correlated with mean percentage of necrotic core detected by VH-IVUS but not with gray scale data. Thus, the change in renal function after RAI was not predicted by the structural state detected by gray scale IVUS, but differential tissue characteristics were associated with impaired renal function after RAI. The mechanism of the decrease in renal function after intervention in the presence of necrotic core may be multifactorial. One potential mechanism is the release of emboli from the necrotic core as suggested in the coronary circulation.9,10 However, recent studies have reported that the use of embolic protection devices alone during RAI do not lessen the decrease of GFR after stenting despite the capture of embolic debris in embolic protection devices; however, the use of a glycoprotein IIb/IIIa inhibitor with an embolic protection device could improve the GFR.20,21 Furthermore, a recent pilot study showed the significant increase in interleukin 6 production after RAI.22 These results suggest that one of the mechanisms by which the release of emboli from renal plaque with abundant necrotic core may mediate the decrease in renal function is by the release of cytokines and platelet activation. Considering the poor correlation between pressure gradients and baseline eGFR, the pressure recovery after RAI might have the ability to improve or attenuate the deterioration of the GFR. However, rest pressure gradients were not associated with percent change in eGFR in this study, and hyperemic pressure gradient did not have a significant correlation with renal function after RAI.6
Systolic BP significantly decreased after RAI, and percent change in systolic BP had a significant correlation with baseline systolic BP. This result is compatible with a previous study that demonstrated a significantly greater decrease in systolic BP after stenting in patients with higher baseline systolic BP.23 A recent study showed that hyperemic systolic pressure gradient might predict BP improvement.6 However, we did not measure hyperemic pressure gradients across the lesion. Therefore, any rest pressure gradients did not have significant correlations with percent change in systolic BP in this study. In IVUS data, only dense calcium was negatively associated with percent change in systolic BP. The progression in aortic stiffness leads to elevation of systolic pressure, and a recent study demonstrated that aortic calcification is independently associated with aortic stiffness.24 Therefore, aortic calcification may play an important role in elevating systolic pressure. In fact, previous studies suggest that renal artery calcium is associated with the prevalence of hypertension and other vascular calcium, including abdominal aorta,25 and that abdominal aorta calcium correlates with drug-resistant hypertension.24 Therefore, the degree of decrease in systolic BP after RAI may be diminished in patients with abundant dense calcium, although systolic BP decreased in most of the patients in this study.
No correlation was found between percent changes in systolic BP and eGFR in this study. Some previous studies also demonstrated that renal function did not improve after RAI despite the decrease in BP.12,23,26 Furthermore, a recent study showed that the improvement of GFR was independent of the change in BP after administration of progenitor cells.27 Thus, the impairments in BP and GFR may represent separate disease pathways and have a different response to RAI.
Study Limitations
The study has several limitations. First, no study has validated plaque composition classified by VH-IVUS in the renal artery. However, a previous study demonstrated the strong correlation between plaque components defined by VH-IVUS and histologic analysis of endarterectomy plaque from carotid artery.28 Therefore, VH-IVUS may enable reliable tissue characterization in other larger arteries than the coronary artery. Second, baseline creatinine concentration, eGFR, and mean percentage of necrotic core were significantly associated with percent change in eGFR after RAI. However, we did not perform multivariate analysis because of the small number of study participants. In this setting, the results of multivariate analysis cannot have a strong meaning. Furthermore, volumetric IVUS data of the whole lesion were not calculated because of manual pull-back, and the intrarenal resistance index evaluated by ultrasonography was determined in only half of the study participants. Therefore, we cannot address the associations between these parameters and changes in renal function after RAI. Third, eGFR was calculated from the serum creatinine level, which was influenced by several factors, including drugs, contrast media, and dehydration. Although antihypertensive drugs and the volume of contrast media were not associated with the changes in eGFR, other factors might affect the changes in eGFR after intervention. Fourth, if a typical beaded appearance of FMD was not shown on renal angiography, the lesion was enrolled as an atherosclerotic lesion, and histologic evaluation was not performed. Thus, we cannot rule out that our study patients had lesions of other diseases. Finally, this study included a relatively small number of patients. Prospective clinical investigations of larger populations are necessary to clarify the effect of plaque composition classified by VH-IVUS on changes in renal function after RAI.
CONCLUSION
In atherosclerotic RAS, the distribution of plaque components classified by VH-IVUS is related to the change in renal function after RAI. The evaluation of tissue characterization by VH-IVUS may provide more information regarding the change in renal function after RAI and may encourage the improvement in recent results of RAI and prognosis.
Footnotes
This study was supported by National Institutes of Health grants (DK73608 and HL085307).
REFERENCES
- 1. Safian RD, Textor SC. Renal-artery stenosis. N Engl J Med. 2001;344(6):431–442 [DOI] [PubMed] [Google Scholar]
- 2. The ASTRAL Investigators Revascularization versus medical therapy for renal-artery stenosis. N Engl J Med. 2009;361(20):1953–1962 [DOI] [PubMed] [Google Scholar]
- 3. Bax L, Woittiez AJ, Kouwenberg HJ, et al. Stent placement in patients with atherosclerotic renal artery stenosis and impaired renal function: a randomized trial. Ann Intern Med. 2009;150(12):840-848, W150-151 [DOI] [PubMed] [Google Scholar]
- 4. Kennedy DJ, Colyer WR, Brewster PS, et al. Renal insufficiency as a predictor of adverse events and mortality after renal artery stent placement. Am J Kidney Dis. 2003;42(5):926–935 [DOI] [PubMed] [Google Scholar]
- 5. Drieghe B, Madaric J, Sarno G, et al. Assessment of renal artery stenosis: side-by-side comparison of angiography and duplex ultrasound with pressure gradient measurements. Eur Heart J. 2008;29(4):517–524 [DOI] [PubMed] [Google Scholar]
- 6. Leesar MA, Varma J, Shapira A, et al. Prediction of hypertension improvement after stenting of renal artery stenosis: comparative accuracy of translesional pressure gradients, intravascular ultrasound, and angiography. J Am Coll Cardiol. 2009;53(25):2363–2371 [DOI] [PubMed] [Google Scholar]
- 7. Nair A, Kuban BD, Tuzcu EM, et al. Coronary plaque classification with intravascular ultrasound radiofrequency data analysis. Circulation. 2002;106(17):2200–2206 [DOI] [PubMed] [Google Scholar]
- 8. Nasu K, Tsuchikane E, Katoh O, et al. Accuracy of in vivo coronary plaque morphology assessment: a validation study of in vivo virtual histology compared with in vitro histopathology. J Am Coll Cardiol. 2006;47(12):2405–2412 [DOI] [PubMed] [Google Scholar]
- 9. Kawamoto T, Okura H, Koyama Y, et al. The relationship between coronary plaque characteristics and small embolic particles during coronary stent implantation. J Am Coll Cardiol. 2007;50(17):1635–1640 [DOI] [PubMed] [Google Scholar]
- 10. Kawaguchi R, Oshima S, Jingu M, et al. Usefulness of virtual histology intravascular ultrasound to predict distal embolization for ST-segment elevation myocardial infarction. J Am Coll Cardiol. 2007;50(17):1641–1646 [DOI] [PubMed] [Google Scholar]
- 11. Kataoka T, Mathew V, Rubinshtein R, et al. Association of plaque composition and vessel remodeling in atherosclerotic renal artery stenosis: a comparison with coronary artery disease. JACC Cardiovasc Imaging. 2009;2(3):327–338 [DOI] [PMC free article] [PubMed] [Google Scholar]
- 12. Dangas G, Laird JR, Jr, Mehran R, et al. Intravascular ultrasound-guided renal artery stenting. J Endovasc Ther. 2001;8(3):238–247 [DOI] [PubMed] [Google Scholar]
- 13. Rodriguez-Granillo GA, Garcia-Garcia HM, Valgimigli M, et al. Reproducibility of intravascular ultrasound radiofrequency data analysis: implications for the design of longitudinal studies. Int J Cardiovasc Imaging. 2006;22(5):621–631 [DOI] [PubMed] [Google Scholar]
- 14. Prasad A, Cipher DJ, Prasad A, et al. Reproducibility of intravascular ultrasound virtual histology analysis. Cardiovasc Revasc Med. 2008;9(2):71–77 [DOI] [PubMed] [Google Scholar]
- 15. Levey AS, Coresh J, Greene T, et al. Expressing the modification of diet in renal disease study equation for estimating glomerular filtration rate with standardized serum creatinine values. Clin Chem. 2007;53(4):766–772 [DOI] [PubMed] [Google Scholar]
- 16. Slovut DP, Olin JW. Fibromuscular dysplasia. N Engl J Med. 2004;350(18):1862–1871 [DOI] [PubMed] [Google Scholar]
- 17. La Batide-Alanore A, Azizi M, Froissart M, Raynaud A, Plouin PF. Split renal function outcome after renal angioplasty in patients with unilateral renal artery stenosis. J Am Soc Nephrol. 2001;12(6):1235–1241 [DOI] [PubMed] [Google Scholar]
- 18. Garovic VD, Textor SC. Renovascular hypertension and ischemic nephropathy. Circulation. 2005;112(9):1362–1374 [DOI] [PubMed] [Google Scholar]
- 19. Zeller T, Frank U, Muller C, et al. Predictors of improved renal function after percutaneous stent-supported angioplasty of severe atherosclerotic ostial renal artery stenosis. Circulation. 2003;108(18):2244–2249 [DOI] [PubMed] [Google Scholar]
- 20. Cooper CJ, Haller ST, Colyer W, et al. Embolic protection and platelet inhibition during renal artery stenting. Circulation. 2008;117(21):2752–2760 [DOI] [PubMed] [Google Scholar]
- 21. Kanjwal K, Haller S, Steffes M, et al. Complete versus partial distal embolic protection during renal artery stenting. Catheter Cardiovasc Interv. 2009;73(6):725–730 [DOI] [PubMed] [Google Scholar]
- 22. Brountzos EN, Tavernaraki K, Gouliamos AD, et al. Systemic inflammatory response to renal artery percutaneous angioplasty with stent placement and the risk for restenosis: a pilot study. J Vasc Interv Radiol. 2009;20(2):186–191 [DOI] [PubMed] [Google Scholar]
- 23. Burket MW, Cooper CJ, Kennedy DJ, et al. Renal artery angioplasty and stent placement: predictors of a favorable outcome. Am Heart J. 2000;139(1, pt 1):64–71 [DOI] [PubMed] [Google Scholar]
- 24. McEniery CM, McDonnell BJ, So A, et al. Aortic calcification is associated with aortic stiffness and isolated systolic hypertension in healthy individuals. Hypertension. 2009;53(3):524–531 [DOI] [PubMed] [Google Scholar]
- 25. Allison MA, Lillie EO, DiTomasso D, Wright CM, Criqui MH. Renal artery calcium is independently associated with hypertension. J Am Coll Cardiol. 2007;50(16):1578–1583 [DOI] [PubMed] [Google Scholar]
- 26. Rocha-Singh K, Jaff MR, Rosenfield K. Evaluation of the safety and effectiveness of renal artery stenting after unsuccessful balloon angioplasty: the ASPIRE-2 study. J Am Coll Cardiol. 2005;46(5):776–783 [DOI] [PubMed] [Google Scholar]
- 27. Chade AR, Zhu X, Lavi R, et al. Endothelial progenitor cells restore renal function in chronic experimental renovascular disease. Circulation. 2009;119(4):547–557 [DOI] [PMC free article] [PubMed] [Google Scholar]
- 28. Diethrich EB, Pauliina Margolis M, Reid DB, et al. Virtual histology intravascular ultrasound assessment of carotid artery disease: the Carotid Artery Plaque Virtual Histology Evaluation (CAPITAL) study. J Endovasc Ther. 2007;14(5):676–686 [DOI] [PubMed] [Google Scholar]


