Summary
Mycobacterium tuberculosis genome contains four related sets of an operon called mce (mce1-4). The disruption of one of these operons, mce1, causes M. tuberculosis to become hypervirulent, whereas the mce3 and mce4 operon mutants are attenuated in mice. This study examined the phenotype of the mce2 operon mutant. The deletion of mce2 operon in M. tuberculosis H37Rv had no effect on bacterial growth in 7H9 liquid broth or survival within macrophages. However, RAW macrophage-like cells infected with the mutant strain were reduced in their ability to produce TNF-α, IL-6 and MCP-1. In C57BL/6 mouse lungs, the mce2 operon mutant and wild type H37Rv replicated similarly up to 20 weeks of infection. However, by 56 weeks of infection, all mice infected with the wild type H37Rv had died, while 80% of those infected with the mutant remained alive (P< 0.0001). The proportion of affected lung parenchyma in mice infected with the mutant was substantially less than that of mice infected with the wild type for the same time periods of infection. These observations suggest that the mce2 operon mutant is attenuated, and that this attenuation is related not to the bacterial burden but to the mutant’s decreased ability to elicit a type of immune response and lung pathology detrimental to the survival of the animal.
Keywords: Mycobacterium tuberculosis, mce operons, mce2 operon mutant
1. Introduction
It is estimated that 1/3 of the world’s population is latently infected with M. tuberculosis, the etiologic agent of tuberculosis [1]. Of these latently infected individuals, only about 10% develop active disease. Thus the majority of infected people carry this organism for lifetime. The mechanism underlying this latent infection and reactivation from this latent state in an animal host is still poorly understood.
M. tuberculosis genome contains four homologous copies of an operon called mce (mce1-4) (Supp. Fig. 1). All four mce operons carry six mce genes (mceA-F) and two yrbE genes (yrbEA-B). The mce genes encode proteins that localize to the cell wall [2-4], whereas yrbE genes encode integral membrane proteins [4]. In 1993 Arruda et al. reported that mce1A conferred upon a nonpathogenic E. coli an ability to enter and survive within mammalian cells [5]. The mce operon genes exhibit differential expression profiles under different growth conditions in vitro as well as throughout various phases of M. tuberculosis infection in vivo [6-8]. Casali et al. has shown that mce1 operon genes are negatively regulated intracellularly by a transcriptional regulator (mce1R) which belongs to the GntR family of transcriptional regulators [9]. Uchida et al. has shown that M. tuberculosis strain disrupted in mce1R gene exhibits enhanced virulence in mice, suggesting that the level of expression of mce1 operon gene products affects infection outcome [10]. On the other hand, mce3 operon genes are regulated by a gene Rv1963 which belongs to the tetR family of transcriptional regulators [11, 12]. Most recently, Santangelo and colleagues demonstrated that mce2 operon’s expression is regulated by Rv0586 gene which encodes a putative GntR-like regulator [11].
Previously, it was shown that M. tuberculosis strain disrupted in mce1 operon fails to establish latent infection in the mouse model of tuberculosis [3]. Mice infected with the mce1 operon mutant strain died much earlier than those infected with the wild type strain. In addition, histological examination of lung sections revealed an aberrant pro-inflammatory response in mice infected with the mce1 operon mutant strain. On the other hand, M. tuberculosis strains disrupted in mce3 and mce4 operons displayed an attenuated phenotype in the mouse model of infection [13]. Thus, these studies suggest that despite the high level of homology among different mce operons, they appear to have distinct functions during the course of M. tuberculosis infection in mice. Therefore, in this study, we set out to examine the phenotype of mce2 operon mutant using an approach similar to that done with mce1, 3 and 4 operon mutants.
2. Materials and Methods
2.1 Disruption of the mce2 operon
An mce2 operon mutant was generated by disruption of a DNA segment between yrbE2A-mce2F genes in wild type H37Rv bacterial strain (Supp. Fig. 2). The mutation was carried out with a strategy described by Parish and Stoker [14]. Briefly, we disrupted the genes by amplifying 2kb DNA regions upstream and downstream of the targeted segment. Shown below are primer sets used to generate upstream and downstream 2kb DNA regions flanking the mce2 operon genes.
Upstream flanking region primer set:
Forward primer: 5’ TTATAAGTACTCAGCACCGCGCCGTTGTCGA 3’
Reverse Primer: 5’ TTATAAAGCTTTGCCGACTCGCCTGGCTAAC 3’
Downstream flanking region primer set:
Forward primer: 5’ TTATAAAGCTTGCCGGCGCGATCAGGTACCG 3’
Reverse primer: 5’TTATAGCGGCCGCCTTGACTATCCGGGATCCAGCG 3’
Following digestion with appropriate restriction enzymes these PCR products were subcloned into the p2NIL vector [14]. This vector carries the kanamycin resistance gene for selection in both E. coli and M. tuberculosis, an origin of replication E (oriE) for replication in E. coli, a small multiple cloning site (MCS), the lacZ gene for screening on X-Gal, and the sucrose sensitivity gene sacB. An unmarked mutation was created by a two-step counter-selection procedure. In the first step, single cross-over constructs were obtained as a result of plasmid DNA insertion into M. tuberculosis genome. At this point the transformed bacteria were blue in color, kanamycin resistant, and sucrose sensitive. A single cross-over colony was then grown in 7H9 +ADC (10%) media without antibiotic for one week to allow the second cross-over event to occur. The bacteria were then plated on 2% sucrose and X-gal plates to select for the loss of the integrated plasmid. Colonies that appeared white were picked and PCR screened for the expected mutation. Finally, Southern blot was performed to confirm presence of the mutation.
2.2 In-vitro growth kinetic analysis of mutant strain
M. tuberculosis strains were first grown to mid-log phase. An aliquot of the culture was passed through a 5 μm pore filter to prepare single cell suspensions. Optical density of these cultures was recorded at 600 nm and bacteria were inoculated into fresh 7H9+ADC media. Subsequently, these cultures were propagated in 5% humidified CO2 incubator for 21 days. Every other day, 1 ml of the cultures was taken and an optical density at 600 nm recorded to generate a growth curve for each bacterial strain.
2.3 Determination of survival and cytokine and chemokine expression in RAW macrophages infected with the mce2 operon mutant strain
The RAW 264.7 murine macrophage-like cell line (ATCC, MD) was cultured and maintained in Dulbecco’s modified Eagle’s medium (DMEM) (GIBCO, NY) supplemented with 10% fetal bovine serum (FBS) (Omega Scientific, CA) at 37°C in a 5% CO2 humidified incubator. Cell concentration was determined by a hemocytometer. Cells were plated at a density of 1 × 10ˆ5 cells/well in 24 well tissue culture plates and incubated overnight to achieve approximately 70% confluency. The macrophages were infected at a multiplicity of infection (MOI) of 1:1. After 6 hours of infection, macrophages were washed 3 times with DMEM to remove extracellular bacteria.
To examine the intracellular invasion, growth, and survival of bacteria, we lysed the macrophages with 1ml of PBS - 0.5% Triton-X-100 and plated cell lysates at serial dilutions onto 7H11 agar at 6, 24, 48, and 72 hours post infection. Colony forming units (CFU’s) were enumerated 21 days post plating. Supernatants of the above cell cultures were used to measure TNF-α, IL-6, IL-12, IL-10, IL-4 and MCP-1 produced by RAW macrophages in response to infection with the wild type H37Rv or the mce2 operon mutant strain. Lipopolysaccharide (1mg/ml) (Sigma) was used as a positive control and uninfected macrophages served as a negative control for each experiment. We also used mce1 operon mutant strain as an additional control. The above cytokines or chemokines were measured by ELISA with the reagents purchased from eBioscience.
2.4 Mouse Infection
To maintain virulence, M. tuberculosis strains were passaged once in mice prior to use in this experiment. Eight week old female C57BL/6 mice (Jackson Laboratories) were infected with the wild type H37Rv M. tuberculosis, mce2 or mce1 operon mutant strains via the aerosol route using the Inhalation Exposure System (Glas-co, Terre Haute, Ind.). We confirmed the low dose inoculum conditions by enumerating CFU counts recovered from the lungs of three mice per infection strain 24 hours post infection. Lungs were homogenized and plated onto 7H11 + OADC (10%) + cyclohexamide (100 ug/ml) agar plates and these plates were read for CFU’s 21 days later – doses of infection were 76, 57 and 153 CFU’s per right lung in mice infected with H37Rv, mce2 and mce1 operon mutants respectively. Additionally, at different time points post-infection (3, 6, 12 and 20 weeks), the right lung from three mice per strain was collected, homogenized in PBS-Tween (0.05%), appropriately diluted, and plated onto 7H11 agar plates containing OADC and cyclohexamide (100 ug/ml). Twenty one days later, these plates were examined to assess bacterial load in the mouse lung.
2.5 Mouse survival study
Three groups of 10 mice each, infected with either Wt H37Rv, mce2 or mce1operon mutant strains were followed until they exhibited moribund features (loss of weight, failure to groom, ruffled fur, and lethargy) that occur just prior to death. At this point, mice were anesthetized and then euthanized by cervical dislocation. Health status of the mice was monitored daily by the veterinary staff of the North Animal Facility of UC Berkeley.
2.6 Mouse lung gross pathology and histology
The mouse left lungs fixed in 10% neutral (PBS) buffer formalin were examined and photographed with Digital Nikon 4300 camera. These fixed lungs were embedded in paraffin, sectioned, and stained for histology with hematoxylin and eosin (H&E). Sectioning and staining were performed by Histology Consultation Services, Everson, Washington. For comparative purposes, sections were obtained from the same region of all lungs: 3 sections were obtained from each lung from 3 mice (superior, middle and posterior sections of the lung). Histopathology of 3, 6, 12 and 20 weeks post infection were analyzed. Pathological examination was done by a veterinary pathologist, who was blinded to the sources of the lung sections.
2.7 Statistics
Data are presented from representative experiments as the mean ± SE of triplicate infections. All experiments were repeated at least 3 times. Differences between the means of each treatment group were analyzed by Student’s t test and were considered significant at P< 0.05.
Mouse survival was compared by Kaplan-Meier curve.
3. Results
3.1 Disruption of the mce2 operon
Probes (2kb downstream and upstream flanking regions) to differentiate mce2 operon mutant vs. parental bacterial strain were generated. Upon digestion with HindIII and XmnI and probing with the downstream flanking region (Probe# 2), the expected DNA bands of 4312 bp for the mce2 mutant and 4708 bp for the parental strain, respectively, were found. However, when the upstream flanking region was used as a probe (Probe #1), the expected DNA bands were 4323 bp for the mce2 mutant and 8332 bp for the parental strain. As shown in the Supp. Fig. 3, the desired mce2 operon mutation was successfully generated on the wild type H37Rv bacterial strain background.
3.2 In-vitro growth kinetic analysis of mce2 operon mutant strain
We wished to test whether mce2 operon deletion had any effect on the ability of the mutant bacterium to grow in vitro in 7H9 liquid broth. Bacteria were inoculated into fresh 7H9+ADC media at an optical density recorded at 600 nm of 0.005. Their growth was then monitored for 21 days. Fig. 1A shows that mce2 operon deletion had no effect on the mutant’s ability to grow in liquid broth.
Fig. 1.
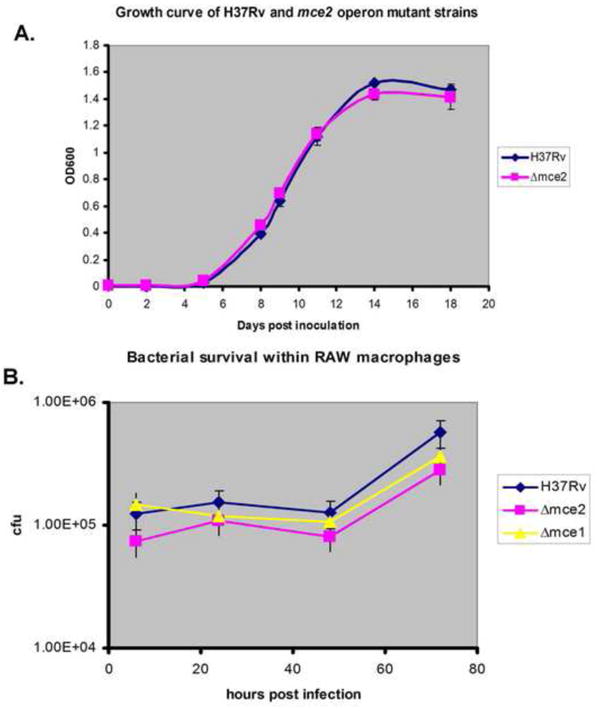
Mycobacterium tuberculosis growth in vitro in liquid broth and its survival within RAW macrophages. (A) M. tuberculosis H37Rv wild type strain and mce2 operon mutant were both grown in 7H9+ADC. The experiment was done in triplicate and these data are based on one of three independent experiments with similar results. (B) Bacterial survival within RAW macrophages over 72 hour time period. Raw cells were infected with wild type H37Rv, mce1 or mce2 operon mutant strains at an MOI of 1:1 and bacterial survival monitored over 72 hours. The experiment was done in triplicate and these data are based on one of three independent experiments with similar results.
3.3 Determination of survival and cytokine and chemokines expression in RAW macrophages infected with the mce2 operon mutant strain
The concentrations of TNF-α, IL-6, IL-12, IL-4, IL-10 and MCP-1 in supernatants of RAW macrophages were measured. We also infected cells with mce1 operon mutant as control. At an MOI of 1:1, we detected production of TNF-α, IL-6, MCP-1, and IL-10 in response to wild type and mce2 operon mutant infection. Production of IL-4 and IL-12 was below the limit of detection in the supernatant of cells infected by these strains.
TNF-α concentration in supernatants increased over time reaching approximately 4,200 pg/ml after 72 hours post infection with the wild type H37Rv strain. Infection with the mce2 operon mutant led to significantly lower amounts of TNF-α production, reaching about 3,300 pg/ml at 72 hours post-infection (P= 0.0124). The most significant difference was observed in the cells infected with mce1 operon mutant, confirming the results previously shown by Shimono et al. [3]. After 72 hours, only about 2,100 pg/ml of TNF-α (P=0.0002) was detected in the supernatants of cells infected with the mce1 operon mutant strain (Fig. 2A).
Fig. 2.
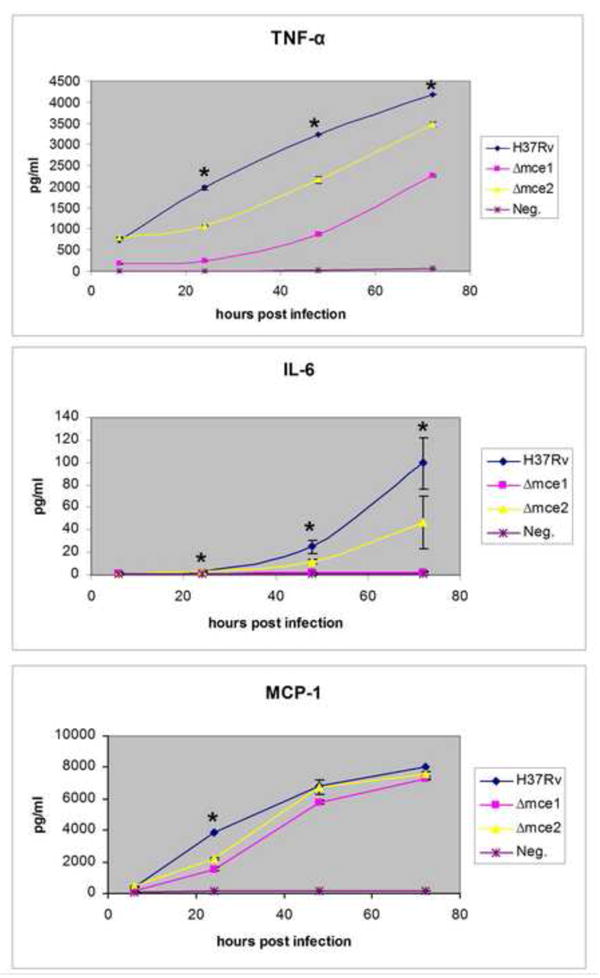
Kinetic analysis of TNF-α (A), IL-6 (B), and MCP-1 (C) production by RAW macrophages infected with H37Rv wild type or mce mutant strains at multiplicity of infection (MOI) of 1:1. Cells were infected and cytokine production assessed over 72 hour time period post infection. Controls included uninfected RAW cells, mce1 operon mutant or LPS (not shown). The experiment was done in triplicate and these data are from one of three independent experiments with similar results. Comparison for statistical significance was made between mce operon mutants vs wild type. (*) Indicates significance where P<0.05.
Concentration of IL-6 in RAW cell supernatants increased over 72 hours for all strains tested. There was about half as much of this cytokine produced in response to mce2 operon mutant compared to when the cells were infected with the wild type strain (50pg/ml vs. 100 pg/ml P=0.047). Infection of cells with the mce1 operon mutant resulted in very low levels of IL-6, nearly indistinguishable from negative control (uninfected cells) (Fig. 2B).
MCP-1 production by RAW cells infected with different mycobacterial strains was similar at all time points other than 24 hours post infection. At 24 hours post infection, there was a significant decrease in MCP-1 produced in response to infection with mce2 operon mutant compared to wild type (2000 pg/ml vs. 4000 pg/ml P=0003). In cells infected with the mce1 operon mutant, levels of MCP-1 produced at this time point were lower than those of mce2 operon infected cells (1,800 pg/ml P=0.0002) (Fig. 2C).
We noted no significant differences in IL-10 concentrations in supernatants of RAW macrophages infected with different bacterial strains (data not shown). Our results show that all M. tuberculosis mce operon mutant strains elicited different levels of cytokine and chemokine production by infected RAW macrophages. To determine whether intracellular bacterial growth rates were related to these differences in cytokine and chemokine production, we monitored intracellular growth rates of the mycobacterial strains in RAW macrophages. The numbers of CFU obtained from RAW cell lysates was similar at day 0 for all M. tuberculosis strains tested and remained as such over the next 72 hours (Fig. 1B).
3.4 Bacterial burden in mouse lungs infected with mce2 operon mutant strain
We observed similar bacterial burdens in the lungs of C57BL/6 mice infected with Wt H37Rv, mce2 and mce1 operon mutant strains up to 20 weeks post infection (Fig. 3). In addition, at time of death, all mice infected with different bacterial strains contained similar bacterial burdens in their lungs ~ 10ˆ6 CFU (data not shown).
Fig. 3.
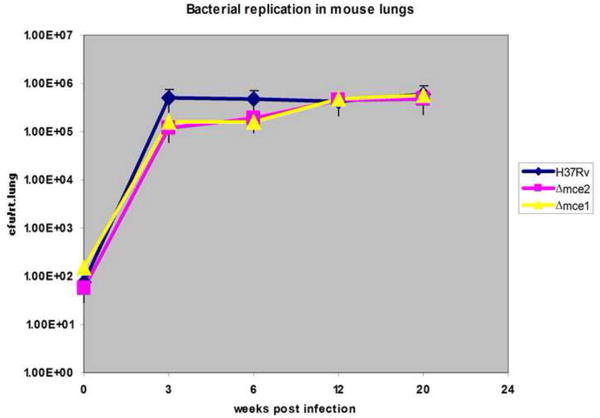
Bacterial replication in mouse lungs at different time points post infection. Recovery of bacteria is determined by cfu enumeration per mouse lung at indicated weeks; the number of cfu is expressed as the mean ± standard deviation (n=3).
3.5 Determination of mouse morbidity
We observed that mice infected with mce1 operon mutant started to die much earlier than those infected with the wild type H37Rv and mce2 operon mutant strains (Fig. 4). More specifically, mice infected with mce1 operon mutant strain began to die at 25 weeks post infection while those infected with the wild type H37Rv and mce2 operon mutant strain began dying at 44.5 and 47.4 weeks post infection, respectively. All 10 of the mice infected with the mce1 operon mutant were dead by 54 weeks post infection. All mice infected with the wild type strain died by week 56 post infection while 80% of the mice infected with the mce2 operon mutant remained alive at this time point.
Fig. 4.
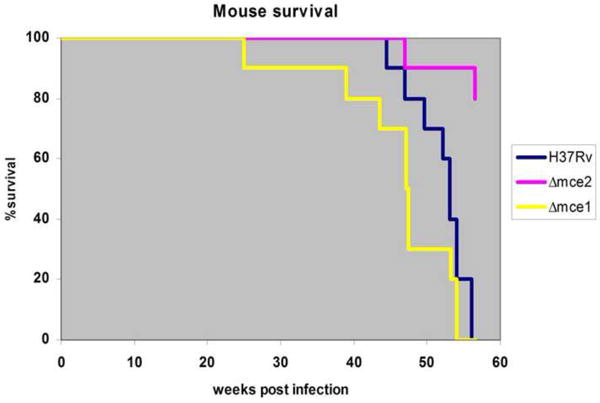
Survival kinetics of C57BL/6 mice infected with M. tuberculosis H37Rv wild type, mce2 operon and mce1 operon mutant strains. Ten mice per strain were initially infected via aerosol infection route and followed for the indicated number of weeks. By week 56 all mice infected with the H37Rv wild type and mce1 operon mutant strain were dead while only 20% of mice infected with the mce2 operon mutant were affected.
3.6 Gross pathology and histology
By 12 and 20 weeks of infection, gross mouse lung pathology examination revealed fewer and more diffuse granulomas in mice infected with the mce2 operon mutant compared to those infected with the wild type strain (Fig. 5). Temporal histopathological assessment of mouse lungs showed slower progression of pulmonary lesions in mice infected with the mce2 operon mutant strain relative to wild type (Fig. 6). We also confirmed the earlier finding by Shimono et al. [3] of severe lung pathology in mice infected with the mce1 operon mutant.
Fig. 5.
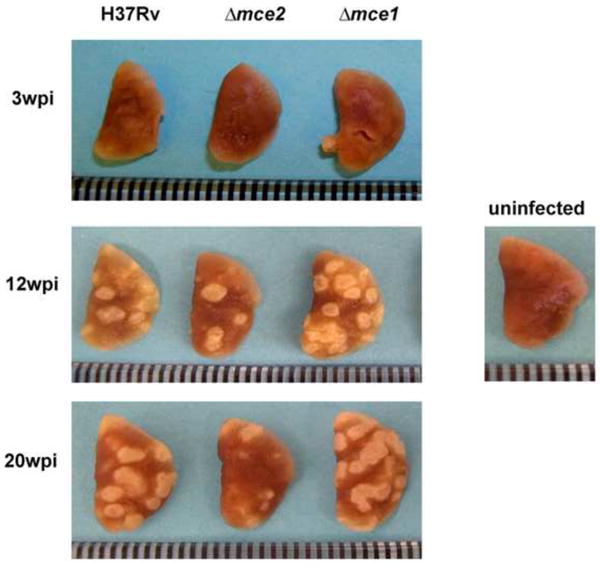
Gross pathology of mouse lungs infected with wild type H37Rv, mce2 operon mutant or mce1 operon mutant strains. Lungs were harvested at different time points post infection. Uninfected mouse lung is shown to represent negative control. Three mice per infection point per mouse strain were sacrificed and the lung was removed for analysis. The lung shown is a representative of such lungs. Ruler marks represent 1mm increments.
Fig. 6.
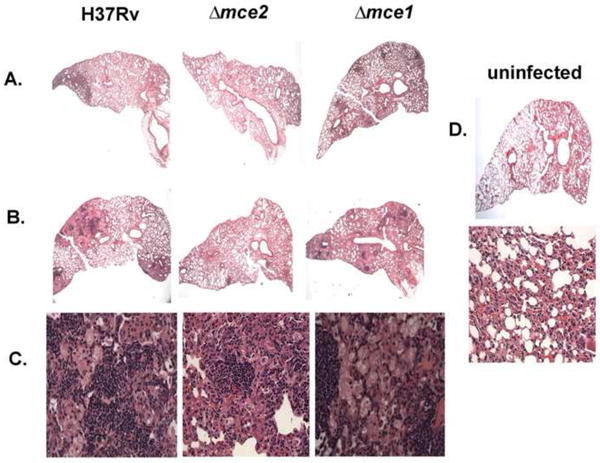
Histology of pulmonary lesions in infected mice. Sections of C57BL/6 mouse lungs magnified x20 (A and B) and x400 (C) and stained with H&E. Mouse lungs were harvested at 3 weeks post infection (A) and 20 weeks post infection (B and C). Also shown is the picture of uninfected mouse lung section (D) magnified x20 and x400. Three mice per infection point were sacrificed. Micrographs shown are representative of multiple mouse lung sections taken from each lung.
The pattern of inflammatory cell infiltrate in all groups of infected mice was similar, with a predominant mixture of lymphocytes and foamy and epithelial macrophages intermingled with minimal numbers of neutrophils. At 3 weeks and 20 weeks of infection, the proportion of lung parenchymal lesion was greater in mice infected with wild type and the mce1 operon mutant than in mice infected with the mce2 mutant (Fig. 6). At 20 weeks, less than 25% of the lung parenchyma had granulomatous lesions in mice infected with the mce2 operon mutant, while the others had 50-75% involvement (Fig. 6).
4. Discussion
We found that M. tuberculosis H37Rv disrupted in the mce2 operon is attenuated in the mouse model of TB. We first showed that the mce2 operon is not essential for bacterial viability in vitro (Fig. 1). This finding is in contrast to that of Sassetti and colleagues, who used transposon site hybridization methodology (TRaSH) to show that yrbE2B gene (a gene in the mce2 operon) is essential for bacterial growth in vitro [15]. The difference is not surprising due to the possible polar effects when transposon mutagenesis is used to disrupt a gene in an operon, as opposed to the in-frame mutation we created for this study. The mce2 operon mutant created by Gioffre et al. also grew normally in vitro [16].
Furthermore, the ability of mce2 operon mutant bacteria to survive within naïve RAW macrophages was similar to that of wild type parental strain. Therefore, we conclude that the genes encoded by the mce2 operon play no role in bacterial replication in vitro or its survival within RAW macrophages.
However, we observed that the levels of TNF-α, IL-6 and MCP-1 were significantly reduced in response to infection of RAW cells with the mce2 operon mutant compared to infection with the wild type H37Rv strain. While cytokine expression patterns observed in RAW cells may not necessarily reflect the in vivo effect of the mutant, we did examine cytokine expression patterns in the mouse lungs at 3, 6, and 12 weeks of infection. However, the results of such measurements involving mixed cells were uninterpretable (data not shown), as we had observed with lung cells from mice infected with the mce1 operon mutant we reported previously [10]. Nevertheless, we were able to reproduce an earlier work, which showed that the mce1 operon mutant was severely deficient in its ability to induce macrophage pro-inflammatory response [3]. We note that, as depicted in Fig. 6, histopathology studies of the lungs are more illustrative of the differences in pro-inflammatory response than cytokine measurements in these types of infection models. We also note that although both mce1 and mce2 operon mutants induced significantly lower levels of pro-inflammatory cytokines than did the wild type H37Rv strain in RAW cells, the levels induced by the mce1 operon mutant was significantly lower compared to those induced by the mce2 operon mutant.
Senaratne et al showed that mce3 and 4 operon mutants, which are attenuated in mice, and wild type M. tuberculosis induced similar levels of the same cytokines in RAW macrophages infected ex-vivo [13]. Thus, the mce2 operon mutant has a phenotype distinct from the other 3 mce operon mutants; compared to the wild type strain, it is attenuated in mice (like the mce3 and 4 mutants), and induces less amount of cytokines in RAW cells (like the mce1 operon mutant). These observations suggest that the in vitro analyses of cytokines produced by macrophages—which may reflect what happens acutely in an in vivo infection--are not predictive of chronic in vivo infection outcomes.
The mouse lung histopathologic findings are consistent with the attenuation we observed in mice infected with the mce2 operon mutant. At 56 weeks post infection, all of the mice infected with the wild type strain had died, whereas 80% of mice infected with the mce2 operon mutant still remained alive. It is interesting to note that mice infected with the mce2 mutant contained a similar number of bacteria in their lungs at all time points post infection when compared to wild type infected mice. Therefore, the attenuation observed with the mce2 operon mutant cannot be attributed to a lower bacterial burden.
Gioffre et al. has also demonstrated that disruption of the mce2 operon led to the attenuation of this strain’s virulence in BALB/c mice when intratracheal route of infection was used [16]. However, in their study, the mce2 operon mutant’s attenuation in mice was associated with decreased bacterial burden and delayed granuloma formation. The mce2 operon mutant examined by Gioffre et al. was constructed by allelic interruption of the mce2A gene, which is not dissimilar to the way our mce2A mutant was constructed. However, the route of infection and infectious inoculum sizes were different--intratracheal and intraperitoneal (as opposed to the aerosol route of infection we used)--at 2 logs higher number of bacteria. Finally, their mouse infection was carried out up to 20 weeks, in contrast to ours which lasted 56 weeks. In their study, all mice infected with the wild type were dead by 9 weeks, which is most likely due to the high inoculum size (2.5×10⁴) and the more susceptible mouse strain (BALB/c) used [16].
Thus, in our study, the longer survival time of mice infected with the mce2 operon mutant could be attributed to a lower bacterial burden and the mouse strain (C57BL/6) we used. In contrast to the mce1 operon mutant, which also induced low levels of cytokine production by RAW cells [3], the mce2 operon mutant showed a lung histology more similar to that produced by wild type H37Rv. That is, the granulomas were tightly organized, with the distribution and number of lymphocytes and macrophages similar to that seen in lungs of mice infected with wild type H37Rv. This could be because the mce2 mutant induced higher levels of pro-inflammatory cytokines than did the mce1 mutant. The main difference was in the proportion of the lung parenchyma affected (Fig. 6). Death of mice seen with the mce1 operon mutant and wild type H37Rv infections appears to be associated with the large proportion (>70%) of the lung parenchymas affected compared to that in mice infected with the mce2 operon mutant at the same time points of infection (Fig. 6).
Thus, this and the previous studies of the mce operon mutants show that each mutant exhibits a distinct phenotype in vivo and in vitro. We and others have recently shown that the M. tuberculosis mce operon families may serve as lipid transporters [17, 18]. The disruption of lipid-modulating functions could alter the lipid-rich M. tuberculosis cell wall composition, which in turn could affect how a host mounts an immune response. Thus, the differences we saw in mouse immune response and clinical outcome may be mediated not necessarily by the differences in bacterial protein products expressed or not expressed by the respective operons but by the structural changes in cell wall that result from the disruption of these operons. These observations suggest the importance of a system-biology approach to characterize a host-pathogen relationship that determines the ultimate fate of an infection with M. tuberculosis.
Supplementary Material
Schematic representation of mce operons [19].
Schematic representation of mce2 operon deleted region.
Southern blot analysis of chromosomal DNA from wild type H37Rv and mce2 operon mutant strains digested with XmnI and HindIII and probed with Probe#1 (A) or Probe #2 (B). Lane 1 DNA MW marker VII; lane 2 Wt H37Rv; lane 3 mce2 operon mutant (clone#1); lane 4 mce2 operon mutant (clone#2); lane 5 DNA MW marker II.
Acknowledgments
We thank Nicola Casali and Ryan Senaratne for helpful discussions.
Funding: This project was supported in part by the Center for AIDS Research Grant and NIAID Grant RO1AI035266.
Footnotes
Competing interests: None declared.
Ethical Approval: Not required.
Publisher's Disclaimer: This is a PDF file of an unedited manuscript that has been accepted for publication. As a service to our customers we are providing this early version of the manuscript. The manuscript will undergo copyediting, typesetting, and review of the resulting proof before it is published in its final citable form. Please note that during the production process errors may be discovered which could affect the content, and all legal disclaimers that apply to the journal pertain.
References
- 1.WHO. The world Health Report 2004: changing history. Geneva: World Health Organization; 2004. [Google Scholar]
- 2.Chitale S, Ehrt S, Kawamura I, Fujimura T, Shimono N, Anand N, Lu S, Cohen-Gould L, Riley LW. Recombinant Mycobacterium tuberculosis protein associated with mammalian cell entry. Cellular Microbiology. 2001;4:247–254. doi: 10.1046/j.1462-5822.2001.00110.x. [DOI] [PubMed] [Google Scholar]
- 3.Shimono N, Morici L, Casali N, Cantrell S, Sidders B, Ehrt S, Riley LW. Hypervirulent mutant of Mycobacterium tuberculosis resulting from disruption of the mce1 operon. Proc Natl Acad Sci USA. 2003;100:15918–15923. doi: 10.1073/pnas.2433882100. [DOI] [PMC free article] [PubMed] [Google Scholar]
- 4.Tekaia F, Gordon SV, Garnier T, Brosch R, Barrell BG, Cole ST. Analysis of the proteome of Mycobacterium tuberculosis in silico. Tuber Lung Dis. 1999;79:329–342. doi: 10.1054/tuld.1999.0220. [DOI] [PubMed] [Google Scholar]
- 5.Arruda S, Bomfim G, Knights R, Huima-Byron T, Riley LW. Cloning of an M. tuberculosis DNA fragment associated with entry and survival inside cells. Science. 1993;261:1454–1457. doi: 10.1126/science.8367727. [DOI] [PubMed] [Google Scholar]
- 6.Kumar GB, Black PN. Bacterial long-chain fatty acid transport. Identification of amino acid residues within the outer membrane protein FadL required for activity. J Biol Chem. 1993;268(21):15469–76. [PubMed] [Google Scholar]
- 7.Talaat AM, et al. The temporal expression profile of Mycobacterium tuberculosis infection in mice. Proc Natl Acad Sci U S A. 2004;101(13):4602–7. doi: 10.1073/pnas.0306023101. [DOI] [PMC free article] [PubMed] [Google Scholar]
- 8.Haile Y, Bjune G, Wiker HG. Expression of the mceA, esat-6 and hspX genes in Mycobacterium tuberculosis and their responses to aerobic conditions and to restricted oxygen supply. Microbiology. 2002;148(Pt 12):3881–6. doi: 10.1099/00221287-148-12-3881. [DOI] [PubMed] [Google Scholar]
- 9.Casali N, White AM, Riley LW. Regulation of the Mycobacterium tuberculosis mce1 operon. J Bacteriology. 2006;188:441–449. doi: 10.1128/JB.188.2.441-449.2006. [DOI] [PMC free article] [PubMed] [Google Scholar]
- 10.Uchida Y, et al. Accelerated immunopathological response of mice infected with Mycobacterium tuberculosis disrupted in the mce1 operon negative transcriptional regulator. Cell Microbiol. 2007;9(5):1275–83. doi: 10.1111/j.1462-5822.2006.00870.x. [DOI] [PubMed] [Google Scholar]
- 11.Santangelo MP, et al. Study of the role of Mce3R on the transcription of mce genes of Mycobacterium tuberculosis. BMC Microbiol. 2008;8:38. doi: 10.1186/1471-2180-8-38. [DOI] [PMC free article] [PubMed] [Google Scholar]
- 12.Santangelo MP, et al. Negative transcriptional regulation of the mce3 operon in Mycobacterium tuberculosis. Microbiology. 2002;148(Pt 10):2997–3006. doi: 10.1099/00221287-148-10-2997. [DOI] [PubMed] [Google Scholar]
- 13.Senaratne RH, et al. Mycobacterium tuberculosis strains disrupted in mce3 and mce4 operons are attenuated in mice. J Med Microbiol. 2008;57(Pt 2):164–70. doi: 10.1099/jmm.0.47454-0. [DOI] [PubMed] [Google Scholar]
- 14.Parish T, Stoker NG. Use of a flexible cassette method to generate a double unmarked Mycobacterium tuberculosis tlyA plcABC mutant by gene replacement. Microbiology. 2000;146:1969–1975. doi: 10.1099/00221287-146-8-1969. [DOI] [PubMed] [Google Scholar]
- 15.Sassetti CM, Rubin EJ. Genetic requirements for mycobacterial survival during infection. Proc Natl Acad Sci U S A. 2003;100(22):12989–94. doi: 10.1073/pnas.2134250100. [DOI] [PMC free article] [PubMed] [Google Scholar]
- 16.Gioffre A, et al. Mutation in mce operons attenuates Mycobacterium tuberculosis virulence. Microbes Infect. 2005;7(3):325–34. doi: 10.1016/j.micinf.2004.11.007. [DOI] [PubMed] [Google Scholar]
- 17.Casali N, Riley LW. A phylogenomic analysis of the Actinomycetales mce operons. BMC Genomics. 2007;8:60. doi: 10.1186/1471-2164-8-60. [DOI] [PMC free article] [PubMed] [Google Scholar]
- 18.Pandey AK, Sassetti CM. Mycobacterial persistence requires the utilization of host cholesterol. Proc Natl Acad Sci U S A. 2008;105(11):4376–80. doi: 10.1073/pnas.0711159105. [DOI] [PMC free article] [PubMed] [Google Scholar]
- 19.TubercuList. http://genolist.pasteur.fr/TubercuList/
Associated Data
This section collects any data citations, data availability statements, or supplementary materials included in this article.
Supplementary Materials
Schematic representation of mce operons [19].
Schematic representation of mce2 operon deleted region.
Southern blot analysis of chromosomal DNA from wild type H37Rv and mce2 operon mutant strains digested with XmnI and HindIII and probed with Probe#1 (A) or Probe #2 (B). Lane 1 DNA MW marker VII; lane 2 Wt H37Rv; lane 3 mce2 operon mutant (clone#1); lane 4 mce2 operon mutant (clone#2); lane 5 DNA MW marker II.


