

Abstract
The pedunculopontine tegmentum nucleus (PPT) is critically involved in the regulation of wakefulness (W) and rapid eye movement (REM) sleep, but our understanding of the mechanisms of this regulation remains incomplete. The present study was designed to determine the role of PPT intracellular calcium/calmodulin kinase (CaMKII) signaling in the regulation of W and sleep. To achieve this aim, three different concentrations (0.5, 1.0, and 2.0 nmol) of the CaMKII activation inhibitor, KN-93, were microinjected bilaterally (100 nl/site) into the PPT of freely moving rats, and the effects on W, slow-wave sleep (SWS), REM sleep, and levels of phosphorylated CaMKII (pCaMKII) expression in the PPT were quantified. These effects, which were concentration-dependent and affected wake–sleep variables for 3 h, resulted in decreased W, due to reductions in the number and duration of W episodes; increased SWS and REM sleep, due to increases in episode duration; and decreased levels of pCaMKII expression in the PPT. Regression analyses revealed that PPT levels of pCaMKII were positively related with the total percentage of time spent in W (R2 = 0.864; n = 28 rats; p < 0.001) and negatively related with the total percentage of time spent in sleep (R2 = 0.863; p < 0.001). These data provide the first direct evidence that activation of intracellular CaMKII signaling in the PPT promotes W and suppresses sleep. These findings are relevant for designing a drug that could treat excessive sleepiness by promoting alertness.
Introduction
In a growing body of literature, ranging in scope from studies on developmental maturation to genetic models of Alzheimer's, it is evident that activation of pedunculopontine tegmental (PPT) cells plays a pivotal role in the regulation of rapid eye movement (REM) sleep and wakefulness (W) in both animals and humans (Pace-Schott and Hobson, 2002; Jones, 2004; Datta and Maclean, 2007; Lim et al., 2007; Lydic and Baghdoyan, 2008; Garcia-Rill et al., 2008; Datta et al., 2009). The PPT is situated in the dorsolateral tegmentum and contains both a prominent group of cholinergic neurons, as well as some noncholinergic neurons which, collectively, project widely throughout the brainstem and forebrain (Mesulam et al., 1983; Garcia-Rill, 1991; Thakkar et al., 1998; Jones, 2004; Wang and Morales, 2009). The regulation of REM sleep and W each involve important processes of neurotransmitter-mediated excitation and inhibition of PPT cells (Datta, 2010). For example, neuropharmacological and physiological studies have demonstrated that glutamate activation of kainate receptors on PPT cholinergic cells induces REM sleep, whereas glutamate activation of NMDA receptors induces W (Datta and Siwek, 1997; Datta et al., 2001, 2002; Datta, 2002). On the other hand, GABA activation of GABA-B receptors inhibits PPT cholinergic cells, which in turn suppresses both REM sleep and W (Ulloor et al., 2004; Datta, 2007).
Coordinated regulation of intracellular signaling pathways is essential for the receptor activation-mediated transcription and translation processes that control the neuronal functions that appear to underlie complex behavioral responses, including regulation of wake–sleep states (Datta, 2010). Recent studies using a combination of pharmacological and molecular techniques have demonstrated that activation of the cAMP-dependent protein kinase A (cAMP-PKA) signal transduction pathway within the PPT is involved in the induction of REM sleep (Datta and Prutzman, 2005; Bandyopadhya et al., 2006; Datta and Desarnaud, 2010). Although activation of PPT cells is also critical for the induction of W, the intracellular signaling mechanisms that induce W remain poorly understood. One recent study has demonstrated that calcium/calmodulin kinase (CaMKII, a serine/threonine kinase protein) activity in the PPT increases during W (Stack et al., 2010). It is also known that activation of NMDA receptors activates CaMKII by increasing phosphorylation (Colbran, 1992; Strack and Colbran, 1998; Leonard et al., 1999; Soderling, 2000). Therefore, we hypothesized that the CaMKII signaling pathway in the PPT plays a causal role in the induction of W.
To test this hypothesis, we first determined whether application of KN-93 (an inhibitor of CaMKII activation) into the PPT could block W. Then, we quantified the levels of CaMKII phosphorylation (pCaMKII) in the PPT of rats treated with KN-93 or vehicle control. Application of KN-93 into the PPT suppressed pCaMKII expression and percentage of time spent in W. This reduction in W was compensated with an increase in both slow-wave sleep (SWS) and REM sleep. Finally, a regression analysis indicated that this KN-93 microinjection-induced reduction in W was indeed predicted by the reduction in CaMKII activity. These results provide the first direct evidence that in the PPT, CaMKII is a critical molecular pathway for the regulation of the wake–sleep cycle, especially W.
Materials and Methods
Subjects and housing.
Experiments were performed on 28 adult male Wistar rats (Charles River) weighing between 250 and 350 g. The rats were housed individually at 24°C with ad libitum access to food and water. Lights were on from 7:00 A.M. to 7:00 P.M. (light cycle) and off from 7:00 P.M. to 7:00 A.M. (dark cycle). Experiments were performed in accordance with the NIH Guide for the Care and Use of Laboratory Animals and were approved by the Boston University Animal Care Committee (AN-14084). Additional care was taken to ensure that any potential discomfort was eliminated and the number of animals used was minimized. To reduce additional stress that might be imposed by experimental handling, animals underwent a period of habituation during which they were gently handled daily for 15–20 min between 9:00 A.M. and 10:00 A.M. (beginning 1 week before surgery and continuing up to the experimental recording sessions).
Surgical procedures for electrode and guide tube implantation.
All surgical procedures were performed stereotaxically under aseptic conditions. Animals were anesthetized with pentobarbital (40 mg/kg, i.p.; Ovation Pharmaceuticals), placed in the stereotaxic apparatus, and secured using blunt rodent ear bars, as described previously (Paxinos and Watson, 1997). The appropriate depth of anesthesia was judged by the absence of palpebral reflexes and the absence of response to tail pinch. Core body temperature was maintained at 37° ± 1°C with a thermostatic heating pad and a rectal thermistor probe. Initially, the scalp was cleaned and painted with povidone iodine. A scalp incision was then made, the skin was retracted, and the skull surface was cleaned in preparation for electrode implantation. Upon completion of the surgical procedure, animals were administered saline (5 cc, s.c.) to prevent dehydration, ampicillin (50 mg/rat, i.m.; Bristol-Myers Squibb Company) to control potential postsurgical infection, and buprenorphine (0.05 mg/kg, s.c.; Ben Venue Laboratories) to control potential postoperative pain.
To record behavioral states of vigilance, cortical electroencephalogram (EEG), dorsal neck muscle electromyogram (EMG), and hippocampal EEG (theta wave) recording electrodes were chronically implanted, as described previously (Datta, 2000, 2002; Datta et al., 2002). In addition, stainless steel guide tubes (26-gauge) with equal length stylettes were stereotaxically implanted bilaterally 2 mm above the PPT (in relation to stereotaxic “0”: anterior, 1.0; lateral, 1.8; horizontal, 3.0; Paxinos and Watson, 1997), as described previously (Datta, 2002; Datta et al., 2001, 2002). All electrodes and guide tubes were secured to the skull with dental acrylic, and the electrodes were then crimped to mini-connector pins and brought together in a plastic connector. Immediately after surgery, animals were placed in recovery cages and monitored for successful recovery from anesthesia and surgery. Successful recovery was gauged by the return of normal posture, voluntary movement, and grooming.
Adaptation recording session.
After a postsurgical recovery period of 3–7 d, rats were habituated to the experimenter, the sound-attenuating recording cage (electrically shielded: 2.5 × 1.5 × 1.5 feet), and free-moving polygraphic recording (Grass Model 15 Neurodata Amplifier System, Astro-Med) conditions for 7–10 d. All adaptation recording sessions were performed between 10:00 A.M. and 4:00 P.M., when rats are normally sleeping. These 6 h habituation sessions were also considered to be baseline recording sessions for electrode testing and monitoring daily variations in wake–sleep activity. The last day of these adaptation recording sessions was determined when, for 3 consecutive days, day-to-day variation in the percentage of REM sleep was <5% of the total amount of REM sleep. During the periods of recovery and habituation, all rats were housed under the same 12 h light/dark cycle with free access to food and water.
Drug and vehicle control microinjections.
The drug used in this study was a specific membrane-permeable inhibitor of CaMKII activation, {2-[N-(2-hydroxyethyl)-N-(4-methoxybenzenesulfonyl)] amino-N-(4-chlorocinnamyl)-N-methylbenzylamine} (KN-93; mol. wt. 501.0), purchased from Calbiochem, EMD Biosciences Inc.). The KN-93 solution was diluted in 0.9% saline at three concentrations (0.5, 1.0, and 2.0 nmol/100 nl). Saline (0.9%, 100 nl) was used for the vehicle control microinjection. Control saline and drug solutions were freshly prepared under sterile conditions immediately before each use. The selection of this drug was based on its selective inhibitory effect on intracellular CaMKII activation (Tokumitsu et al., 1990; Ogawa et al., 2005; Seo et al., 2008; Shioda et al., 2011). Commercially available KN-93 is suitable for microinjection studies because it is water soluble, cell-permeable, and has reversible effects. It has also been used successfully in past microinjection studies in behaving animals (Pierce et al., 1998; Fleegal and Sumners, 2003; Licata et al., 2004; Ogawa et al., 2005; Sakurai et al., 2007; Loweth et al., 2008; Seo et al., 2008; Myskiw et al., 2010; Ota et al., 2010; Shioda et al., 2011).
Polygraphic recordings and determination of behavioral states.
To record cortical EEG, EMG, and hippocampal EEG in freely moving conditions, each head plug was mated to a male connector connected to a commutator. Signals from the commutator went to a polygraph (Grass Model 15 Neurodata Amplifier System, Astro-Med), located in the next room, via its electrode board (located close to the recording chamber). For determining possible effects on sleep and wakefulness, polygraphic data were captured on-line in a computer using Gamma software (Grass product group, Astro-Med). One investigator blinded to the treatment conditions scored this captured data visually using Rodent Sleep Stager software (Grass product group, Astro-Med). Three behavioral states were distinguished: W, SWS, and REM sleep. The physiological criteria for the identification of these wake–sleep states are described in detail in earlier publications (Datta et al., 2002, 2004). In this study, the behavioral states of W, SWS, and REM sleep were scored in successive 5 s epochs. In this study, our visual inspection did not show any qualitative differences in cortical and hippocampal EEG signs of W and sleep stages among the 4 different treatment conditions, therefore, FFT analysis was not warranted.
Localized microinjections of KN-93 and vehicle control into the PPT.
The microinjection system consisted of a 32-gauge stainless steel injector cannula with a 26-gauge collar that extended 2.0 mm beyond the implanted guide tube. The collar was connected to a 1.0 μl motor-driven Hamilton microsyringe with PE 20 tubing. While the animal was connected to the recording system, the stylettes were removed and an injector filled with either vehicle control (100 nl volume of 0.9% saline) or one of the three concentrations of KN-93 (0.5, 1.0, and 2.0 nmol/100 nl) was introduced through one of the bilateral guide tubes for injection. This procedure was then repeated in the other guide tube. One minute after the insertion of the injector cannulae, 100 nl of control saline or one of the three concentrations of KN-93 was bilaterally microinjected over a 60 s period (Pump II Pico Plus, Harvard Apparatus). The injector cannulae were gently withdrawn 2 min after the injections, and the stylettes were reinserted into the guide tubes. During the microinjections, animals were free to move around the cage with the cannulae in place. Each rat received a total of two microinjections (100 nl each, one in the right and one in the left PPT) in a single experimental recording session.
Many microinjection studies have shown that a major advantage of the microinjection technique is its ability to stimulate a relatively circumscribed neuronal pool (Capece and Lydic, 1997; Datta et al., 2001, 2002). This view is supported by the biophysical studies of drug diffusion (Nicholson, 1985) and distribution kinetics (Herz and Teschemacher, 1971; Martin, 1991). Diffusion data obtained from radio-labeled drug studies showed that 30 min after brain microinjections of 500 nl volumes, 72% of the drug remained within a radius of 0.75 mm (Yaksh and Rudy, 1978). In this study, the target area of the 100 nl drug solutions injected into the PPT (approximate size: length: 1.0 mm; height: 1.0 mm; and width: 0.8 mm) was well within the diffusion limit of this small volume. Moreover, in our recent microinjection mapping study in the PPT, it was demonstrated that 100 nl of glutamatergic, GABAergic, and intracellular signal transduction activators and inhibitors, with drug concentrations similar to those used in this experiment, were ineffective when injections were 0.5 mm away from the center of the PPT (Datta et al., 2001; Datta, 2002, 2007; Ulloor et al., 2004; Datta and Desarnaud, 2010). Additionally, using similar microinjection techniques and volumes, we demonstrated that ibotenic acid microinjection-induced cell loss in the brainstem of rats was limited to a maximum radius of 0.35 mm (Mavanji et al., 2004). Since no other wake–sleep-related structure is within 1 mm of the PPT microinjection site (Datta et al., 2009), it is highly improbable that the microinjected KN-93 used in this study (100 nl volume and 0.5–2.0 nmol concentrations) diffused into the neighboring wake–sleep areas in the brainstem. Therefore, we are confident that the significant pharmacological effects observed after microinjection of KN-93 occurred only within the PPT.
There is one major limitation of this study relating to the diversity in the neurochemical and functional nature of the neuronal population affected by the drug application. KN-93 was microinjected into an area of the PPT that is comprised primarily of cholinergic cells (Mesulam et al., 1983; Jones and Beaudet, 1987; Rye et al., 1987; Vincent and Reiner, 1987; Datta et al., 2009). However, the PPT also contains some noncholinergic cells (Kosaka et al., 1988; Clements and Grant, 1990; Ford et al., 1995; Liu et al., 1995; Wang and Morales, 2009), so it is possible that they were also affected by the application of KN-93. In addition, we acknowledge that methodological limitations precluded histological confirmation of the microinjection sites. However, it is unlikely that the observed PPT microinjection effects in this study were influenced by diffusion into neighboring wake–sleep-related areas in the brainstem because, unlike in the PPT, in the neighboring brainstem area of the medial pontine reticular formation the levels of pCaMKII expression increase with increased sleep and decrease with increased W (Stack et al., 2010).
Experimental design.
On the day after the last adaptation recording session, when day-to-day variation in the total amount of REM sleep had stabilized, experimental recording sessions began, during which each animal was connected to the polygraphic recording system at 9:55 A.M. The 28 rats were randomly divided into four groups. Group 1 (n = 7 rats): Animals received bilateral microinjections of vehicle control (0.9% saline, 100 nl in the right and 100 nl in the left PPT) at 10:00 A.M. while being recorded for a 6 h session (between 10:00 A.M. and 4:00 P.M.) of undisturbed wake–sleep activity (hereafter, Group 1 is labeled as vehicle control). The experimental protocol for Group 2 (n = 7 rats) was almost identical to that of vehicle control, except that Group 2 animals were microinjected with a 0.5 nmol (in a volume of 100 nl) concentration of KN-93. The experimental protocol for Group 3 (n = 7 rats) was also nearly identical to that of vehicle control, except that Group 3 animals were microinjected with a 1.0 nmol concentration of KN-93. The experimental protocol for Group 4 (n = 7 rats) was likewise similar to that of vehicle control, except that Group 4 animals were microinjected with a 2.0 nmol concentration of KN-93. Postinjection wake–sleep values of the drug-treated groups were then compared with those of the vehicle control-treated group to examine the effects of different concentrations of KN-93 application into the PPT.
To study what effects KN-93 microinjections into the PPT had on pCaMKII expression and to determine the relationship between the levels of pCaMKII expression in the PPT and the amount of time spent in W, these animals were subjected to a second microinjection recording session. The second microinjection recording session began 7–10 d after the first microinjection recording session. The grouping and experimental procedure for both were similar, except that for the second session, after microinjections, animals were recorded for only 3 h (between 10:00 A.M. and 1:00 P.M.). Since the goal of this study was to identify the role of CaMKII activity in the PPT, immediately after the end of the 3 h recording session, the rats were quickly killed to quantify pCaMKII expression in the PPT. The 3 h postinjection wake–sleep values of the drug-treated groups were then compared with those of the vehicle-control-treated group to examine the various concentration-dependent effects of KN-93 application into the PPT.
Tissue collection.
Immediately after the end of the experimental recording session (at 1:00 P.M.), rats were killed with carbon dioxide, and the brains were quickly removed and frozen using dry ice. To minimize possible variations due to differences in wake–sleep state at time of death, all animals were awakened (by shaking their cages) and kept awake for 1 min before they were killed. To rule out any diurnal factors contributing to the different levels of pCaMKII expression in the different groups, all rats were killed at a fixed time of day, as described above. The frozen brains were cut in the transverse plane in 300 μm thick sections with a Vibratome (series 3000; Technical Products International). Under a dissecting microscope, the PPT was dissected on an ice-chilled Petri dish, as described earlier (Ulloor and Datta, 2005; Bandyopadhya et al., 2006; Datta et al., 2008; Datta and Desarnaud, 2010). The PPT tissue collection region was: anteroposterior, between 7.7 mm and 8.7 mm posterior to the bregma; medial-lateral, between 1.5 mm and 2.5 mm lateral to the midline (Paxinos and Watson, 1997). The dissected tissues from the PPT region, containing tissues from both the left and right sides of the brain of each individual rat, were stored separately in prechilled microcentrifuge tubes at −80°C until assayed.
Western blotting for the quantification of pCaMKII expression.
The individual frozen PPT tissue samples were rapidly homogenized on ice using a tissue Dounce in 500 μl of an ice-cold tissue lysate buffer containing 50 mm Tris-HCl, pH 7.4, 1.5% Triton X-100, 150 mm sodium chloride, 5 mm EDTA, 1 mm sodium orthovanadate, 25 mm sodium fluoride, 5 mm phenylmethylsulfonyl fluoride, 2 μg/ml pepstatin A and 1 Mini tablet (Roche). The lysate was then centrifuged at 20,000 × g for 10 min at 4°C. The crude protein extract contained in the supernatant was removed from each sample and assayed for total protein concentration using a bicinchoninic acid assay kit (Thermo Fisher Scientific), measuring the spectrophotometric signal at 562 nm with a Benchmark Plus spectrophotometer (Bio-Rad). An appropriate volume of 4× sample buffer was added to the homogenate, and the sample was incubated in a 95°C water bath for 5 min. Ten microgram amounts of protein were loaded onto each lane of 10% SDS-polyacrylamide gels and resolved by standard electrophoresis (Bio-Rad minigel apparatus, Bio-Rad). The gels were blotted electrophoretically to polyvinylidene difluoride (PVDF) membranes (Millipore) using a transfer tank maintained at 4°C, with typical parameters being a 1 h transfer at a constant current of 350 mA. PVDF membranes were blocked for 1 h at 24°C in buffer containing 10 mm PBS, pH 7.4, 0.1% Tween 20 (PBST) and supplemented with 5% nonfat dry milk (Bio-Rad). To assess pCaMKII expression, PVDF membranes were incubated overnight at 4°C in PBST containing 5% bovine serum albumin and an anti-pCaMKII antibody (α subunit, Thr286; clone 22B1; Millipore) at a 1:2000 dilution. Next, PVDF membranes were incubated for 2 h at 24°C in PBST containing 5% nonfat dry milk and an HRP-conjugated anti-rabbit secondary antibody (GE Healthcare), also at a 1:2000 dilution. Blots were washed extensively in PBST after incubations with the primary and secondary antibodies (typically three washes, each for 5–10 min). Variations of pCaMKII amounts due to sample preparation and protein loading onto the electrophoresis gels were controlled by subsequent assessment of α-tubulin immunoreactivity on the same PVDF membrane. To prepare reprobing with an anti α-tubulin mouse monoclonal antibody (clone DM1A, Millipore), blots were incubated at 70°C in three changes of stripping buffer (150 mm Tris-HCl, pH 6.8, 100 mm β-mercaptoethanol and 2% SDS) with constant agitation for a total of 1 h. The blots were then extensively washed with PBST and blocked for 1 h at room temperature in PBST containing 5% nonfat dry milk. The blots were incubated sequentially overnight at 4°C with the anti α-tubulin antibody at a 1:1000 dilution and for 2 h at room temperature with an HRP-conjugated anti-mouse secondary antibody (GE Healthcare) at a 1:5000 dilution. The resulting immunocomplexes were detected with a chemiluminescent substrate (SuperSignal, WestDura, Pierce). Quantification of the immunoreactive bands was performed using a Kodak Imaging Station (PerkinElmer). The net intensity of each pCaMKII chemiluminescent signal was normalized with the net intensity of the corresponding α-tubulin signal.
Statistical analysis.
To determine the effects of intra-PPT microinjections of KN-93 on changes in wake–sleep data, the polygraphic measures of the rats were analyzed to calculate the following dependent variables, which were quantified for each recording session: (1) percentage of recording time spent in W, SWS, and REM sleep; (2) latency to onset of the first episode of SWS and REM sleep; (3) total number of W, SWS, and REM sleep episodes; and (4) mean duration of W, SWS, and REM sleep episodes. The effects of the four different treatments (vehicle control; 0.5 nmol KN-93; 1.0 nmol KN-93; and 2.0 nmol KN-93) on the percentages of W, SWS, and REM sleep were statistically analyzed using a two-way ANOVA with time as a repeated measure variable (six levels corresponding to six 1 h epochs following injections) and treatment as a between-group variable (four levels corresponding to the four different treatment groups). Following the two-way ANOVA, post hoc Bonferroni post-tests were conducted to determine the individual levels of significant difference between the control vehicle and the three different drug concentrations at six individual data points. These post hoc tests were also used to compare the three different drug treatment protocols with each other. The latency, number, and duration data were analyzed using a one-factor ANOVA followed by post hoc Bonferroni's multiple-comparison tests. One-factor ANOVAs and post hoc tests (Bonferroni's multiple-comparison test) were used to compare the levels of PPT pCaMKII expression in the vehicle control, 0.5 nmol KN-93, 1.0 nmol KN-93, and 2.0 nmol KN-93 treatment groups. To assess the causal relationship between the levels of PPT pCaMKII expression and the percentages of time spent in W and sleep during the 3 h period of the second experimental recordings (between 10:00 A.M. and 1:00 P.M.), linear regression analysis was performed between pCaMKII expression and total percentages of time spent in W and sleep. Before individual statistical tests, group data were subjected to normality testing, which confirmed that normality assumptions were met. The threshold for significance was p < 0.05. All statistical analyses were performed using GraphPad Prism statistical software (v5.0).
Results
Wake–sleep state effects of KN-93 microinjections into the PPT
During the final 6 h baseline recording session (between 10:00 A.M. and 4:00 P.M., before PPT microinjections), there were no significant differences among the four treatment groups of animals (vehicle control, 0.5 nmol KN-93, 1.0 nmol KN-93, and 2.0 nmol KN-93) in terms of total percentage of time spent in W, SWS, and REM sleep; latency to the onset of the first episodes of SWS and REM sleep; and total number and mean duration of W, SWS, and REM sleep episodes. Thus, under final baseline recording conditions, the groups were equal in terms of wake–sleep variables. Additionally, in the vehicle control group of rats, the first microinjection recording session was comparable to the final baseline recording session in terms of time spent in W (final baseline recording session vs first microinjection recording session; 29.2 ± 3.3% vs 33.17 ± 2.2%), SWS (60.8 ± 2.0% vs 58.01 ± 2.3%), and REM sleep (10.03 ± 1.6% vs 9.01 ± 0.44%); latency to the first episode of SWS (20.4 ± 4.0 min vs 24.0 ± 4.0 min) and REM sleep (41.5 ± 4.2 min vs 46.7 ± 3.23 min); number of W (154.8 ± 4.2 vs 160.0 ± 5.51), SWS (155.2 ± 5.4 vs 152.0 ± 4.54), and REM sleep episodes (27.0 ± 1.2 vs 25.6 ± 1.5); and mean duration of W (79.5 ± 4.0 s vs 84.9 ± 3.02 s), SWS (84.0 ± 4.0 s vs 81.3 ± 3.43 s), and REM sleep (87.0 ± 4.0 s vs 84.9 ± 3.02 s) episodes. These results suggest that, during the first microinjection recording session, microinjection of vehicle control did not significantly change normal wake–sleep state variables.
Effects on wakefulness
The changes in W after bilateral microinjections of vehicle control and the different concentrations of KN-93 into the PPT are summarized in Figure 1. A two-way ANOVA on the total percentages of W indicated a significant main effect of treatment (F = 25.41; df = 3, 167; p < 0.001), time (F = 16.55; df = 5, 167; p < 0.001), and a treatment × time interaction (F = 16.98; df = 15, 167; p < 0.001). The results of post hoc analysis (Bonferroni post-test) of the total percentages of time spent in W are presented in Figure 1A. Post hoc analysis indicated that after microinjections of 0.5 nmol concentration of KN-93, the total percentage of time spent in W was significantly decreased during the first (p < 0.001) and second (p < 0.001) hours of the postinjection period, compared with vehicle control microinjections. Similar post hoc comparisons revealed that, after microinjections of 1.0 nmol and 2.0 nmol concentrations of KN-93, the total percentage of W was significantly decreased during the first (1.0 nmol: p < 0.001; 2.0 nmol: p < 0.001), second (1.0 nmol: p < 0.001; 2.0 nmol: p < 0.001) and third hours (1.0 nmol: p < 0.001; 2.0 nmol: p < 0.001) of the postinjection period (Fig. 1A). Having observed these changes in the total percentage of time spent in W after microinjections of three different concentrations of KN-93, we investigated whether this decreased W was due to changes in the number and/or duration of W episodes. One-way ANOVAs indicated significant changes in both the total number (F = 9.75; df = 3, 24; p < 0.001) and mean duration (F = 10.5; df = 3, 24; p < 0.001) of W episodes among the three different treatment groups. Post hoc analyses (Bonferroni post-tests) indicated that the number of W episodes was significantly reduced after microinjections of 1.0 nmol (p < 0.01) and 2.0 nmol (p < 0.001) concentrations of KN-93, compared with vehicle control microinjections (Fig. 1B). Similar post hoc analyses revealed that the mean duration of W episodes was also decreased significantly after microinjections of 1.0 nmol (p < 0.01) and 2.0 nmol (p < 0.001) concentrations of KN-93, compared with vehicle control microinjections (Fig. 1C). Collectively, these results suggest that the application of KN-93 into the PPT decreased the total amount of time spent in W in a concentration-dependent manner, and that this reduction of W was due to the decrease in both the number and duration of W episodes.
Figure 1.

Effects of vehicle control (saline) and three different concentrations of KN-93 microinjected bilaterally into the PPT on W. These effects were observed during the 6 h wake–sleep recording periods that immediately followed microinjections. A, Bars represent percentages (mean ± SE) of time spent in W. B, Bars represent total number (mean ± SE) of W episodes. C, Bars represent duration (mean ± SE) of W episodes. Asterisks indicate the levels of statistical significance (post hoc tests, Bonferroni post-test) of the differences relative to vehicle control: *p < 0.05; **p < 0.01; ***p < 0.001.
Effects on SWS
The changes in SWS after bilateral microinjections of vehicle control and the different concentrations of KN-93 into the PPT are summarized in Figure 2. A two-way ANOVA on the total percentages of SWS indicated a significant main effect of treatment (F = 14.49; df = 3, 167; p < 0.001), time (F = 7.27; df = 5, 167; p < 0.001), and a treatment × time interaction (F = 16.44; df = 15, 167; p < 0.001). The results of post hoc analysis (Bonferroni post-test) of the total percentages of time spent in SWS are presented in Figure 2A. Post hoc analysis indicated that, after microinjections of 0.5 nmol concentration of KN-93, the total percentage of time spent in SWS was significantly increased during the first (p < 0.001) and second (p < 0.001) hours of the postinjection period, compared with vehicle control microinjections. Similar comparisons revealed that, after microinjections of 1.0 nmol and 2.0 nmol concentrations of KN-93, the total percentage of SWS was significantly increased during the first (1.0 nmol: p < 0.001; 2.0 nmol: p < 0.001), second (1.0 nmol: p < 0.001; 2.0 nmol: p < 0.001), and third hours (1.0 nmol: p < 0.001; 2.0 nmol: p < 0.001) of the postinjection period (Fig. 2A). However, one-way ANOVAs revealed no significant changes in the SWS latencies or mean number of SWS episodes. The SWS latencies were reduced after microinjections of all three concentrations of KN-93, but these reductions were not statistically significant (Bonferroni post-tests) compared with the SWS latency after microinjection of vehicle control, with the exception of the highest dose, which exhibited only minimal significance (Fig. 2B). Similar post hoc tests (Bonferroni post-tests) also did not show any significant differences in the numbers of SWS episodes after microinjections of 0.5 nmol, 1.0 nmol, or 2.0 nmol concentrations of KN-93, compared with microinjections of vehicle control (Fig. 2C). However, one-way ANOVA indicated significant changes in the mean duration of SWS episodes (F = 9.86; df = 3, 24; p < 0.001) among the four different treatment groups. Subsequent post hoc tests (Bonferroni post-tests) revealed that the duration of SWS episodes was increased significantly after microinjections of 1.0 nmol (p < 0.01) and 2.0 nmol (p < 0.001) concentrations of KN-93, compared with vehicle control microinjections (Fig. 2D). These results suggest that the microinjections of KN-93 into the PPT increased the total percentage of time spent in SWS by increasing primarily the mean duration of SWS episodes.
Figure 2.
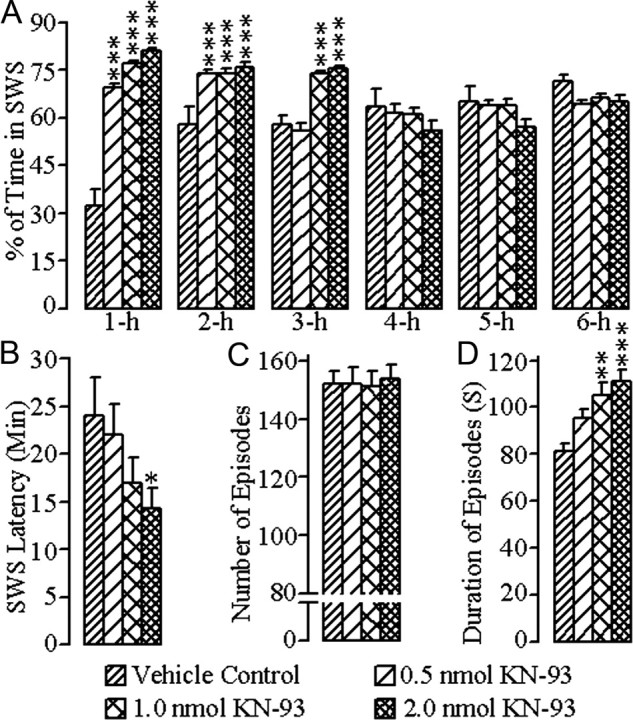
Effects of vehicle control (saline) and three different concentrations of KN-93 microinjected bilaterally into the PPT on SWS. These effects were observed during the 6 h wake–sleep recording periods that immediately followed microinjections. A, Bars represent percentages (mean ± SE) of time spent in SWS. B, Bars represent latency (mean ± SE) for the appearance of the first episode of SWS. C, Bars represent total number (mean ± SE) of SWS episodes. D, Bars represent duration (mean ± SE) of SWS episodes. Asterisks indicate the levels of statistical significance (post hoc tests, Bonferroni post-test) of the differences relative to vehicle control: *p < 0.05; **p < 0.01; ***p < 0.001.
Effects on REM sleep
The changes in REM sleep after bilateral microinjections of vehicle control and the different concentrations of KN-93 into the PPT are summarized in Figure 3. A two-way ANOVA on the total percentages of REM sleep indicated a significant main effect of treatment (F = 28.0; df = 3, 167; p < 0.001), time (F = 153.0; df = 5, 167; p < 0.001), and a treatment × time interaction (F = 6.97; df = 15, 167; p < 0.001). The results of post hoc analysis (Bonferroni post-test) of the total percentages of time spent in REM sleep are presented in Figure 3A. Post hoc analysis indicated that, after microinjections of 0.5 nmol concentration of KN-93, the total percentage of time spent in REM sleep was significantly increased during the second (p < 0.001) and third (p < 0.001) hours of the postinjection period, compared with vehicle control microinjections. Similar comparisons revealed that after microinjections of 1.0 nmol and 2.0 nmol concentrations of KN-93, the total percentage of REM sleep was also significantly increased during the second (1.0 nmol: p < 0.001; 2.0 nmol: p < 0.001) and third hours (1.0 nmol: p < 0.001; 2.0 nmol: p < 0.001) of the postinjection period (Fig. 2A). Effects of the different concentrations of KN-93 microinjections into the PPT were assessed by measuring the latency to onset of the first episode of REM sleep, total number of REM sleep episodes, and mean duration of REM sleep episodes. One-way ANOVA did not reveal any significant treatment effect on REM sleep latency. Similarly, post hoc comparisons (Bonferroni post-tests) did not reveal any significant changes in the REM sleep latency after microinjections of the three different concentrations of KN-93 compared with the REM sleep latency after microinjection of vehicle control (Fig. 3B). One-way ANOVA on the mean number of REM sleep episodes also did not reveal any significant treatment effect. Like REM sleep latency, post hoc analysis (Bonferroni post-test) did not reveal any significant differences in the mean number of REM sleep episodes after microinjections of the different concentrations of KN-93 compared with the mean number of REM sleep episodes after microinjections of vehicle control (Fig. 3C). However, one-way ANOVA indicated a significant treatment effect in the mean duration of REM sleep episodes (F = 6.90; df = 3, 24; p < 0.01) among the four different treatment groups of animals. Individual post hoc analyses (Bonferroni post-tests) indicated that the duration of REM sleep episodes was significantly increased after microinjections of 0.5 nmol (p < 0.05), 1.0 nmol (p < 0.01), and 2.0 nmol (p < 0.001) concentrations of KN-93, compared with vehicle control microinjections (Fig. 3D). These results suggest that the microinjections of KN-93 into the PPT increased the total percentage of time spent in REM sleep by increasing primarily the mean duration of REM sleep episodes.
Figure 3.
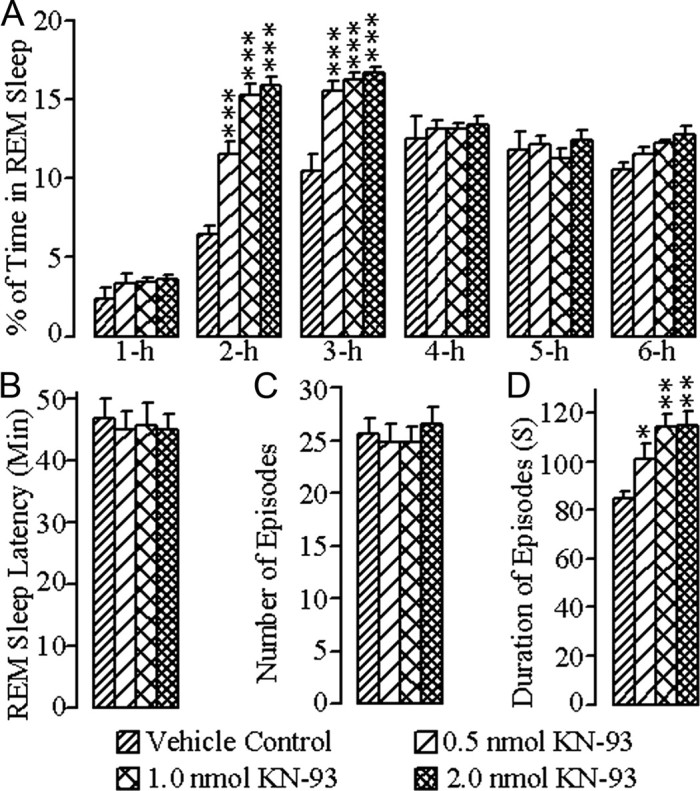
Effects of vehicle control (saline) and three different concentrations of KN-93 microinjected bilaterally into the PPT on REM sleep. These effects were observed during the 6 h wake–sleep recording periods that immediately followed microinjections. A, Bars represent percentages (mean ± SE) of time spent in REM sleep. B, Bars represent latency (mean ± SE) for the appearance of the first episode of REM sleep. C, Bars represent total number (mean ± SE) of REM sleep episodes. D, Bars represent duration (mean ± SE) of REM sleep episodes. Asterisks indicate the levels of statistical significance (post hoc tests, Bonferroni post-test) of the differences relative to vehicle control: *p < 0.05; **p < 0.01; ***p < 0.001.
Effects of KN-93 microinjections on pCaMKII expression in the PPT and its relationship with total percentage of time spent in W and total sleep
To examine whether the reduction of W after microinjections of KN-93 was caused by the reduction of CaMKII signaling activity within the PPT, rats were subjected to a second microinjection recording session, this time for 3 h (between 10:00 A.M. and 1:00 P.M.), as mentioned earlier. Immediately at the end of this 3 h recording session, the PPT tissue of each animal was collected and analyzed for the quantification of pCaMKII expression. Expression of pCaMKII in the PPT after bilateral microinjection of three different concentrations of KN-93 is summarized in Figure 4. One-way ANOVA on the levels of pCaMKII expression in the PPT revealed a significant effect of treatment (F = 189.2; df = 3, 24; p < 0.001). The results of post hoc analysis (Bonferroni's multiple-comparison test) on the levels of pCaMKII expression are presented in Figure 4A. The post hoc analyses revealed that the levels of pCaMKII expression were significantly reduced after microinjections of 0.5 nmol (13.44% reduction, p < 0.05), 1.0 nmol (65.31% reduction, p < 0.001), and 2.0 nmol (80.92% reduction, p < 0.001) concentrations of KN-93, compared with vehicle control microinjections. These results indicate that the microinjections of KN-93 caused a concentration-dependent reduction in pCaMKII expression in the PPT. During this second microinjection session, these animals' wake–sleep records were analyzed to determine whether there were concentration-specific changes in the total percentages of time spent in W and total sleep. One-way ANOVAs of these data indicated a significant treatment effect on both the total percentages of time spent in W (F = 113.0; df = 3, 24; p < 0.001) and total sleep (F = 113.9; df = 3, 24; p < 0.001). Individual post hoc analysis (Bonferroni's multiple-comparison test) revealed that the total percentage of W was significantly reduced after microinjections of 0.5 nmol (40.58% reduction; p < 0.001), 1.0 nmol (69.87% reduction; p < 0.001), and 2.0 nmol (76.55% reduction; p < 0.001) concentrations of KN-93, compared with vehicle control microinjections (Fig. 4B). On the contrary, similar post hoc analysis revealed that total sleep was significantly increased after 0.5 nmol (32.35% increase; p < 0.001), 1.0 nmol (55.55% increase; p < 0.001), and 2.0 nmol (60.84% increase; p < 0.001) concentrations of KN-93 microinjections (Fig. 4C).
Figure 4.

Effects of vehicle control (saline) and three different concentrations of KN-93 microinjected bilaterally into the PPT on the level of pCaMKII expression in the PPT and percentage of time spent in W and total sleep (TS). A, Representative Western blots of pCaMKII and α-tubulin and data from densitometric analysis of the PPT pCaMKII blots expressed as a percentage of vehicle control in the PPT. All analyses of pCaMKII expression are normalized against α-tubulin. Bars represent levels of PPT pCaMKII expression (mean ± SE). Note that PPT levels of pCaMKII expression decreased in a concentration-dependent manner. B, Bars represent percentages of time (mean ± SE) spent in W during the 3 h period after microinjections. C, Bars represent percentages of time spent in TS (mean ± SE) during the 3 h period after microinjections. Asterisks indicate the levels of statistical significance (post hoc tests, Bonferroni post-test) of the differences relative to vehicle control: *p < 0.05; ***p < 0.001.
Since the microinjections of KN-93 into the PPT decreased W and reduced pCaMKII expression in the PPT, we expected to see significant relationships (linear regression) between individual animals' levels of pCaMKII expression in the PPT and total percentage of time spent in W and/or total sleep. The results of this regression analysis revealed a significant positive relationship between levels of pCaMKII expression in the PPT and total percentage of time spent in W (R2 = 0.864, F = 165.2, p < 0.001; Fig. 5). As expected, there was a negative relationship between levels of pCaMKII expression in the PPT and percentage of time spent in total sleep (R2 = 0.863, F = 164.0, p < 0.001). Collectively, these results suggest that the KN-93 microinjection-induced reduction in W might have been caused by the reduction in pCaMKII expression in the PPT. These results also suggest that the reduction in pCaMKII expression allows for or even promotes sleep by suppressing W.
Figure 5.

The relationship between level of pCaMKII expression in the PPT and percentage of time spent in W after bilateral microinjections of vehicle control and three different concentrations of KN-93 into the PPT. Plot of linear regression best fit (solid line) showed a statistically significant positive slope (R2 = 0.864; p < 0.001) between pCaMKII expression and individual animals' total percentage of time spent in W. These data indicate that the percentage of time spent in W after microinjection into the PPT depends positively on the level of pCaMKII expression in the PPT.
Discussion
Understanding the role of a specific intracellular signal transduction pathway in a behaviorally active living organism creates vital, convergent evidence that bolsters the information gleaned from functional biochemistry and integrative physiology. In this study, we examined the role of PPT intracellular CaMKII signaling on the regulation of wake–sleep states. KN-93, a CaMKII activation inhibitor, was applied in the PPT, yielding the following principal findings: (1) total percentage of time spent in W was reduced, due to a decrease in the number and duration of W episodes; (2) total percentages of time spent in both SWS and REM sleep increased, due to increases in the duration of episodes; (3) the levels of pCaMKII expression in the PPT were reduced; (4) in individual animals, the level of pCaMKII expression in the PPT was positively related with total percentage of time spent in W; and (5) pCaMKII levels were negatively related with total percentage of time spent in sleep. These results, for the first time, provide direct evidence that the activation of intracellular CaMKII in the PPT may be an important intracellular signaling mechanism for the regulation of W.
Single-cell recordings and a combination of pharmacological and physiological studies have shown that the neurotransmitter receptor activation-mediated excitation and inhibition of PPT cells are important processes for the regulation of both REM sleep and W (El-Mansari et al., 1989; Steriade et al., 1990; Thakkar et al., 1998; Datta and Siwek, 2002; Datta and MacLean, 2007). Studies have shown that the activation of PPT kainate receptors induces REM sleep, whereas activation of PPT NMDA receptors is involved in the induction of W (Garcia-Rill, 1991; Garcia-Rill et al., 1990, 2001; Datta et al., 2001, 2002; Datta, 2002). Other studies have shown that the activity of the inhibitory neurotransmitter, GABA, (via GABA-B receptors in the PPT), suppresses both W and REM sleep (Datta et al., 2003; Ulloor et al., 2004; Datta, 2007). At a more detailed level, it is known that the induction of REM sleep by kainate receptor activation in the PPT involves activation of intracellular cAMP-PKA (Datta and Prutzman, 2005; Bandyopadhya et al., 2006; Datta and Desarnaud, 2010). Other signaling pathways have been implicated in other sleep–wake processes; for example, it has been suggested that the activation of extracellular signal-regulated kinase 1 and 2 (ERK1/2) signaling in the PPT is involved in the consolidation of sleep (Desarnaud et al., 2011). The present results further our existing knowledge by showing, for the first time, that intra-PPT application of the CaMKII signaling activation inhibitor, KN-93, decreases the amount of time spent in W, and that this decrease is caused by a reduction in both the number and duration of W episodes; these results indicate a deficit in both the induction and maintenance of W episodes. Given our results and the fact that several other studies have shown that the behavioral effects of KN-93 application in the brain are caused by the inhibition of CaMKII activation (Ogawa et al., 2005; Choi et al., 2006; Luo et al., 2008; Chen et al., 2009), there is a clear rationale to suggest that the activation of CaMKII signaling in the PPT is involved in both the initiation and maintenance of W episodes. Further corroborating the wakefulness-promoting role of CaMKII signaling within the PPT, another recent study has shown that the phosphorylation/activation of CaMKII in the PPT is greater during a period with high amounts of W and lesser during a period with high amounts of sleep (Stack et al., 2010). In the present study, we show that local application of KN-93 into the PPT not only decreased W but also decreased the levels of pCaMKII expression in the PPT. The positive relationship between the levels of pCaMKII expression in the PPT and amount of W was quite strong, explaining 86.4% of the variance in W (R2 = 0.864). As expected, there was a strong negative relationship between the levels of pCaMKII expression in the PPT and amount of total sleep. Together, these results substantiate our hypothesis that activation of CaMKII signaling in the PPT plays a major role in the expression of W.
CaMKII is one of the major protein kinases involved in Ca2+ signaling, and constitutes ∼1–2% of total brain protein mass (Colbran, 1992; Matthews et al., 1994; Soderling, 2000; Colbran, 2004). CaMKII is activated by binding with increased amounts of Ca2+ and calmodulin within the neuron, and can be autophosphorylated at threonine-286 and -287 (Malenka and Nicoll, 1999; Soderling and Derkach, 2000; Hudmon and Schulman, 2002; Lisman et al., 2002). In neurons, the activated CaMKII transduces Ca2+ signaling into gene transcription by activating the transcription factor CREB (Matthews et al., 1994; Corcoran and Means, 2001). A number of studies have suggested that the CaMKII signaling cascade in the brain plays a significant role in a number of important physiological and behavioral responses (Malenka and Nicoll, 1999; Kennedy, 2000; Soderling and Derkach, 2000; Josselyn and Nguyen, 2005; Mizuno et al., 2006), and that the activation of NMDA receptors plays a role in initiating these cascades. NMDA receptor activation leads to increased Ca2+ influx into the cytosol, and this influx then initiates the cascades of intracellular signaling events involving CaMKII (MacDermott et al., 1986; Womack et al., 1988; Lisman et al., 2002; Colbran, 2004). It is not surprising, therefore, that an earlier study showed that the activation of NMDA receptors in the PPT increases W (Datta et al., 2001). Based on the results of the present study and literature discussed above, we postulate the following two steps to explain the mechanism of PPT-mediated initiation of W. First, activation of NMDA receptors causes postsynaptic depolarization and increases Ca2+ influx into the PPT. Second, this greater level of cytosolic Ca2+ activates CaMKII signaling, which ultimately initiates the expression of W. These interactions between activated NMDA receptors and the CaMKII signaling system could explain part of the mechanism that initiates the state of W. Given that one of the major functions of activated CaMKII (pCaMKII) is to activate NMDA receptors (Kitamura et al., 1993; Malenka and Nicoll, 1999; Kennedy, 2000; Soderling and Derkach, 2000), and that continued activation of NMDA receptors is critical for the maintenance of W, it is likely that the increased CaMKII in the PPT is also involved in the maintenance of W.
The present study demonstrates that intra-PPT administration of KN-93 increased SWS and REM sleep. The increase in SWS was a product of a shorter latency and longer episode duration. The REM sleep increase was mainly caused by an increase in episode duration. Surprisingly, these are the typical effects of ERK1/2 signaling activation in the PPT (Desarnaud et al., 2011). This seemingly surprising coincidence can be reconciled by the fact that the inactivation of CaMKII signaling inactivates striatal enriched tyrosine phosphatase (STEP) by dephosphorylating NMDA receptors and reducing calcineurin (Paul et al., 2003). Under normal conditions, ERK1/2 activity remains suppressed by activated STEP (Paul et al., 2003; Venkitaramani et al., 2009). Thus, the inactivation of STEP—due to inactivation of CaMKII signaling—disinhibits ERK1/2 signaling. These interdependent relationships suggest that, in the present study, inactivation of the CaMKII signaling pathway might have increased ERK1/2 signaling in the PPT, which ultimately increased SWS and REM sleep.
Another possible mechanistic explanation that runs parallel to that described above, arises from a landmark study that examined the effect of modafinil on PPT neurons in the slice preparation (Garcia-Rill et al., 2007). Modafinil, currently the primary stimulant used to treat excessive sleepiness in a number of neuropsychiatric disorders, was found to increase electrical coupling and decrease input resistance in many different brain areas, including the PPT, presumably by increasing gap junctions in the cell bodies and terminals of GABAergic cells (Garcia-Rill et al., 2007; Urbano et al., 2007). Since it is known that GABA decreases the activity of cholinergic cells in the PPT and reduces W (Ulloor et al., 2004; Datta, 2007), it is likely that decreased input resistance, which reduces GABA release, would disinhibit PPT cholinergic cells' activity and promote W. Furthermore, inactivation of CaMKII was shown to block the modafinil-associated increases in gap junctions and electrical coupling, which suggests that these increases were CaMKII-dependent (Urbano et al., 2007). Therefore, it is reasonable to conclude that modafinil decreases sleepiness by promoting W, and this involves the PPT wake-promoting mechanism. Also, in the present study, inactivation of CaMKII might have decreased electrical coupling and increased the input resistance in GABAergic neurons by decreasing gap junctions in their terminals and cell bodies, which then increased GABA release in the PPT and ultimately decreased the activity of cholinergic cells in the PPT and reduced W.
In summary, despite the methodological limitations already acknowledged, the molecular, pharmacological, and behavioral data of this study, for the first time, demonstrate a novel W-promoting, sleep-suppressing role for CaMKII signaling within PPT neurons. These novel findings are critical for our complete understanding of the basic cellular and molecular mechanisms of wake–sleep cycle regulation.
Footnotes
This work was supported by National Institutes of Health Research Grants MH59839. The content is solely the responsibility of the authors and does not necessarily represent the official views of the National Institutes of Health. We thank Dr. G. Li for technical advice.
References
- Bandyopadhya RS, Datta S, Saha S. Activation of pedunculopontine tegmental protein kinase A: a mechanism for rapid eye movement sleep generation in the freely moving rat. J Neurosci. 2006;26:8931–8942. doi: 10.1523/JNEUROSCI.2173-06.2006. [DOI] [PMC free article] [PubMed] [Google Scholar]
- Capece ML, Lydic R. cAMP and protein kinase A modulate cholinergic rapid eye movement sleep generation. Am J Physiol. 1997;273:R1430–R1440. doi: 10.1152/ajpregu.1997.273.4.R1430. [DOI] [PubMed] [Google Scholar]
- Chen Y, Luo F, Yang C, Kirkmire CM, Wang ZJ. Acute inhibition of Ca2+/calmodulin-dependent protein kinase II reverses experimental neuropathic pain in mice. J Pharmacol Exp Ther. 2009;330:650–659. doi: 10.1124/jpet.109.152165. [DOI] [PMC free article] [PubMed] [Google Scholar]
- Choi SS, Seo YJ, Shim EJ, Kwon MS, Lee JY, Ham YO, Suh HW. Involvement of phosphorylated Ca2+/calmodulin-dependent protein kinase II and phosphorylated extracellular signal-regulated protein in the mouse formalin pain model. Brain Res. 2006;1108:28–38. doi: 10.1016/j.brainres.2006.06.048. [DOI] [PubMed] [Google Scholar]
- Clements JR, Grant S. Glutamate-like immunoreactivity in neurons of the laterodorsal tegmental and pedunculopontine nuclei in the rat. Neurosci Lett. 1990;120:70–73. doi: 10.1016/0304-3940(90)90170-e. [DOI] [PubMed] [Google Scholar]
- Colbran RJ. Regulation and role of brain calcium/calmodulin-dependent protein kinase II. Neurochem Int. 1992;21:469–497. doi: 10.1016/0197-0186(92)90080-b. [DOI] [PubMed] [Google Scholar]
- Colbran RJ. Targeting of calcium/calmodulin-dependent protein kinase II. Biochem J. 2004;378:1–16. doi: 10.1042/BJ20031547. [DOI] [PMC free article] [PubMed] [Google Scholar]
- Corcoran EE, Means AR. Defining Ca2+/calmodulin-dependent protein kinase cascades in transcriptional regulation. J Biol Chem. 2001;276:2975–2978. doi: 10.1074/jbc.R000027200. [DOI] [PubMed] [Google Scholar]
- Datta S. Avoidance task training potentiates phasic pontine-wave density in the rat: A mechanism for sleep-dependent plasticity. J Neurosci. 2000;20:8607–8613. doi: 10.1523/JNEUROSCI.20-22-08607.2000. [DOI] [PMC free article] [PubMed] [Google Scholar]
- Datta S. Evidence that REM sleep is controlled by the activation of brain stem pedunculopontine tegmental kainate receptor. J Neurophysiol. 2002;87:1790–1798. doi: 10.1152/jn.00763.2001. [DOI] [PubMed] [Google Scholar]
- Datta S. Activation of pedunculopontine tegmental PKA prevents GABAB receptor activation-mediated rapid eye movement sleep suppression in the freely moving rat. J Neurophysiol. 2007;97:3841–3850. doi: 10.1152/jn.00263.2007. [DOI] [PubMed] [Google Scholar]
- Datta S. Cellular and chemical neuroscience of mammalian sleep. Sleep Med. 2010;11:431–440. doi: 10.1016/j.sleep.2010.02.002. [DOI] [PMC free article] [PubMed] [Google Scholar]
- Datta S, Desarnaud F. Protein kinase A in the pedunculopontine tegmental nucleus of rat contributes to regulation of rapid eye movement sleep. J Neurosci. 2010;30:12263–12273. doi: 10.1523/JNEUROSCI.1563-10.2010. [DOI] [PMC free article] [PubMed] [Google Scholar]
- Datta S, Maclean RR. Neurobiological mechanisms for the regulation of mammalian sleep-wake behavior: reinterpretation of historical evidence and inclusion of contemporary cellular and molecular evidence. Neurosci Biobehav Rev. 2007;31:775–824. doi: 10.1016/j.neubiorev.2007.02.004. [DOI] [PMC free article] [PubMed] [Google Scholar]
- Datta S, Prutzman SL. Novel role of brain stem pedunculopontine tegmental adenylyl cyclase in the regulation of spontaneous REM sleep in the freely moving rat. J Neurophysiol. 2005;94:1928–1937. doi: 10.1152/jn.00272.2005. [DOI] [PMC free article] [PubMed] [Google Scholar]
- Datta S, Siwek DF. Excitation of the brain stem pedunculopontine tegmentum cholinergic cells induces wakefulness and REM sleep. J Neurophysiol. 1997;77:2975–2988. doi: 10.1152/jn.1997.77.6.2975. [DOI] [PubMed] [Google Scholar]
- Datta S, Siwek DF. Single cell activity patterns of pedunculopontine tegmentum neurons across the sleep-wake cycle in the freely moving rats. J Neurosci Res. 2002;70:611–621. doi: 10.1002/jnr.10405. [DOI] [PubMed] [Google Scholar]
- Datta S, Patterson EH, Spoley EE. Excitation of the pedunculopontine tegmental NMDA receptors induces wakefulness and cortical activation in the rat. J Neurosci Res. 2001;66:109–116. doi: 10.1002/jnr.1202. [DOI] [PubMed] [Google Scholar]
- Datta S, Spoley EE, Mavanji VK, Patterson EH. A novel role of pedunculopontine tegmental kainate receptors: a mechanism of rapid eye movement sleep generation in the rat. Neuroscience. 2002;114:157–164. doi: 10.1016/s0306-4522(02)00250-6. [DOI] [PubMed] [Google Scholar]
- Datta S, Mavanji V, Patterson EH, Ulloor J. Regulation of rapid eye movement sleep in the freely moving rat: local microinjection of serotonin, norepinephrine, and adenosine into the brainstem. Sleep. 2003;26:513–520. doi: 10.1093/sleep/26.5.513. [DOI] [PubMed] [Google Scholar]
- Datta S, Mavanji V, Ulloor J, Patterson EH. Activation of phasic pontine-wave generator prevents rapid eye movement sleep deprivation-induced learning impairment in the rat: a mechanism for sleep-dependent plasticity. J Neurosci. 2004;24:1416–1427. doi: 10.1523/JNEUROSCI.4111-03.2004. [DOI] [PMC free article] [PubMed] [Google Scholar]
- Datta S, Li G, Auerbach S. Activation of phasic pontine-wave generator in the rat: a mechanism for expression of plasticity-related genes and proteins in the dorsal hippocampus and amygdala. Eur J Neurosci. 2008;27:1876–1892. doi: 10.1111/j.1460-9568.2008.06166.x. [DOI] [PMC free article] [PubMed] [Google Scholar]
- Datta S, Siwek DF, Stack EC. Identification of cholinergic and noncholinergic neurons in the pons expressing phosphorylated cyclic adenosine monophosphate response element-binding protein as a function of rapid eye movement sleep. Neuroscience. 2009;163:397–414. doi: 10.1016/j.neuroscience.2009.06.035. [DOI] [PMC free article] [PubMed] [Google Scholar]
- Desarnaud F, Macone BW, Datta S. Activation of extracellular signal-regulated kinase signaling in the pedunculopontine tegmental cells is involved in the maintenance of sleep in rats. J Neurochem. 2011;116:577–587. doi: 10.1111/j.1471-4159.2010.07146.x. [DOI] [PMC free article] [PubMed] [Google Scholar]
- El-Mansari M, Sakai K, Jouvet M. Unitary characteristics of presumptive cholinergic tegmental neurons during the sleep-waking cycle in freely moving cats. Exp Brain Res. 1989;76:519–529. doi: 10.1007/BF00248908. [DOI] [PubMed] [Google Scholar]
- Fleegal MA, Sumners C. Drinking behavior elicited by central injection of angiotensin II: roles for protein kinase C and Ca2+/calmodulin-dependent protein kinase II. Am J Physiol Regul Integr Comp Physiol. 2003;285:R632–R640. doi: 10.1152/ajpregu.00151.2003. [DOI] [PubMed] [Google Scholar]
- Ford B, Holmes CJ, Mainville L, Jones BE. GABAergic neurons in the rat pontomesencephalic tegmentum: codistribution with cholinergic and other tegmental neurons projecting to the posterior lateral hypothalamus. J Comp Neurol. 1995;363:177–196. doi: 10.1002/cne.903630203. [DOI] [PubMed] [Google Scholar]
- Garcia-Rill E. The pedunculopontine nucleus. Prog Neurobiol. 1991;36:363–389. doi: 10.1016/0301-0082(91)90016-t. [DOI] [PubMed] [Google Scholar]
- Garcia-Rill E, Kinjo N, Atsuta Y, Ishikawa Y, Webber M, Skinner RD. Posterior midbrain-induced locomotion. Brain Res Bull. 1990;24:499–508. doi: 10.1016/0361-9230(90)90103-7. [DOI] [PubMed] [Google Scholar]
- Garcia-Rill E, Skinner RD, Miyazato H, Homma Y. Pedunculopontine stimulation induces prolonged activation of pontine reticular neurons. Neuroscience. 2001;104:455–465. doi: 10.1016/s0306-4522(01)00094-x. [DOI] [PubMed] [Google Scholar]
- Garcia-Rill E, Heister DS, Ye M, Charlesworth A, Hayar A. Electrical coupling: novel mechanism for sleep-wake control. Sleep. 2007;30:1405–1414. doi: 10.1093/sleep/30.11.1405. [DOI] [PMC free article] [PubMed] [Google Scholar]
- Garcia-Rill E, Charlesworth A, Heister D, Ye M, Hayar A. The developmental decrease in REM sleep: the role of transmitters and electrical coupling. Sleep. 2008;31:673–690. doi: 10.1093/sleep/31.5.673. [DOI] [PMC free article] [PubMed] [Google Scholar]
- Herz A, Teschemacher H. Activities and sites of antinociceptive action of morphine-like analgesics and kinetics of distribution following intravenous, intracerebral and intraventricular application. Adv Drug Delivery. 1971;6:79–119. [Google Scholar]
- Hudmon A, Schulman H. Neuronal CA2+/calmodulin-dependent protein kinase II: the role of structure and autoregulation in cellular function. Annu Rev Biochem. 2002;71:473–510. doi: 10.1146/annurev.biochem.71.110601.135410. [DOI] [PubMed] [Google Scholar]
- Jones BE. Paradoxical REM sleep promoting and permitting neuronal networks. Arch Ital Biol. 2004;142:379–396. [PubMed] [Google Scholar]
- Jones BE, Beaudet A. Distribution of acetylcholine and catecholamine neurons in the cat brainstem: a choline acetyltransferase and tyrosine hydroxylase immunohistochemical study. J Comp Neurol. 1987;261:15–32. doi: 10.1002/cne.902610103. [DOI] [PubMed] [Google Scholar]
- Josselyn SA, Nguyen PV. CREB, synapses and memory disorders: past progress and future challenges. Curr Drug Targets CNS Neurol Disord. 2005;4:481–497. doi: 10.2174/156800705774322058. [DOI] [PubMed] [Google Scholar]
- Kennedy MB. Signal-processing machines at the postsynaptic density. Science. 2000;290:750–754. doi: 10.1126/science.290.5492.750. [DOI] [PubMed] [Google Scholar]
- Kitamura Y, Miyazaki A, Yamanaka Y, Nomura Y. Stimulatory effects of protein kinase C and calmodulin kinase II on N-methyl-d-aspartate receptor/channels in the postsynaptic density of rat brain. J Neurochem. 1993;61:100–109. doi: 10.1111/j.1471-4159.1993.tb03542.x. [DOI] [PubMed] [Google Scholar]
- Kosaka T, Tauchi M, Dahl JL. Cholinergic neurons containing GABA-like and/or glutamic acid decarboxylase-like immunoreactivities in various brain regions of the rat. Exp Brain Res. 1988;70:605–617. doi: 10.1007/BF00247609. [DOI] [PubMed] [Google Scholar]
- Leonard AS, Lim IA, Hemsworth DE, Horne MC, Hell JW. Calcium/calmodulin-dependent protein kinase II is associated with the N-methyl-d-aspartate receptor. Proc Natl Acad Sci U S A. 1999;96:3239–3244. doi: 10.1073/pnas.96.6.3239. [DOI] [PMC free article] [PubMed] [Google Scholar]
- Licata SC, Schmidt HD, Pierce RC. Suppressing calcium/calmodulin-dependent protein kinase II activity in the ventral tegmental area enhances the acute behavioural response to cocaine but attenuates the initiation of cocaine-induced behavioural sensitization in rats. Eur J Neurosci. 2004;19:405–414. doi: 10.1111/j.0953-816x.2003.03110.x. [DOI] [PubMed] [Google Scholar]
- Lim AS, Lozano AM, Moro E, Hamani C, Hutchison WD, Dostrovsky JO, Lang AE, Wennberg RA, Murray BJ. Characterization of REM-sleep associated ponto-geniculo-occipital waves in the human pons. Sleep. 2007;30:823–827. doi: 10.1093/sleep/30.7.823. [DOI] [PMC free article] [PubMed] [Google Scholar]
- Lisman J, Schulman H, Cline H. The molecular basis of CaMKII function in synaptic and behavioural memory. Nat Rev Neurosci. 2002;3:175–190. doi: 10.1038/nrn753. [DOI] [PubMed] [Google Scholar]
- Liu RH, Fung SJ, Reddy VK, Barnes CD. Localization of glutamatergic neurons in the dorsolateral pontine tegmentum projecting to the spinal cord of the cat with a proposed role of glutamate on lumbar motoneuron activity. Neuroscience. 1995;64:193–208. doi: 10.1016/0306-4522(94)00354-8. [DOI] [PubMed] [Google Scholar]
- Loweth JA, Baker LK, Guptaa T, Guillory AM, Vezina P. Inhibition of CaMKII in the nucleus accumbens shell decreases enhanced amphetamine intake in sensitized rats. Neurosci Lett. 2008;444:157–160. doi: 10.1016/j.neulet.2008.08.004. [DOI] [PMC free article] [PubMed] [Google Scholar]
- Luo F, Yang C, Chen Y, Shukla P, Tang L, Wang LX, Wang ZJ. Reversal of chronic inflammatory pain by acute inhibition of Ca2+/calmodulin-dependent protein kinase II. J Pharmacol Exp Ther. 2008;325:267–275. doi: 10.1124/jpet.107.132167. [DOI] [PubMed] [Google Scholar]
- Lydic R, Baghdoyan HA. Acetylcholine modulates sleep and wakefulness: a synaptic perspective. In: Monti JM, Pandi-Perumal SR, Sinton CM, editors. Neurochemistry of sleep and wakefulness. Cambridge, UK: Cambridge UP; 2008. pp. 109–143. [Google Scholar]
- MacDermott AB, Mayer ML, Westbrook GL, Smith SJ, Barker JL. NMDA-receptor activation increases cytoplasmic calcium concentration in cultured spinal cord neurones. Nature. 1986;321:519–522. doi: 10.1038/321519a0. [DOI] [PubMed] [Google Scholar]
- Malenka RC, Nicoll RA. Long-term potentiation—a decade of progress? Science. 1999;285:1870–1874. doi: 10.1126/science.285.5435.1870. [DOI] [PubMed] [Google Scholar]
- Martin JH. Autoradiographic estimation of the extent of reversible inactivation produced by microinjection of lidocaine and muscimol in the rat. Neurosci Lett. 1991;127:160–164. doi: 10.1016/0304-3940(91)90784-q. [DOI] [PubMed] [Google Scholar]
- Matthews RP, Guthrie CR, Wailes LM, Zhao X, Means AR, McKnight GS. Calcium/calmodulin-dependent protein kinase types II and IV differentially regulate CREB-dependent gene expression. Mol Cell Biol. 1994;14:6107–6116. doi: 10.1128/mcb.14.9.6107. [DOI] [PMC free article] [PubMed] [Google Scholar]
- Mavanji V, Ulloor J, Saha S, Datta S. Neurotoxic lesions of phasic pontine-wave generator cells impair retention of 2-way active avoidance memory. Sleep. 2004;27:1282–1292. doi: 10.1093/sleep/27.7.1282. [DOI] [PubMed] [Google Scholar]
- Mesulam MM, Mufson EJ, Levey AI, Wainer BH. Cholinergic innervation of cortex by the basal forebrain: cytochemistry and cortical connections of the septal area, diagonal band nuclei, nucleus basalis (substantia innominata), and hypothalamus in the rhesus monkey. J Comp Neurol. 1983;214:170–197. doi: 10.1002/cne.902140206. [DOI] [PubMed] [Google Scholar]
- Mizuno K, Ris L, Sánchez-Capelo A, Godaux E, Giese KP. Ca2+/calmodulin kinase kinase alpha is dispensable for brain development but is required for distinct memories in male, though not in female, mice. Mol Cell Biol. 2006;26:9094–9104. doi: 10.1128/MCB.01221-06. [DOI] [PMC free article] [PubMed] [Google Scholar]
- Myskiw JC, Fiorenza NG, Izquierdo LA, Izquierdo I. Molecular mechanisms in hippocampus and basolateral amygdala but not in parietal or cingulate cortex are involved in extinction of one-trial avoidance learning. Neurobiol Learn Mem. 2010;94:285–291. doi: 10.1016/j.nlm.2010.06.007. [DOI] [PubMed] [Google Scholar]
- Nicholson C. Diffusion from an injected volume of a substance in brain tissue with arbitrary volume fraction and tortuosity. Brain Res. 1985;333:325–329. doi: 10.1016/0006-8993(85)91586-0. [DOI] [PubMed] [Google Scholar]
- Ogawa A, Dai Y, Yamanaka H, Iwata K, Niwa H, Noguchi K. Ca(2+)/calmodulin-protein kinase IIalpha in the trigeminal subnucleus caudalis contributes to neuropathic pain following inferior alveolar nerve transection. Exp Neurol. 2005;192:310–319. doi: 10.1016/j.expneurol.2004.11.010. [DOI] [PubMed] [Google Scholar]
- Ota KT, Monsey MS, Wu MS, Schafe GE. Synaptic plasticity and NO-cGMP-PKG signaling regulate presynaptic and postsynaptic alterations at rat lateral amygdala synapses following fear conditioning. PLoS One. 2010;5:e11236. doi: 10.1371/journal.pone.0011236. [DOI] [PMC free article] [PubMed] [Google Scholar]
- Pace-Schott EF, Hobson JA. The neurobiology of sleep: genetics, cellular physiology and subcortical networks. Nat Rev Neurosci. 2002;3:591–605. doi: 10.1038/nrn895. [DOI] [PubMed] [Google Scholar]
- Paul S, Nairn AC, Wang P, Lombroso PJ. NMDA-mediated activation of the tyrosine phosphatase STEP regulates the duration of ERK signaling. Nat Neurosci. 2003;6:34–42. doi: 10.1038/nn989. [DOI] [PubMed] [Google Scholar]
- Paxinos G, Watson C. The rat brain in stereotaxic coordinates. San Diego: Academic; 1997. [DOI] [PubMed] [Google Scholar]
- Pierce RC, Quick EA, Reeder DC, Morgan ZR, Kalivas PW. Calcium-mediated second messengers modulate the expression of behavioral sensitization to cocaine. J Pharmacol Exp Ther. 1998;286:1171–1176. [PubMed] [Google Scholar]
- Rye DB, Saper CB, Lee HJ, Wainer BH. Pedunculopontine tegmental nucleus of the rat: cytoarchitecture, cytochemistry, and some extrapyramidal connections of the mesopontine tegmentum. J Comp Neurol. 1987;259:483–528. doi: 10.1002/cne.902590403. [DOI] [PubMed] [Google Scholar]
- Sakurai S, Yu L, Tan SE. Roles of hippocampal N-methyl-d-aspartate receptors and calcium/calmodulin-dependent protein kinase II in amphetamine-produced conditioned place preference in rats. Behav Pharmacol. 2007;18:497–506. doi: 10.1097/FBP.0b013e3282ee7b62. [DOI] [PubMed] [Google Scholar]
- Seo YJ, Kwon MS, Choi HW, Choi SM, Kim YW, Lee JK, Park SH, Jung JS, Suh HW. Differential expression of phosphorylated Ca2+/calmodulin-dependent protein kinase II and phosphorylated extracellular signal-regulated protein in the mouse hippocampus induced by various nociceptive stimuli. Neuroscience. 2008;156:436–449. doi: 10.1016/j.neuroscience.2008.08.002. [DOI] [PubMed] [Google Scholar]
- Shioda N, Beppu H, Fukuda T, Li E, Kitajima I, Fukunaga K. Aberrant calcium/calmodulin-dependent protein kinase II (CaMKII) activity is associated with abnormal dendritic spine morphology in the ATRX mutant mouse brain. J Neurosci. 2011;31:346–358. doi: 10.1523/JNEUROSCI.4816-10.2011. [DOI] [PMC free article] [PubMed] [Google Scholar]
- Soderling TR. CaM-kinases: modulators of synaptic plasticity. Curr Opin Neurobiol. 2000;10:375–380. doi: 10.1016/s0959-4388(00)00090-8. [DOI] [PubMed] [Google Scholar]
- Soderling TR, Derkach VA. Postsynaptic protein phosphorylation and LTP. Trends Neurosci. 2000;23:75–80. doi: 10.1016/s0166-2236(99)01490-3. [DOI] [PubMed] [Google Scholar]
- Stack EC, Desarnaud F, Siwek DF, Datta S. A novel role for calcium/calmodulin kinase II within the brainstem pedunculopontine tegmentum for the regulation of wakefulness and rapid eye movement sleep. J Neurochem. 2010;112:271–281. doi: 10.1111/j.1471-4159.2009.06452.x. [DOI] [PMC free article] [PubMed] [Google Scholar]
- Steriade M, Datta S, Paré D, Oakson G, Curró Dossi RC. Neuronal activities in brain-stem cholinergic nuclei related to tonic activation processes in thalamocortical systems. J Neurosci. 1990;10:2541–2559. doi: 10.1523/JNEUROSCI.10-08-02541.1990. [DOI] [PMC free article] [PubMed] [Google Scholar]
- Strack S, Colbran RJ. Autophosphorylation-dependent targeting of calcium/ calmodulin-dependent protein kinase II by the NR2B subunit of the N-methyl-d-aspartate receptor. J Biol Chem. 1998;273:20689–20692. doi: 10.1074/jbc.273.33.20689. [DOI] [PubMed] [Google Scholar]
- Thakkar MM, Strecker RE, McCarley RW. Behavioral state control through differential serotonergic inhibition in the mesopontine cholinergic nuclei: a simultaneous unit recording and microdialysis study. J Neurosci. 1998;18:5490–5497. doi: 10.1523/JNEUROSCI.18-14-05490.1998. [DOI] [PMC free article] [PubMed] [Google Scholar]
- Tokumitsu H, Chijiwa T, Hagiwara M, Mizutani A, Terasawa M, Hidaka H. KN-62, 1-[N,O-bis(5-isoquinolinesulfonyl)-N-methyl-l-tyrosyl]-4-phenylpiperazi ne, a specific inhibitor of Ca2+/calmodulin-dependent protein kinase II. J Biol Chem. 1990;265:4315–4320. [PubMed] [Google Scholar]
- Ulloor J, Datta S. Spatio-temporal activation of cAMP response element-binding protein, activity-regulated cytoskeletal-associated protein and brain-derived nerve growth factor: a mechanism for pontine-wave generator activation-dependent two-way active-avoidance memory processing in the rat. J Neurochem. 2005;95:418–428. doi: 10.1111/j.1471-4159.2005.03378.x. [DOI] [PubMed] [Google Scholar]
- Ulloor J, Mavanji V, Saha S, Siwek DF, Datta S. Spontaneous REM sleep is modulated by the activation of the pedunculopontine tegmental GABAB receptors in the freely moving rat. J Neurophysiol. 2004;91:1822–1831. doi: 10.1152/jn.01104.2003. [DOI] [PubMed] [Google Scholar]
- Urbano FJ, Leznik E, Llinás RR. Modafinil enhances thalamocortical activity by increasing neuronal electrotonic coupling. Proc Natl Acad Sci U S A. 2007;104:12554–12559. doi: 10.1073/pnas.0705087104. [DOI] [PMC free article] [PubMed] [Google Scholar]
- Venkitaramani DV, Paul S, Zhang Y, Kurup P, Ding L, Tressler L, Allen M, Sacca R, Picciotto MR, Lombroso PJ. Knockout of striatal enriched protein tyrosine phosphatase in mice results in increased ERK1/2 phosphorylation. Synapse. 2009;63:69–81. doi: 10.1002/syn.20608. [DOI] [PMC free article] [PubMed] [Google Scholar]
- Vincent SR, Reiner PB. The immunohistochemical localization of choline acetyltransferase in the cat brain. Brain Res Bull. 1987;18:371–415. doi: 10.1016/0361-9230(87)90015-3. [DOI] [PubMed] [Google Scholar]
- Wang HL, Morales M. Pedunculopontine and laterodorsal tegmental nuclei contain distinct populations of cholinergic, glutamatergic and GABAergic neurons in the rat. Eur J Neurosci. 2009;29:340–358. doi: 10.1111/j.1460-9568.2008.06576.x. [DOI] [PMC free article] [PubMed] [Google Scholar]
- Womack MD, MacDermott AB, Jessell TM. Sensory transmitters regulate intracellular calcium in dorsal horn neurons. Nature. 1988;334:351–353. doi: 10.1038/334351a0. [DOI] [PubMed] [Google Scholar]
- Yaksh TL, Rudy TA. Narcotic analgestics: CNS sites and mechanisms of action as revealed by intracerebral injection techniques. Pain. 1978;4:299–359. doi: 10.1016/0304-3959(77)90145-2. [DOI] [PubMed] [Google Scholar]