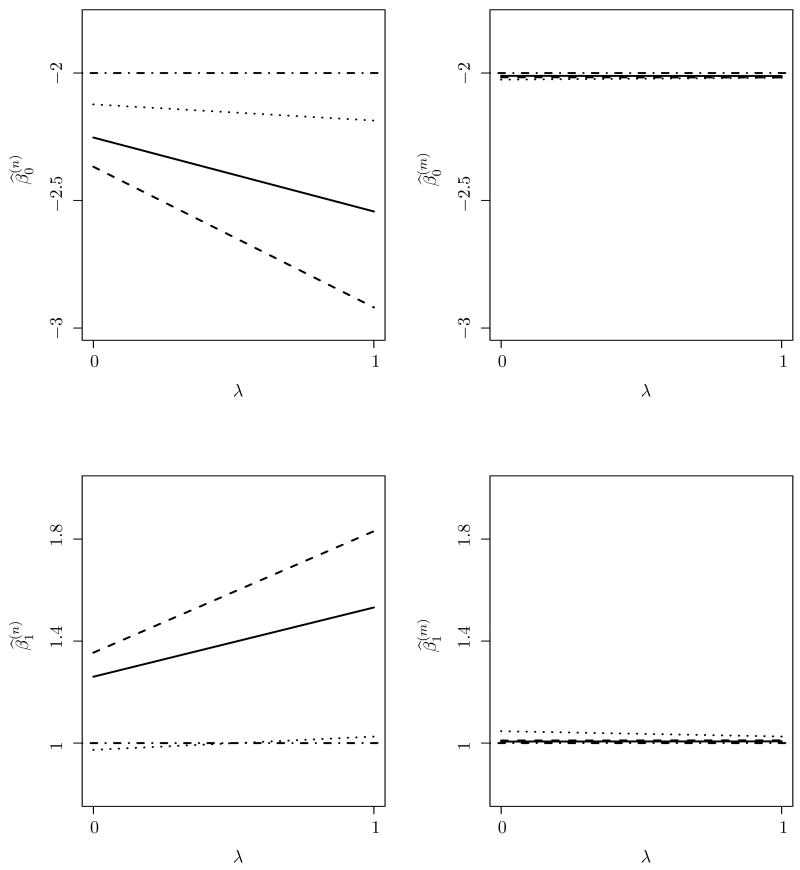
Figure 2.
simex plots averaged over 300 Monte-Carlo replications. The horizontal dot-dashed line is a reference line placed at the true parameter values. The left (right) panel depicts the estimates under a normal (mixture normal) assumption for X. The solid line, dashed line, and dotted line correspond to θ̂I, θ̂R, and θ̂H, respectively.

