

Abstract
There are three quantitative phosphoproteomic strategies most commonly used to study receptor tyrosine kinase (RTK) signaling. These strategies quantify changes in: (1) all three forms of phosphosites (phosphoserine, phosphothreonine and phosphotyrosine) following enrichment of phosphopeptides by titanium dioxide or immobilized metal affinity chromatography; (2) phosphotyrosine sites following anti- phosphotyrosine antibody enrichment of phosphotyrosine peptides; or (3) phosphotyrosine proteins and their binding partners following anti-phosphotyrosine protein immunoprecipitation. However, it is not clear from literature which strategy is more effective. In this study, we assessed the utility of these three phosphoproteomic strategies in RTK signaling studies by using EphB receptor signaling as an example. We used all three strategies with stable isotope labeling with amino acids in cell culture (SILAC) to compare changes in phosphoproteomes upon EphB receptor activation. We used bioinformatic analysis to compare results from the three analyses. Our results show that the three strategies provide complementary information about RTK pathways.
Keywords: phosphoproteomic, RTK, titanium dioxide, EphB, quantitation, phosphorylation, phosphopeptide, SILAC, mass spectrometry, proteomics
Short abstract
Quantitative phosphoproteomic strategies are most commonly used to study receptor tyrosine kinase (RTK) signaling by quantifying changes in: (1) phosphopeptides containing pS, pT, or pY; (2) phosphotyrosine-containing peptides; (3) phosphotyrosine-containing proteins. In this study, we assessed the utility of the three strategies for RTK signaling studies by using EphB receptor signaling as an example. Our results show that the three strategies are very complementary in providing information about RTK pathways.
Introduction
Receptor tyrosine kinases (RTKs) are cell surface receptors endowed with intrinsic protein tyrosine kinase activity. RTKs play pivotal roles in the regulation of many fundamental cellular processes including cell cycle, metabolism, survival, cell proliferation and differentiation.1−3 Unregulated RTK activities often result in the genesis of many malignancies. In a typical RTK pathway, upon binding of the ligand, the receptor becomes activated by tyrosine autophosphorylation, which leads to recruitment and activation of a variety of downstream target proteins and subsequent initiation of signaling cascades.1−3
In recent years, large scale quantitative phosphoproteomics based on mass spectrometry (MS) has emerged as a powerful tool to study intracellular signal transduction through unbiased comparison of protein phosphorylation in different cellular conditions.4−6 In particular, for RTK pathways, quantitative phosphoproteomic approaches can provide very informative data because of the central roles of reversible phosphorylation in RTK mediated signal transduction.5,7
Currently there are three global phosphoproteomic approaches that are most commonly used: (1) global phosphopeptide analysis (phosphoserine/phosphothreonine/phosphotyrosine, or pSTY peptide analysis),8−11 (2) phosphotyrosine (pY) peptide analysis9,12−17 and (3) pY protein analysis.18−26 In a pSTY peptide analysis, all three forms of phosphorylation (pS, pT and pY) between different experimental conditions are compared. Phosphorylated peptides are isolated from protein digests, usually by immobilized metal affinity chromatography (IMAC)(27) or titanium dioxide (TiO2),(28) prior to MS analysis. Typically in these experiments very few pY peptides are identified due to the relatively low frequency of tyrosine phosphorylation. In a pY peptide analysis, only pY peptides are analyzed. Anti-pY antibodies are used to isolate pY peptides from protein digests.(29) In a pY protein analysis, quantitation is reported at the protein level rather than peptide/phosphosite level, even though it is measured at the peptide level. pY proteins and associated proteins are isolated by anti-pY protein immunoprecipitation (IP) and the IPed proteins are then identified and quantified by MS to determine their relative abundance in the IP.(18)
Of the three strategies, the pSTY peptide analysis strategy, in principle, can provide the most informative data because it allows comparison of all three forms of phosphosites. Recent advances in phosphopeptide enrichment and MS detection techniques have made it possible to identify thousands, or even tens of thousands, of phosphosites.28,30 Thus it appears that this should be the method of choice to study RTK signaling. However, a major concern of this strategy is that identification of pY sites is more difficult than pS and pT sites because of relative low abundance of pY peptides. The pY peptide analysis strategy is designed to focus on only pY sites, and therefore provides better coverage of pY sites than the pSTY strategy. Unlike the other two strategies, the pY protein strategy does not provide quantitative information about specific phosphosites. However, the pY protein analysis strategy is proven to be efficient in detecting protein effectors in RTK pathways.18−26 In principle it allows identification of interacting proteins that co-IP with pY proteins, which is an advantage over the other two approaches.
While all three strategies have been successfully used to study various RTK pathways, to our knowledge there has been no study so far in the literature that compares them in terms of their abilities to elucidate the molecular basis of RTK signaling. Thus it remains unclear whether one strategy generates significantly more informative data than another. In previous reported global phosphoproteomic studies on RTK signaling, usually only a single one of the three strategies was used in each study. The choice of method was often determined by researcher’s familiarity with specific techniques rather than inherent merits and limitations of the different strategies.
In this study, we attempt to assess the utility of the three strategies in RTK signaling studies by using EphB receptor signaling as an example. The Eph receptors form the largest group of RTKs. They are involved in many important biological processes including axon guidance, cell migration, tissue patterning, angiogenesis and cancer.(31) EphB receptors are typical RTKs. They are transmembrane receptors with extracellular ligand binding domains and intracellular tyrosine kinase domains. In a previous study, we used the pY protein analysis strategy to screen for effector proteins that are regulated by EphB receptors upon ligand binding.(32) In the current study, we performed pSTY and pY peptide analyses using the same cell line and treatment conditions. The results obtained from the three analyses were then compared to evaluate the strengths and limitations of the different strategies for studying RTK signaling.
Materials and Methods
SILAC Cell Culture and Ephrin Stimulation
Metabolic labeling and stimulation of cells were performed as previously described with minor modifications.(32) Briefly, NG108 cells (mouse neuroblastoma and rat glioma hybrid) stably overexpressing the EphB2 receptor were differentially labeled in medium containing either normal or heavy labeling amino acids. For the pSTY peptide and pY protein analyses, 13 C6 arginine and 13 C6 lysine (Cambridge Isotope Laboratories, Andover, MA) were used as the heavy amino acids. For the pY peptide analysis, 13 C915N1 tyrosine (Cambridge Isotope Laboratories, Andover, MA) was used. After complete labeling, the cells were serum starved for 24 h. One cell population was treated for 45 min with 2 μg/mL ephrinB1-Fc (Sigma-Aldrich) aggregated with anti-Fc IgG (Jackson Immunoresearch) while the other population was treated with anti-Fc IgG aggregated Fc as a control. For each cell condition, about 100 million cells were used for the pY peptide and pY protein analyses and about 20 million for the pSTY peptide analysis to enable reasonable comparisons due to the much lower abundance of pY sites. Cells were lysed in lysis buffer containing 1% Triton X-100, 150 mM NaCl, 20 mM Tris, pH 8, 0.2 mM ethylene diamine tetraacetic acid (EDTA), 2 mM Na3VO4, 2 mM NaF, and protease inhibitors (Complete tablet; Roche, Mannheim, Germany). The “light” and “heavy” lysates were mixed in a 1:1 ratio (v:v) before subsequent handling.
Tryptic Digestion
For the pSTY peptide analysis, the lysate was precipitated overnight at −20 °C by addition of four volumes of ice-cold acetone. Following centrifugation, precipitated proteins were redissolved in 5% SDS and separated by SDS–polyacrylamide gel electrophoresis (SDS-PAGE). The gel was cut into 19 slices for in-gel digestion with trypsin as described previously.(32) Briefly, the proteins in gel were reduced with DTT, alkylated with iodoacetylamide and incubated with 12.5 ng/μL trypsin (Promega Corporation, Madison, WI) in 25 mM ammonia bicarbonate overnight. The resulting peptides were extracted twice with 5% formic acid/50% acetonitrile and once with pure acetonitrile before the extract was dried in a SpeedVac.
For the pY peptide analysis, it was not necessary to fractionate the proteins before digestion because of the relatively small number of pY peptides in the sample (<1000). Therefore, the “tube-gel” approach was used to isolate proteins from the whole cell lysate by first immobilizing the protein in polyacrylamide gels during polymerization and then washing the gels extensively.(33) A 7.5% polyacrylamide gel was casted with the lysate: the lystate was mixed with 30% acrylamide/N,N′-methylene-bis-acrylamide, tetramethylethylenediamine (TEMED) and 10% ammonium persulfate and allowed to polymerize at room temperature for 4 h. The gel was then washed extensively with 40% ethanol/7% acetic acid prior to in-gel digestion using the procedure described above.
Enrichment of Phosphopeptides using TiO2
Peptides were reconstituted in 5% trifluoroacetic acid (TFA)/60% acetonitrile, incubated with 1 mg of TiO2 beads (GL Sciences, Inc. Japan) with rotation for 1 h at room temperature. The TiO2 beads were washed once with 5% TFA/80% acetonitrile, twice with 5% TFA/30% acetonitrile and once with 0.1% TFA/30% acetonitrile. Phosphopeptides were eluted from the beads by incubation with 1% ammonia hydrate (pH 10, diluted from a 28% ammonia–water solution) at room temperature for 5 min. The eluted peptides were desalted using C18 StageTips(34) prior to liquid chromatography-tandem mass spectrometry (LC-MS/MS) analysis. To improve recovery of the enrichment, the supernatant from the first round of TiO2 enrichment was subsequently incubated with fresh TiO2 beads one more time, and the peptides from the second enrichment were analyzed by LC–MS/MS as well.
Anti-pY Peptide IP
Peptides from the in-gel digestion were reconstituted in 50 mM Tris-HCl pH 8.0. The anti-pY antibody 4G10 (Millipore) was used to pull down pY peptides from the digest. We compared the performance of three commercial anti-pY antibodies: 4G10, PY99 (Santa Cruz Biotechnology, Santa Cruz, CA) and PY100 (Cell Signaling Technology) and found that 4G10 worked better than the other two antibodies for this application (data not shown). The antibody was coupled to protein G agarose beads (Roche) at 4 mg antibody per ml beads by incubation overnight at 4 °C with rotation. After coupling, the beads were washed four times with 20 bead volumes of 50 mM Tris-HCl pH 8.0. Coupled antibody (10 μL, 40 μg) was added to the peptides for IP at 4 °C overnight with rotation. We detected no tryptic peptides from the antibody in the IP eluate or the IP supernatant fluid, suggesting digestion of the pY antibody by the residual trypsin from the in-gel digestion was minimal. After IP the beads were washed three times with 400 μL of 50 mM Tris-HCl pH 8.0 and twice with 400 μL of water. Peptides were eluted twice from beads by incubation with 20 μL of 0.2% TFA at room temperature for 10 min. Eluted peptides were purified using C18 StageTips(34) before LC–MS/MS analysis.
Anti-pY Protein IP
The mixed lysate was incubated with agarose-conjugated anti-pY antibody PY99 (Santa Cruz Biotechnology, Santa Cruz, CA) for 4 h, and the beads were washed 4 times with lysis buffer. Precipitated proteins were eluted with a low pH buffer (pH 2) containing 0.2% TFA/1% SDS. The eluates were neutralized with 1 M ammonium bicarbonate and separated by SDS-PAGE on a 7.5% Tris-HCl gel (Biorad). The gel was stained with Coomassie Blue and the gel lanes were cut horizontally into 10 sections for in-gel tryptic digestion.
LC–MS/MS
For all LC–MS/MS analysis, an LTQ-Orbitrap hybrid mass spectrometer (Thermo Fisher Scientific) equipped with a nanoelectrospray ionization source (Jamie Hill Instrument Services) was used. An Eksigent nanoLC system (Eksigent Technologies) equipped with a self-packed 100-μm × 15-cm reverse phase column (Reprosil C18, 3 μm, Dr. Maisch GmbH, Germany) was coupled to the mass spectrometer. Peptides were eluted by a gradient of 3–40% acetonitrile in 0.1% formic acid over 150 min at a flow rate of 400 nL/min. Mass spectra were acquired in data-dependent mode with one 60000 resolution MS survey scan by the Orbitrap and up to eight MS/MS scans in the LTQ for the most intense peaks selected from each survey scan. Automatic gain control target value was set to 1000000 for Orbitrap survey scans and 5000 for LTQ MS/MS scans. Survey scans were acquired in profile mode and MS/MS scans were acquired in centroid mode.
Peptide Identification and Quantitation
The raw mass spectra files were processed using MaxQuant(35) software (version 1.0.13.8). Protein and peptide identification was performed using the Mascot search engine (version 2.2.1, Matrix Science) by querying the concatenated forward and reverse International Protein Index protein database, containing 55303 mouse and 39906 rat protein sequences and 175 commonly observed contaminants (in total 190768 sequences including reverse and contaminant sequences). The minimum required peptide length was 6 amino acids, and trypsin cleavage specificity was applied with 2 missed cleavages allowed. Variable modifications included phosphorylation (STY), oxidation (M) and N-acetylation (protein N-term). Carbamidomethylation (C) was set as fixed modification. Initially the maximum allowed mass deviations for precursor and fragment ions were set to 20 ppm and 0.5 Da, respectively. The results of the database search were further processed and statistically evaluated by MaxQuant. For protein and peptide identification, the maximum protein and peptide false discovery rates (FDR) were set to 0.01. In addition, posterior error probability for individual peptide identifications was required to be below or equal to 0.1. For pY protein analysis, proteins were considered identified with at least two peptides (with one uniquely assigned to the respective sequence).
Bioinformatics
To find statistically significantly overrepresented gene ontology (GO) terms and motifs, DAVID(36) (the database for annotation, visualization and integrated discovery, version 6.7) online function annotation tool was used. For the motif analysis, the SMART database was used.(37) A probability value of 0.05 was considered as significant.
For mapping proteins to KEGG pathways, the KEGG Mapper (version 1.0) was used.(38) For retrieving protein interactions and constructing protein interaction networks, the STRING database (version 8.3) was used.(39)
Results and Discussion
SILAC Analysis of EphB Signaling using Three Phosphoproteomic Strategies
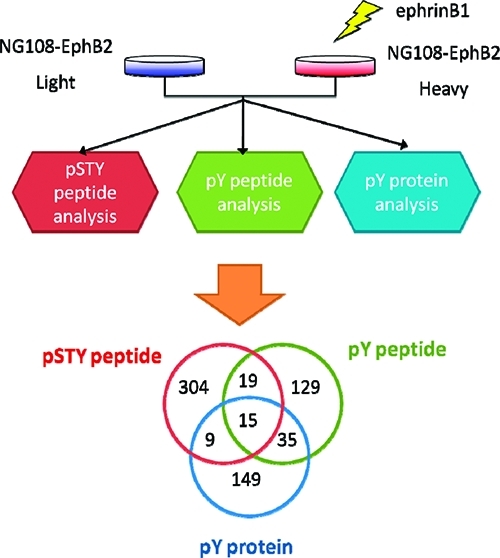
In this study, we performed SILAC experiments to quantify changes in phosphorylation caused by activation of Eph receptor signaling. The workflow of the experiments is shown in Figure 1. For protein and peptide quantitation, we used stable isotope labeling with amino acids in cell culture (SILAC).(40) One advantage of SILAC is that it allows combining of differentially labeled protein samples early on during sample preparation.(41) This is especially important for the experiments in this study because several sample fractionation and enrichment steps were involved.
Figure 1.

Overview of the workflow for using three phosphoproteomic strategies to study EphB signaling. NG108-EphB2 cells were labeled with SILAC. The ephrinB1 ligand treated and untreated cells were combined for each of the three analyses. For each cell condition, approximately 100 million cells were used for the pY peptide/protein analysis and about 20 million for the pSTY peptide analysis. The total mass spectrometry analysis time was 95, 2.5, and 20 h for the pSTY peptide, pY peptide and pY protein analysis, respectively.
For the pSTY peptide analysis, two biological SILAC replicate analyses were performed on phosphopeptides enriched by TiO2. From the two replicates, 5771 sites were quantified by MaxQuant. These sites correspond to 3854 peptides from 2086 proteins. 4809 phosphosites were class I sites (>75% localization probability). The relative occurrence of class I pS, pT and pY sites were 82%, 17% and 1% respectively. SILAC ratios from the two replicate analyses were consistent, indicating high reproducibility of the analysis (Supplementary Figure 1A, Supporting Information). Supplementary Table 1 (Supporting Information) lists all of the quantified phosphorylation sites. Figure 2A shows the SILAC ratios of quantified phosphopeptides. Using 1.5 fold as the SILAC ratio cutoff (corresponding to P < 0.02 as calculated by MaxQuant that the quantities are different by chance), 513 phosphorylation sites had changed SILAC ratios upon ephrinB1 treatment: 220 sites were up-regulated and 293 down-regulated. For the regulated phosphorylation sites, the relative occurrence of class I pS, pT and pY sites were 77, 17 and 6%. The relative pS/pT/pY abundances for both the whole data set and the regulated sites only are consistent with a previously published study on EGF signaling.(8) The significant enrichment of pY sites in the regulated sites reflects the fact that pY sites were more frequently regulated in EphB signaling than pS/pT sites.
Figure 2.

(A) SILAC ratios of pSTY peptides, (B) pY peptides and (C) pY proteins. Normalized phosphopeptide ratios (in A and B) or protein ratios (in C) are plotted against summed peptide or protein intensities.
For the pY peptide analysis, two biological SILAC replicates were performed on pY peptides enriched by an anti-pY antibody. From this analysis, 703 phosphosites were quantified by MaxQuant. These sites correspond to 609 peptides from 422 proteins. 628 sites were class I sites. Of these, 90% of phosphates were localized to tyrosine, 4% on serine, and 6% on threonine, though it is likely that some of the pS and pT assignments were due to incorrect localization. As in the case of the pSTY analysis, the results of the two biological replicates were highly correlated (Supplementary Figure 1B, Supporting Information). Supplementary Table 2 (Supporting Information) lists all the quantified phosphorylation sites. Figure 2B shows the SILAC ratios of quantified phosphopeptides. Using 1.5 fold as the SILAC ratio cutoff, 315 phosphorylation sites had changed SILAC ratios upon EphrinB1 treatment. 287 of these sites were up-regulated, 28 down-regulated.
For the pY protein analysis, two replicates of pY protein immunoprecipitates from ephrinB1 stimulated and unstimulated NG108-EphB2 cells were analyzed in a previously described experiment.(32) In that study the data set was processed using MSQuant software.(42) In the current study we reanalyzed this data set using MaxQuant so that the result can be compared with the results of the pSTY peptide and pY peptide analyses. From the two biological replicates, 872 proteins were quantified. The SILAC ratios from the two replicates were consistent (Supplementary Figure 1C, Supporting Information). The ratios by MaxQuant were consistent with those from our previous result by MSQuant (Supplementary Figure 2, Supporting Information). Figure 2C shows the SILAC ratios of quantified proteins. Two-hundred eight proteins changed their abundance by at least 1.5 fold: 195 proteins showed increased abundance in pY IP and 13 proteins showed decreased abundance. A list of all the quantified proteins is shown in Supplementary Information Table 3 (Supporting Information). In this analysis, 124 phosphosites were identified. However, their SILAC ratios cannot be attributed to site-specific phosphorylation changes because the phosphopeptide ratios could depend on other pY sites on the protein or on protein–protein interactions, so these phosphosites were not used for further analysis.
One potential concern for quantitative phosphoproteomics is that changes in protein expression can affect phosphopeptide/phosphoprotein ratios. In our SILAC analyses, we used the same cell line under the same growing conditions. The only difference between the two samples was that one set of cells was treated with ephrinB1-Fc for 45 min and the other set of cells was mock-treated with Fc. The time of treatment was short and thus we reasoned it would not lead to significant changes in protein expression. To experimentally confirm this, we analyzed the mixed SILAC cell lysate to compare protein abundance before and after the ephrinB1 treatment. We also quantified proteins identified from the TiO2 enrichment experiments using only nonphosphorylated peptides. These two analyses resulted in quantitation of 869 proteins and none of them showed a change in abundance greater than 1.5 fold (Supplementary Figure 3, Supporting Information).
To be able to compare the three phosphoproteomic strategies, it is important for the analyses to have similar coverage of the phosphoproteome. We identified a reasonably large number of phosphosites/proteins from each SILAC analysis, which allowed us to perform statistical analysis to compare the different strategies from multiple angles. Meanwhile, this level of analytical depth should be achievable by many proteomic laboratories that are equipped with similar instrumentation (which is becoming more and more accessible) with reasonable efforts. In that sense, the results from this study should be applicable to a broad range of analytical laboratories.
SILAC Ratio Distribution
When comparing the SILAC ratio distribution of the three analyses, one interesting observation is that the proportion of SILAC outliers (>1.5 fold changes in SILAC ratio) differed considerably among the three analyses (Figure 3A). About 9, 45 and 24% of phosphosites/proteins quantified from the pSTY peptide, pY peptide and pY protein analysis, respectively, were outliers. This means that the probability of a pY site being regulated by EphB receptor upon ligand binding was roughly 5 times (45/9) higher than those of pS/pT sites. This reflects the dramatic differences in the efficiency to detect changes in the RTK signaling by the three strategies. The pY protein analysis had considerably lower outlier percentage than the pY peptide analysis, possibly because of the presence of nonspecific binding proteins in pY protein IP. However, it is difficult to estimate the number of nonspecific binding proteins in a pY IP experiment.
Figure 3.

Comparison of SILAC ratio distributions. (A) SILAC ratio histograms for all quantified phosphosites/proteins from the three analyses. (B) Intensity histograms for changed phosphosites/proteins. For the peptide analyses, peptide MS intensities were used. For the pY protein analysis, protein intensity is calculated as summed peptide intensity. The intensities in the pY peptide and pY protein analyses are normalized to the pSTY peptide analysis based on median intensity. The dotted line shows the median intensity of all three data sets. (C) Box plot of absolute ratio changes for the regulated peptides/proteins.
Another interesting observation is that a considerable proportion of regulated sites detected in the pY peptide analysis were detected at high abundance, whereas regulated sites detected by the pSTY peptide experiment were mostly of low to medium abundance (Figure 3B). The abundance here refers to abundance of analyte in the prepared samples for MS after affinity purification, not the original abundance in the cell. This result is not surprising because it is well-known that a large number of pS/pT sites reside on highly abundant structural/metabolic proteins and these sites are generally not significantly regulated by RTK signaling. In contrast, highly phosphorylated tyrosine sites are often key targets of modulation in RTK signal transduction. The implication of this phenomenon for MS analysis is that in general regulated pY sites are identified and quantified with higher confidence than pS/pT sites because higher signaling intensity in MS leads to better qualitative and quantitative results.
We also observed that for the regulated phosphosites or proteins, the SILAC ratios were in general significantly more different from one in the pY peptide/protein analysis than in the pSTY peptide analysis. This is consistent with pY sites being more tightly controlled than pS/pT sites at basal levels. Figure 3C also shows that SILAC ratios were more significantly different from one in the pY protein analysis than in the pY peptide analysis. This suggests that in a pY protein IP, the binding affinity increases nonlinearly with simultaneous increase of tyrosine phosphorylation levels on multiple pY sites, that is, small changes of tyrosine phosphorylation on multiple sites on a protein can lead to a big change in the protein’s pY IP efficiency. This amplification effect makes it easier to distinguish some significantly regulated proteins from unchanged ones by using the pY protein strategy.
Overlap in Phosphosite Identification
The pSTY and pY peptide experiments had very small overlap in phosphosite identification. The two analyses identified 6445 phosphosites in total, while only 0.4% of them were identified in both analyses (Supplementary Figure 4A, Supporting Information). When only regulated phosphosites are considered, 2% of the sites were identified in both (Supplementary Figure 4B, Supporting Information). The small overlap was a result of both the high specificity of the pY peptide analysis for detecting pY sites and the inefficiency of the pSTY peptide analysis for detecting pY sites. The difficulty to detect pY sites by the pSTY peptide strategy is due to the fact that the TiO2 enriched peptide mixtures are dominated by pS and pT peptides, which affects detection of the much less abundant pY peptides. It should be noted that the pSTY experiment used 5 times less starting material than the pY peptide experiment. However, even if more material were used with more extensive sample fractionation, it would be still difficult for the pSTY peptide analysis to identify a comparable number of pY sites (∼700) because only ∼1% of the identified sites were on tyrosine residues in the TiO2 enrichment experiment. This means that to identify 700 pY sites, one would need to identify ∼70000 total phosphosites. But to our knowledge, the most comprehensive pSTY peptide analysis with SILAC so far in the literature identified 20443 phosphosites.(28) This indicates that our pY peptide analysis achieved much greater analytical depth in pY site identification than our pSTY peptide analysis. Therefore the pSTY peptide analysis strategy cannot yet replace the pY peptide analysis strategy for comprehensive screening of pY sites.
Overlap in Protein Identification
A major goal of phosphoproteomic analysis of intracellular signaling is to identify effector proteins that are involved in signal transduction. To compare the abilities of the three strategies to identify signaling effectors, we compared the proteins that were identified in the three SILAC experiments.
In total, 2866 proteins (all proteins from the pY protein experiment and proteins from pSTY/pY peptide experiment with identified phosphopeptides) were identified in the three experiments (Figure 4A). Only 3% of the proteins were identified in all three experiments, 12% identified in two of the three experiments and 85% identified in only one experiment. When only the regulated proteins are considered, the overlap was even smaller (Figure 4B). In total 660 potential effector proteins were identified. Two percent of effector proteins were identified in all three experiments, 10% in two experiments and 88% in only one experiment. This degree of overlap is much smaller than the overlap between replicates of the same experiment for each analysis (∼50% for the pY peptide and pY protein analyses, > 60% for the pSTY peptide analysis). Therefore the small overlap in protein identification by the three analyses was not a random event caused by run-to-run variations. This suggests that the three strategies preferentially target different subsets of the phosphoproteome.
Figure 4.

Overlap of proteins identified from the three analyses. (A) All proteins. (B) Proteins with >1.5 fold changes in SILAC ratio.
The pY peptide analysis and the pY protein analysis shared more effector proteins with each other than with the pSTY peptide analysis, probably because they were both based on detecting changes in tyrosine phosphorylation. Nevertheless, the effector proteins identified in both experiments only accounts for 14% of the total effector proteins identified in the two experiments. It was observed that in these two experiments SILAC ratios for pY proteins and their pY sites were not always consistent (Figure 5). A total of 206 proteins identified in the pY protein analysis had phosphosites identified in the pY peptide analysis. 49 of these proteins had unchanged protein ratios in the pY protein analysis but significantly changed phosphosite ratios in the pY peptide analysis. Conversely, 21 proteins with changed protein ratios had no changed phosphosite ratios as measured by the pY peptide analysis. These two types of proteins accounted for 34% of all effector proteins identified in both analyses, suggesting that the pY peptide and pY protein analyses were complementary in finding effector proteins even though they are both based on measuring tyrosine phosphorylation. The most likely reasons are: (1) Different phosphosites on the same protein are regulated differently, sometimes in different directions. The pY protein strategy is unable to identify effector proteins in cases where specific pY sites on a protein are significantly regulated, but this regulation does not lead to a significant change in the total pY level of the protein. For example, Tubulin beta-3 chain (Tubb3) had a protein ratio of 1.0 in the pY protein analysis. Two pY peptides from this protein, FWEVISDEHGIDPSGNY(ph)VGDSDLQLER and VSDTVVEPYNATLSIHQLVENTDETYCIDNEALY(ph)DICFR were identified in the pY peptide analysis with significant changes in opposite directions (0.47 and 1.7, respectively). In that sense, proteins with unchanged ratios in a pY protein analysis are not always noneffectors. In such cases, a pY peptide analysis may provide complementary information to determine if the protein is involved in the signaling. (2) In a pY peptide analysis, usually not all the pY sites on a protein are detectable by MS, due for example, to location on very large or very small tryptic peptides. But as long as the regulated sites cause a change in the overall pY level of the protein, it is possible to identify the effector with a pY protein analysis.
Figure 5.
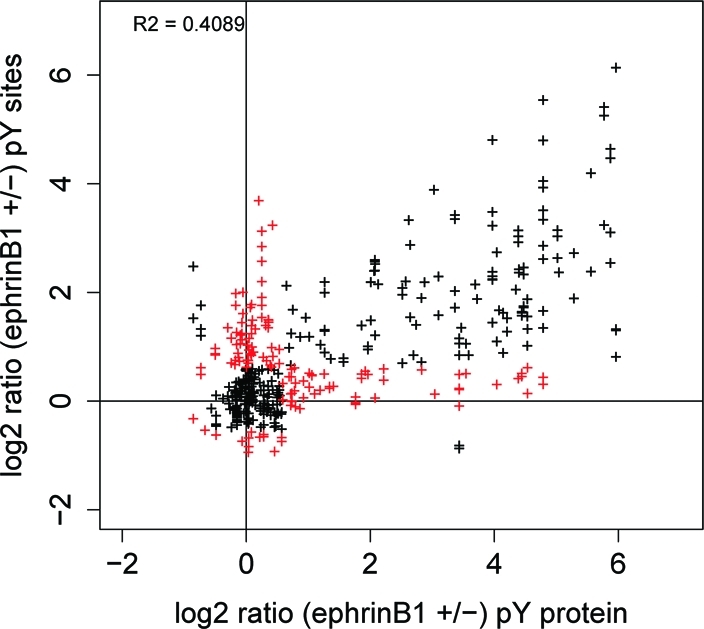
Correlation of SILAC ratios between pY proteins (from the pY protein experiment) and their pY sites (from the pY peptide experiment). Data points in red represent cases where significant SILAC ratios were observed in one experiment but not the other.
Overall, the pSTY peptide, pY peptide and pY protein experiments contributed 40%, 20% and 23% of unique effectors to the combined result, respectively. This indicates that the three experiments were very complementary in discovering effector proteins in the pathway.
GO Annotation/Domain Enrichment Analysis
To find out which parts of the proteome the three different strategies prefer to detect, we performed gene ontology enrichment analysis of the quantified proteins from each experiment using all mouse proteins from the Swissprot database as the background (Supplementary Table 4, Supporting Information). The result shows that these three strategies enriched several common GO categories, including cell junction, cytoskeleton and protein transport. They also exhibited specific preferences for enriching different GO categories such as nucleus, DNA binding, plasma membrane, translation and transcription. In general, it seems that the pSTY peptide analysis showed preference toward implication of nuclear proteins and DNA binding proteins, while the pY peptide and pY protein experiments preferred proteins on or close to the cell surface.
To further confirm this observation, we performed a domain enrichment analysis (Supplementary Table 5, Supporting Information). We observed that zinc finger domain (ZnF_C3H1), which is known to be involved in protein–DNA interactions, was significantly enriched by the pSTY peptide analysis but not the other two. In contrast, SH2 and SH3 domains, which are well characterized domains that are involved in signaling complex assembly proximal to the plasma membrane in early RTK signaling, are much more enriched by the pY peptide and pY protein analyses. Thus the domain analysis results are consistent with the GO analysis.
Last, we compared the ability of the three analyses to identify several major categories of signaling proteins as effector proteins by counting the numbers of these proteins that were quantified as effector proteins by each of the three analyses. These categories include kinase, tyrosine kinase, transcription factor, GTPase, adaptor protein, G-protein coupled receptor, scaffold protein and phosphatase. The result (Figure 6) shows that while the three analyses performed similarly in some categories such as phosphatase, they differed significantly in others. The pSTY peptide analysis identified many more transcription factors than the other two analyses. The exceptional ability of the pSTY strategy to identify transcription factors in our experiment is also in line with the result from a previous study on EGFR signaling.(8) Both the pY peptide and pY protein analyses identified two adaptor proteins while the pSTY peptide analysis identified none. Moreover, the pSTY analysis identified more kinases but fewer transmembrane or membrane-associated tyrosine kinases than the other two analyses.
Figure 6.
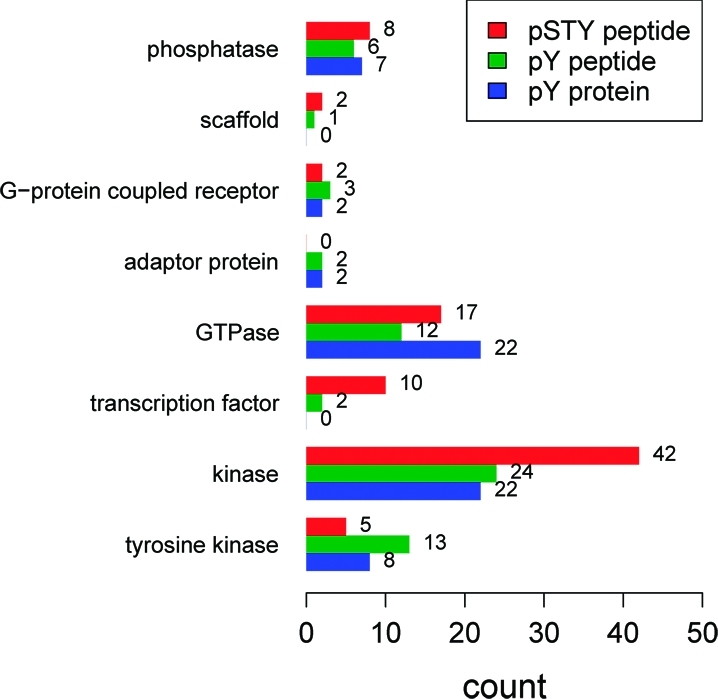
Different categories of effector proteins identified by the three analyses. Only proteins with >1.5 fold changes in SILAC ratio are considered.
Our GO annotation and domain enrichment analysis results further support the idea that the three strategies have preferences for detecting particular subsets of the phosphoproteome. It also implies biological reasons for the lack of overlap between the three strategies. RTK signaling is a sophisticated process which involves temporal and spatial regulation of proteins on multiple levels. In a typical scheme, in the early stage of signal processing, RTK activation leads to recruitment of signaling mediators such as adaptor proteins, for assembly of signaling complexes close to the plasma membrane. Later the signal is transmitted spatially from the cell surface toward different cellular compartments. Lastly, signaling proteins are translocated into the nucleus to regulate transcription, which eventually causes changes in protein expression. In the early stage, most signaling events, including endocytosis, are highly dependent on tyrosine phosphorylation. In later stages, serine and threonine phosphorylation gradually becomes more important. This would explain our observation that the pY peptide/pY protein strategies performed better in identifying signaling proteins in early signaling events, such as plasma membrane proteins and adaptor proteins, while the pSTY peptide strategy is more successful in identifying signaling proteins in late signaling events, such as transcription factors and nuclear proteins.
Protein Interaction Networks
To find out which strategy is more efficient in detecting protein interactions for the EphB pathway, we uploaded the regulated proteins identified in the three analyses to the STRING protein interaction database to retrieve protein interactions for each analysis. The output networks are shown in Supplementary Figures 5, 6 and 7 (Supporting Information). It can be observed that the pY peptide and pY protein analyses resulted in overall more strongly connected interaction networks. Several subnetworks, such as endocytosis (Supplementary Figure 7), cytoskeletal regulation (Supplementary Figure 7), and protein translation (Supplementary Figure 6), can be easily recognized because the related proteins are tightly connected by high confidence interactions. By contrast, the pSTY peptide analysis network is less tightly connected. The number of regulated proteins from each analysis with documented interactions in the STRING database was 325 for the pSTY peptide analysis, 187 for the pY peptide analysis and 196 for the pY protein analysis. The number of interactions between these proteins was 305 for the pSTY peptide analysis, 308 for the pY peptide analysis and 269 for the pY protein analysis. Although the pSTY peptide analysis generated more proteins with documented interactions in the STRING database, the number of total interactions was almost the same as the pY peptide analysis and only slightly more than the pY protein analysis. Moreover, the pY peptide and pY protein analyses both identified seven direct EphB receptor interactors, while the pSTY analysis only identified three. Taken together, these results suggest that the pY peptide and pY protein analyses were more efficient in detecting proteins in signaling complexes.
Another observation is that the pY peptide analysis detected slightly more protein interactions than the pY protein analysis. It was somewhat unexpected that the pY protein analysis detected fewer interactions than the pY peptide analysis. It has been thought that the pY protein strategy can detect binding partners of pY proteins, which should translate into more protein interactions. But our result suggests that the contribution of this mechanism to effector protein discovery may be more limited than previously thought. A possible explanation is that many protein interactions in RTK signaling are transient in nature and not properly maintained during pY IP. It is possible that protein interactions that are dependent on pY sites can be disrupted by competitive binding from anti-pY antibodies during an anti- pY IP.
Association of Regulated Proteins with Signaling Pathways
To determine which downstream pathways were regulated by activation of the EphB receptor, the regulated proteins identified in the three analyses were mapped to KEGG pathways. The mapping was performed for each individual SILAC analysis and also the combined result of all three analyses. The pathways that included at least 15 proteins found in the combined protein list are shown in Supplementary Figure 8 (Supporting Information). The best represented pathways cover most of the known downstream pathways of the EphB receptor, which include endocytosis, axon guidance, and regulation of cytoskeleton, demonstrating the efficiency of our SILAC experiments for detecting signal transduction networks.
The three analyses implicated more or less the same KEGG pathways, suggesting that the different approaches are able to consistently detect the same signaling outcome. However, in some pathways such as endocytosis and metabolic pathways, the three approaches resulted in very different coverage of component proteins in the networks. Although the pSTY peptide analysis contributed the highest number of regulated proteins, the pY peptide and pY protein analyses generated similar numbers of proteins mapped to most of the pathways in Supplementary Figure 8 (Supporting Information). The combined result identified more than twice as many mapped proteins as each individual analysis (2.2 times as the pSTY peptide analysis, 2.5 times as the pY peptide analysis and 2.0 times as the pY protein analysis), which again underscores the fact that the three strategies are highly complementary.
Conclusions
We have assessed the performance of the pSTY peptide, pY peptide and pY protein analysis strategies for RTK signaling study using EphB signaling as an example. Our results show that the three strategies are very complementary in providing information about RTK pathways. Importantly, one strategy may be more efficient for some particular time points or locations in the signaling pathway but less optimal for others. Recognition of these characteristics of the strategies will allow researchers to better choose the most efficient strategy based on their specific analytical goals.
Previous phosphoproteomic studies have used one of the three phosphoproteomic strategies to investigate RTK signaling pathways. Many of these studies chose to use the pY based strategies because of the central role of tyrosine phosphorylation in RTK signal transduction. A major limitation of these strategies is that they are unable to detect phosphorylation changes on serine and threonine sites. Our results demonstrate that while the pY based strategies indeed perform well in elucidating the signaling networks that are spatially close to the receptor in early signaling stages, a large population of pS/pT sites/proteins that are further downstream of the receptor are undetectable by these approaches. The number of these pS/pT effectors can be significantly more than the pY effectors as shown in our analysis of the Eph pathway. Conversely, if the pSTY peptide analysis strategy is used alone, detection of changes on pY sites is greatly compromised because it does not have sufficient analytical depth for pY peptides. Thus the use of both the pSTY peptide analysis strategy and the pY based strategies is necessary to obtain a more complete view of the pathway. Moreover, our results also show that the two pY based strategies are highly complementary in identifying effector proteins. This justifies the use of all three strategies in RTK signaling studies to maximize coverage of the pathways.
An observation worth noting is that although the pY protein strategy cannot provide information about specific phosphosites and thus is often deemed inferior to the other two approaches, our result shows that it is an efficient approach for identification of effector proteins. It identified more effector proteins than the pY peptide strategy (Figure 4B), and more effector proteins that are mapped to key associated pathways than both the other two strategies. Among the three strategies, it has the unique ability to identify effector proteins that are phosphorylated on sites that are difficult to be detected by MS.
For the analysis of EphB signaling, the use of all three strategies significantly increased the number of identified effector/potential effector proteins from 204 by one strategy (pY protein analysis from a previous study(32)) to 660. Moreover, this study revealed hundreds of phosphosites that are regulated by EphB receptor activation. This large pool of potential targets generated by this study will facilitate future biological research to better understand the molecular basis of EphB signaling.
Acknowledgments
This work was supported by National Institutes of Health Grants P30 NS050276, S10 RR 017990-01 and NCI Core Grant 2P30 CA 016087 (to T.A.N.).
Glossary
Abbreviations:
- GO
gene ontology
- IP:
immunoprecipitation
- LC
liquid chromatography
- MS
mass spectrometry
- MS/MS
tandem mass spectrometry
- pSTY
phosphoserine/phosphothreonine/phosphotyrosine
- pY
phosphotyrosine
- RTK
receptor tyrosine kinase
- SILAC
stable isotope labeling with amino acids in cell culture
- TFA
trifluoroacetic acid
Supporting Information Available
Supplementary Figure 1, correlation of SILAC ratios between replicate experiments. Supplementary Figure 2, correlation of SILAC ratios between MSQuant and MaxQuant. Supplementary Figures 3, SILAC ratios of protein abundance before and after ephrinB1 treatment. Supplementary Figure 4, overlap of phosphosites identified from the pSTY and pY peptide analyses. Supplementary Figures 5, 6 and 7, protein interaction networks for proteins with changed SILAC ratios in the pSTY peptide, pY peptide and pY protein analyses. Supplementary Figure 8, pathways identified by the three analyses. Supplementary Table 1, phosphosites quantified in the pSTY peptide analysis. Supplementary Table 2, phosphosites quantified in the pY peptide analysis. Supplementary Table 3, proteins quantified in the pY protein analysis. Supplementary Table 4, P-values for GO enrichment analysis. Supplementary Table 5, P-values for domain enrichment analysis. This material is available free of charge via the Internet at http://pubs.acs.org.
Funding Statement
National Institutes of Health, United States
Supplementary Material
References
- Schlessinger J. Cell signaling by receptor tyrosine kinases. Cell 2000, 103 (2), 211–25. [DOI] [PubMed] [Google Scholar]
- Lemmon M. A.; Schlessinger J. Cell signaling by receptor tyrosine kinases. Cell 2010, 141 (7), 1117–34. [DOI] [PMC free article] [PubMed] [Google Scholar]
- Pawson T. Regulation and targets of receptor tyrosine kinases. Eur. J. Cancer 2002, 38 (5), S3–10. [DOI] [PubMed] [Google Scholar]
- Choudhary C.; Mann M. Decoding signalling networks by mass spectrometry-based proteomics. Nat. Rev. Mol. Cell. Biol. 2010, 11 (6), 427–39. [DOI] [PubMed] [Google Scholar]
- Macek B.; Mann M.; Olsen J. V. Global and site-specific quantitative phosphoproteomics: principles and applications. Annu. Rev. Pharmacol. Toxicol. 2009, 49, 199–221. [DOI] [PubMed] [Google Scholar]
- Jensen O. N. Interpreting the protein language using proteomics. Nat. Rev. Mol. Cell. Biol. 2006, 7 (6), 391–403. [DOI] [PubMed] [Google Scholar]
- Dengjel J.; Kratchmarova I.; Blagoev B. Receptor tyrosine kinase signaling: a view from quantitative proteomics. Mol. Biosyst. 2009, 5 (10), 1112–21. [DOI] [PubMed] [Google Scholar]
- Olsen J. V.; Blagoev B.; Gnad F.; Macek B.; Kumar C.; Mortensen P.; Mann M. Global, in vivo, and site-specific phosphorylation dynamics in signaling networks. Cell 2006, 127 (3), 635–648. [DOI] [PubMed] [Google Scholar]
- Lee C. F.; Griffiths S.; Rodriguez-Suarez E.; Pierce A.; Unwin R. D.; Jaworska E.; Evans C. A.; S J. G.; Whetton A. D. Assessment of downstream effectors of BCR/ABL protein tyrosine kinase using combined proteomic approaches. Proteomics 2010, 10 (18), 3321–42. [DOI] [PubMed] [Google Scholar]
- Choudhary C.; Olsen J. V.; Brandts C.; Cox J.; Reddy P. N.; Bohmer F. D.; Gerke V.; Schmidt-Arras D. E.; Berdel W. E.; Muller-Tidow C.; Mann M.; Serve H. Mislocalized activation of oncogenic RTKs switches downstream signaling outcomes. Mol. Cell 2009, 36 (2), 326–39. [DOI] [PubMed] [Google Scholar]
- Weintz G.; Olsen J. V.; Fruhauf K.; Niedzielska M.; Amit I.; Jantsch J.; Mages J.; Frech C.; Dolken L.; Mann M.; Lang R. The phosphoproteome of toll-like receptor-activated macrophages. Mol. Syst. Biol. 2010, 6, 371. [DOI] [PMC free article] [PubMed] [Google Scholar]
- Wolf-Yadlin A.; Kumar N.; Zhang Y.; Hautaniemi S.; Zaman M.; Kim H. D.; Grantcharova V.; Lauffenburger D. A.; White F. M. Effects of HER2 overexpression on cell signaling networks governing proliferation and migration. Mol. Syst. Biol. 2006, 2, 54. [DOI] [PMC free article] [PubMed] [Google Scholar]
- Rikova K.; Guo A.; Zeng Q.; Possemato A.; Yu J.; Haack H.; Nardone J.; Lee K.; Reeves C.; Li Y.; Hu Y.; Tan Z.; Stokes M.; Sullivan L.; Mitchell J.; Wetzel R.; Macneill J.; Ren J. M.; Yuan J.; Bakalarski C. E.; Villen J.; Kornhauser J. M.; Smith B.; Li D.; Zhou X.; Gygi S. P.; Gu T. L.; Polakiewicz R. D.; Rush J.; Comb M. J. Global survey of phosphotyrosine signaling identifies oncogenic kinases in lung cancer. Cell 2007, 131 (6), 1190–203. [DOI] [PubMed] [Google Scholar]
- St-Germain J. R.; Taylor P.; Tong J.; Jin L. L.; Nikolic A.; Stewart I. I.; Ewing R. M.; Dharsee M.; Li Z.; Trudel S.; Moran M. F. Multiple myeloma phosphotyrosine proteomic profile associated with FGFR3 expression, ligand activation, and drug inhibition. Proc. Natl. Acad. Sci. U.S.A. 2009, 106 (47), 20127–32. [DOI] [PMC free article] [PubMed] [Google Scholar]
- Zhang Y.; Wolf-Yadlin A.; Ross P. L.; Pappin D. J.; Rush J.; Lauffenburger D. A.; White F. M. Time-resolved mass spectrometry of tyrosine phosphorylation sites in the epidermal growth factor receptor signaling network reveals dynamic modules. Mol. Cell. Proteomics 2005, 4 (9), 1240–50. [DOI] [PubMed] [Google Scholar]
- Schmelzle K.; Kane S.; Gridley S.; Lienhard G. E.; White F. M. Temporal dynamics of tyrosine phosphorylation in insulin signaling. Diabetes 2006, 55 (8), 2171–9. [DOI] [PubMed] [Google Scholar]
- Jorgensen C.; Sherman A.; Chen G. I.; Pasculescu A.; Poliakov A.; Hsiung M.; Larsen B.; Wilkinson D. G.; Linding R.; Pawson T. Cell-specific information processing in segregating populations of Eph receptor ephrin-expressing cells. Science 2009, 326 (5959), 1502–9. [DOI] [PubMed] [Google Scholar]
- Blagoev B.; Ong S. E.; Kratchmarova I.; Mann M. Temporal analysis of phosphotyrosine-dependent signaling networks by quantitative proteomics. Nat. Biotechnol. 2004, 22 (9), 1139–45. [DOI] [PubMed] [Google Scholar]
- Hinsby A. M.; Olsen J. V.; Bennettt K. L.; Mann M. Signaling initiated by overexpression of the fibroblast growth factor receptor-1 investigated by mass spectrometry. Mol. Cell. Proteomics 2003, 2 (1), 29–36. [DOI] [PubMed] [Google Scholar]
- Hinsby A. M.; Olsen J. V.; Mann M. Tyrosine phosphoproteomics of fibroblast growth factor signaling: a role for insulin receptor substrate-4. J. Biol. Chem. 2004, 279 (45), 46438–47. [DOI] [PubMed] [Google Scholar]
- Zhang G.; Spellman D. S.; Skolnik E. Y.; Neubert T. A. Quantitative phosphotyrosine proteomics of EphB2 signaling by stable isotope labeling with amino acids in cell culture (SILAC). J. Proteome Res. 2006, 5 (3), 581–8. [DOI] [PMC free article] [PubMed] [Google Scholar]
- Kratchmarova I.; Blagoev B.; Haack-Sorensen M.; Kassem M.; Mann M. Mechanism of divergent growth factor effects in mesenchymal stem cell differentiation. Science 2005, 308 (5727), 1472–7. [DOI] [PubMed] [Google Scholar]
- Dengjel J.; Akimov V.; Olsen J. V.; Bunkenborg J.; Mann M.; Blagoev B.; Andersen J. S. Quantitative proteomic assessment of very early cellular signaling events. Nat. Biotechnol. 2007, 25 (5), 566–8. [DOI] [PubMed] [Google Scholar]
- Ibarrola N.; Molina H.; Iwahori A.; Pandey A. A novel proteomic approach for specific identification of tyrosine kinase substrates using [13C]tyrosine. J. Biol. Chem. 2004, 279 (16), 15805–13. [DOI] [PubMed] [Google Scholar]
- Kruger M.; Kratchmarova I.; Blagoev B.; Tseng Y. H.; Kahn C. R.; Mann M. Dissection of the insulin signaling pathway via quantitative phosphoproteomics. Proc. Natl. Acad. Sci. U.S.A. 2008, 105 (7), 2451–6. [DOI] [PMC free article] [PubMed] [Google Scholar]
- Bose R.; Molina H.; Patterson A. S.; Bitok J. K.; Periaswamy B.; Bader J. S.; Pandey A.; Cole P. A. Phosphoproteomic analysis of Her2/neu signaling and inhibition. Proc. Natl. Acad. Sci. U.S.A. 2006, 103 (26), 9773–8. [DOI] [PMC free article] [PubMed] [Google Scholar]
- Villen J.; Beausoleil S. A.; Gerber S. A.; Gygi S. P. Large-scale phosphorylation analysis of mouse liver. Proc. Natl. Acad. Sci. U.S.A. 2007, 104 (5), 1488–93. [DOI] [PMC free article] [PubMed] [Google Scholar]
- Olsen J. V.; Vermeulen M.; Santamaria A.; Kumar C.; Miller M. L.; Jensen L. J.; Gnad F.; Cox J.; Jensen T. S.; Nigg E. A.; Brunak S.; Mann M. Quantitative phosphoproteomics reveals widespread full phosphorylation site occupancy during mitosis. Sci. Signal. 2010, 3 (104), ra3. [DOI] [PubMed] [Google Scholar]
- Rush J.; Moritz A.; Lee K. A.; Guo A.; Goss V. L.; Spek E. J.; Zhang H.; Zha X. M.; Polakiewicz R. D.; Comb M. J. Immunoaffinity profiling of tyrosine phosphorylation in cancer cells. Nat. Biotechnol. 2005, 23 (1), 94–101. [DOI] [PubMed] [Google Scholar]
- Huttlin E. L.; Jedrychowski M. P.; Elias J. E.; Goswami T.; Rad R.; Beausoleil S. A.; Villen J.; Haas W.; Sowa M. E.; Gygi S. P. A tissue-specific atlas of mouse protein phosphorylation and expression. Cell 2010, 143 (7), 1174–89. [DOI] [PMC free article] [PubMed] [Google Scholar]
- Pasquale E. B. Eph receptor signalling casts a wide net on cell behaviour. Nat. Rev. Mol. Cell. Biol. 2005, 6 (6), 462–75. [DOI] [PubMed] [Google Scholar]
- Zhang G.; Fenyo D.; Neubert T. A. Screening for EphB signaling effectors using SILAC with a linear ion trap-orbitrap mass spectrometer. J. Proteome Res. 2008, 7 (11), 4715–26. [DOI] [PMC free article] [PubMed] [Google Scholar]
- Lu X.; Zhu H. Tube-gel digestion: a novel proteomic approach for high throughput analysis of membrane proteins. Mol. Cell. Proteomics 2005, 4 (12), 1948–58. [DOI] [PMC free article] [PubMed] [Google Scholar]
- Rappsilber J.; Mann M.; Ishihama Y. Protocol for micro-purification, enrichment, pre-fractionation and storage of peptides for proteomics using StageTips. Nat. Protoc. 2007, 2 (8), 1896–906. [DOI] [PubMed] [Google Scholar]
- Cox J.; Mann M. MaxQuant enables high peptide identification rates, individualized p.p.b.-range mass accuracies and proteome-wide protein quantification. Nat. Biotechnol. 2008, 26 (12), 1367–72. [DOI] [PubMed] [Google Scholar]
- Dennis G. Jr.; Sherman B. T.; Hosack D. A.; Yang J.; Gao W.; Lane H. C.; Lempicki R. A. DAVID: Database for Annotation, Visualization, and Integrated Discovery. Genome Biol. 2003, 4 (5), P3. [PubMed] [Google Scholar]
- Letunic I.; Doerks T.; Bork P. SMART 6: recent updates and new developments. Nucleic Acids Res. 2009, 37 (Database issue), D229–32. [DOI] [PMC free article] [PubMed] [Google Scholar]
- Kanehisa M.; Goto S.; Furumichi M.; Tanabe M.; Hirakawa M. KEGG for representation and analysis of molecular networks involving diseases and drugs. Nucleic Acids Res. 2009, 38 (Database issue), D355–60. [DOI] [PMC free article] [PubMed] [Google Scholar]
- Jensen L. J.; Kuhn M.; Stark M.; Chaffron S.; Creevey C.; Muller J.; Doerks T.; Julien P.; Roth A.; Simonovic M.; Bork P.; von Mering C. STRING 8--a global view on proteins and their functional interactions in 630 organisms. Nucleic Acids Res. 2009, 37 (Database issue), D412–6. [DOI] [PMC free article] [PubMed] [Google Scholar]
- Ong S. E.; Blagoev B.; Kratchmarova I.; Kristensen D. B.; Steen H.; Pandey A.; Mann M. Stable isotope labeling by amino acids in cell culture, SILAC, as a simple and accurate approach to expression proteomics. Mol. Cell. Proteomics 2002, 1 (5), 376–86. [DOI] [PubMed] [Google Scholar]
- Ong S. E.; Mann M. Mass spectrometry-based proteomics turns quantitative. Nat. Chem. Biol. 2005, 1 (5), 252–62. [DOI] [PubMed] [Google Scholar]
- Mortensen P.; Gouw J. W.; Olsen J. V.; Ong S. E.; Rigbolt K. T.; Bunkenborg J.; Cox J.; Foster L. J.; Heck A. J.; Blagoev B.; Andersen J. S.; Mann M. MSQuant, an open source platform for mass spectrometry-based quantitative proteomics. J. Proteome Res. 2010, 9 (1), 393–403. [DOI] [PubMed] [Google Scholar]
Associated Data
This section collects any data citations, data availability statements, or supplementary materials included in this article.