

Abstract
The mitochondrial genome is a fundamental component of the eukaryotic domain of life, encoding for several important subunits of the respiratory chain, the main energy production system in cells. The processes by means of which mitochondrial DNA (mtDNA) replicates, expresses itself and evolves have been explored over the years, although various aspects are still debated. In this review, we present several key points in modern research on the role of evolutionary forces in affecting mitochondrial genomes in Metazoa. In particular, we assemble the main data on their evolution, describing the contributions of mutational pressure, purifying, and adaptive selection, and how they are related. We also provide data on the evolutionary fate of the mitochondrial synonymous variation, related to the nonsynonymous variation, in comparison with the pattern detected in the nucleus.
Elevated mutational pressure characterizes the evolution of the mitochondrial synonymous variation, whereas purging selection, physiologically due to phenomena such as cell atresia and intracellular mtDNA selection, guarantees coding sequence functionality. This enables mitochondrial adaptive mutations to emerge and fix in the population, promoting mitonuclear coevolution.
Keywords: mitochondria, genetic bottleneck, mutational pressure, selection, nuclear–mitochondrial coevolution, synonymous codon usage
Introduction
An unexpected property of living matter was discovered about 50 years ago: Eukaryotic cells are characterized by genomic chimerism because, in addition to the main nuclear genome, they possess additional genomes in the cytoplasm (Ephrussi and Slonimski 1955; Chevremont 1960; Nass MM and Nass S 1962). The cytoplasm of all respiring cells contains organelles, called mitochondria, which are equipped with a specific genome (mtDNA, mitochondrial DNA) and a complete system for its replication and expression (for details, see box 1).
Box 1.
Functional Role of Mitochondrial Genomes
The most important biochemical process located in mitochondria is OXPHOS, the process by means of which aerobic eukaryotic cells synthesize ATP with molecular oxygen as electron terminal acceptor. Mitochondrial genomes encode for the three distinct gene classes involved in this process: ribosomal, transfer, and protein-coding genes. Genes for small and large rRNA (12 S and 16 S in Mammals, for example) are found universally; indeed, genes for tRNA vary greatly in terms of numbers, although a set of 22–27 tRNAs is common in many eukaryotic groups. Protein-coding genes are subdivided into two pools: “ribosomal protein” and “bioenergetic.” The former are involved in ribosomal subunit synthesis and mainly occur in protist and plant mitochondrial genomes (Adams and Palmer 2003). The latter are universal and encode for the protein subunits of the RC, the multienzymatic system which creates the proton gradient necessary for ATP synthesis (or heat generation). Although the bioenergetic gene repertoire varies among the several eukaryote domains (plants, fungi, protists, animals), two important ideas emerge from the accumulating sequence data. All respiring organisms always have a minimal set of bioenergetic genes (CYTB and CO1 are the most highly conserved), but, in all of them, the mitochondrial bioenergetic gene pool is never sufficient to encode for all the RC subunits (Adams and Palmer 2003).
In Metazoa, mitochondrial gene content is quite stable: There are 37 canonical mitochondrial genes encoding for two ribosomal RNAs, 22 for tRNAs, and 13 for the RC subunits. Complex I contains 7 of the 13 mitochondrially encoded proteins (Nd1, Nd2, Nd3, Nd4, Nd4l, Nd5, Nd6): Nd2, Nd4, and Nd5 seem to work as electron transporters, whereas Nd1 and Nd2 play an important structural role between the membrane-embedded and peripheral arms of the complex (da Fonseca et al. 2008). Complex II consists entirely of nuclear-encoded proteins; Cytb, having essentially catalytic activity (cytochrome c reduction), is the only mtDNA-derived subunit of Complex III. In the CO complex (Complex IV), Co1 protein catalyzes electron transfer to the ultimate acceptor, molecular oxygen; Co2 and Co3 also belong to the catalytic core of the complex, in which nuclear subunits are mainly located externally. Regarding ATP synthase (Complex V), ATP6 is a key component of the proton channel (FO component) and ATP8 seems to be a regulator of complex assembly (da Fonseca et al. 2008).
The nucleus regulates the production of all other RC proteins: about 39 for Complex I, 4 for Complex II, 10 for Complex III, 10 for Complex IV, and 15 for Complex V (Scarpulla 2008).
However, the contribution of the nucleus to mitochondrial functionality is not limited to the 80-odd proteins (in mammals) directly involved in OXPHOS. It has been estimated that more than 1,500 genes regulate the varying aspects of mitochondrial activity (Wallace 2005), such as DNA replication and repair, gene expression and its modulation, complex assembly, etc.
More or less at the same time, the same situation was discovered in the plastids, which contain a specific plastidial genetic system (Chiba 1951). Milestones in research on mtDNA are shown in table 1.
Table 1.
Important Steps in Study of Mitochondrial Genome
| Year | Event |
| 1949 | Slonimski and Ephrussi isolated yeast mutants which were defective for cell respiration and hypothesized presence of some non-Mendelian genetic characters (Ephrussi 1949). |
| 1960 | Chevremont demonstrated that mitochondria incorporated tritiated thymidine, a marker nucleoside: nucleic acid metabolism in mitochondria (Chevremont 1960). |
| 1962 | Nass and Nass demonstrated by morphological studies that mitochondria contained DNA (Nass MM and Nass S 1962). |
| 1965 | Saccone et al. showed that isolated mitochondria were able to synthesize RNA (Saccone et al. 1965). |
| 1965 | Kroon demonstrated that intact mitochondria or fragments could incorporate amino acids, signaling presence of a protein translation system in organelle (Kroon 1965). |
| 1967 | Clayton DA and Vinograd J isolated circular dimer and concatenate forms of mtDNA in human cancer cell lines (Clayton and Vinograd 1967). |
| 1974 | Bogenhagen and Clayton revealed multicopy state of mtDNA in human and mouse cells (Bogenhagen and Clayton 1974). |
| 1974 | Berk AJ and Clayton DA clarified several features of mtDNA replication in mouse cells, including its asymmetry in time and space (Berk and Clayton 1974). |
| 1975 | First complete mitochondrial genomes cloned by Chang et al. (1975). |
| 1981 | First complete genome, belonging to human, was sequenced by Anderson et al. Bibb and Clayton sequenced mouse mtDNA (Anderson et al. 1981; Bibb et al. 1981). |
Note.—Table summarizes the main scientific contributions that have clarified some structural and metabolic features of mitochondrial genomes, until first sequencing experiments (1980s).
The presence of extracytoplasmic genomes in cells raises important questions which are still elusive. Where do they come from? What are the relationships among genomes?
It was in this scenario that the endosymbiotic theory—that modern eukaryotes arose from an endosymbiotic event—was later put forward (Margulis 1970). This theory postulates that an alpha-proteobacterium gave rise to the mitochondrion, once it was engulfed in a heterotrophic host cell, probably an archaebacterium. Various models regarding the precise nature of the endosymbiotic process from the archaebacterium to the eukaryotes are still being debated (Gray et al. 1999; Embley and Martin 2006; Poole and Penny 2006). The main point of discussion is whether the endosymbiotic event directly promoted the development of eukaryotes in a single step or whether it is simply one of the evolutionary steps toward modern eukaryotes.
Indeed, in the case of the chloroplast, a cyanobacterium, engulfed by an ancestor of plants and algae, became a new photosynthetic organelle.
The solution adopted by eukaryotes to preserve cytoplasmic genomes apparently has no economic value because many genes are necessary to replicate, transcribe, and translate the few genes still present today in cytoplasmic DNAs, and it also poses serious constraints to the life cycle of eukaryotic cells (Reinecke et al. 2009).
Restricting our discussion to mtDNA, we may ask ourselves: Why a mitochondrial genome? The persistence of an auxiliary genome in the eukaryotic cell has been discussed at length: Although the progenitor genome underwent “reductive” evolution (mainly in metazoans), the mitochondrial genome still survives and works in almost all eukaryotes. Several hypotheses as to why organelles retain their genomes have been put forward. Differences in genetic code (e.g., nuclear DNA [nDNA] vs. mtDNA code in Metazoa) represent a strong barrier against complete absorption of mtDNA into the nucleus (de Grey 2005). The hydrophobicity hypothesis (Von Heijne 1986) emphasizes the concept that mitochondrially encoded respiratory chain (RC) subunits are too hydrophobic to be synthesized in the cytoplasm, requiring organellar DNA in loco for their expression. According to the “colocation for redox regulation” (CORR) hypothesis (Allen 2003), auxiliary genomes still persist because organellar gene expression must be under direct redox control.
Lane and Martin (2010) pointed out that it was the efficient redistribution of genetic information in eukaryotes (a few bioenergetically specialized genes in the organelles, with most of the information located in the nucleus) made an increase in genome size and complexity possible. Basically, the endosymbiotic event was very advantageous and essential for creating a complex but efficient system of energy production (within organelles), enabling eukaryote genomes to increase their total protein production and complexity, something which was impossible in prokaryotes (Lane and Martin 2010).
In our opinion, all these questions are connected with the role and evolution of the mitochondrial genome in the eukaryotic cell. In order to shed light on this problem, we need to identify the major driving force acting in cellular mtDNA. We focus attention here on the role of drift, purifying, and positive selection on the evolution of mtDNA in Metazoa, a topic regarding which available data are sometimes inconsistent and highly debated.
Purifying Selection in the Mitochondrial Genome
Exactly how the mitochondrial genome evolved has been extensively debated: Some details about how it is inherited and how it changes are shown in box 2.
Box 2.
Inheritance Patterns of Mitochondrial Genomes
Mitochondrial genomes are uniparentally transmitted and, in most cases, female individuals give their mitochondria to zygotes; there are mechanisms which (almost entirely) prevent leakage of paternal cytoplasm in fertilization. In plants and fungi, biparental inheritance has been detected in certain taxa. In Metazoa, mtDNA is maternally inherited: however, in some species belonging to Bivalvia, the paternal mitochondrial genome is transmitted in gonadal tissues and the maternal one is located in the somatic lines (“double uniparental inheritance”). In other groups, paternal leakage is an occasional event (Barr et al. 2005). The main evolutionary consequence of this mode of inheritance is that mitochondrial genetic information is haploid: this means that, for every two copies (one paternal and one maternal) of any nuclear gene, only one copy (from the maternal line) of any mitochondrial gene exists. Another important aspect of mtDNA transmission is the absence of recombination (in Metazoa) at significant levels, although Piganeau et al. (2004) revealed the moderate occurrence of recombination in sexual and, although less so, also in asexual animal species. The extent of this phenomenon is still unclear.
Another important property of mitochondrial genomes in Metazoa is the elevated mutational pressure which affects them. For 30 years (Brown et al. 1979), a rapid accumulation of mutations in mtDNA has been shown. High mutational rates in mtDNA have been associated with an inaccurate DNA repair system (Bogenhagen 1999), the absence of histone-like protein, and the peculiar mitochondrial replication model, characterized by single-strand intermediates, which was found to be a convincing explanation for strand mutational bias (Reyes et al. 1998). In addition, now nearly 40 years ago, Harman (1972) was one of the first to propose that the mitochondrial RC was a major site of ROS production in the cell, and that mitochondrial structures (also DNA molecules) were primary targets for oxidative damage. However, the search for an aging-dependent accumulation of point mutations in mtDNA has given often discordant results. This is probably due to the experimental methods adopted, which can differentially detect low frequency point mutations. In addition, cells which accumulate mutations are prone to apoptosis: Thus, mutation accumulation during the life of an organism may be underestimated.
In the case of mutator mice (Trifunovic et al. 2005), no evidence of increased ROS levels was detected in transgenic mice carrying a defective and error-prone PolG, although the mice had a premature aging phenotype. Again, experimental techniques can influence the detection of ROS species (and ROS levels) in a certain cellular context. Some other factors, such as the effect of antioxidants, are debated in the literature, but go beyond the scope of this paper.
In view of its reduced population size, absence of substantial recombination, and elevated mutational rate, the fate of mtDNA seems to follow Muller's Ratchet consequences (Muller 1964; Felsenstein 1974), which hypothesizes that small populations (just like mtDNA) gradually tend to accumulate slightly deleterious mutations in the absence of a mechanism, like recombination, which could preserve the “wild-type” condition. This inexorable process would lead such populations to higher and higher mutational levels to the point of complete loss of functionality and subsequent extinction of the genome.
The role of purifying selection, necessary for maintaining mitochondrial gene functions, has been clarified in many papers based on in silico analysis, and also by in vivo experiments. Rand and Kann (Rand and Kann 1996; Kann and Rand 1998) used the neutrality index (NI; Rand and Kann 1996) to determine the influence of selection on protein-coding genes in fruit fly and some mammalian species (Mus musculus, Homo sapiens). Data analysis yielded an NI higher than 1, indicating the effect of purifying selection in removing disadvantageous mutations (most amino acid changes are deleterious).
However, the strength of this selection depends on the Ne parameter, that is, true population size, which varies according to species ecology. For instance, Popadin et al. (2007) found an excess of amino acid substitutions in large-bodied mammals as opposed to smaller ones. Body mass was considered a good approximation of Ne: Thus, species with small populations (e.g., elephants, humans) tend to fix more amino acid changes in mitochondrial genes than rodents (large Ne). This problem becomes more obvious in species which have both sexual and asexual populations, as in the crustacean Daphnia pulex, in which the populations adopting asexual reproduction are smaller and more prone to accumulating amino acid changes, whereas sexually reproducing populations are larger and selection is more efficient (reduced accumulation) (Paland and Lynch 2006).
The great efficiency of purifying selection has been documented in vivo by sequence analysis of “mutator” mice (Stewart et al. 2008). Although the error-prone version of their gamma polymerase (PolG) produces high mutational pressure, strong purifying selection removes nonsynonymous deleterious mutations during mtDNA transmission from mother to offspring in the course of only a few generations. The above study reveals how purifying selection contrasts “accelerated” mutational meltdown, preventing the consequences of Muller's Ratchet in mammalian mtDNA. It should be noted that the very strong, very fast purifying selection observed in this experiment was not only the result of selection acting across individuals but also across a lower level of organization (cellular). In fact, neither mortality nor the differential in fertility allowed by the experiment could explain such extensive purging of accumulated mutations, although a different line of research suggests the action of selection across the oocytes of an individual and even across mtDNA copies of single zygotes.
It has been shown in Metazoa that, during germ line development, there is a dramatic reduction in the number of mtDNA copies for each germ cell. Estimates of mtDNA copy number variations during oogenesis and embryogenesis were recently reported by White et al. (2008). During embryogenesis, mtDNA copies from mature oocytes are equally distributed within blastocyst cells; later, a certain proportion of the total amount of mtDNA (some thousands of copies per cell) is destined to the inner cell mass, which will constitute embryos and the remaining mtDNA pool is shared among extraembryonic tissue cells.
However, the above recent analysis indicates that primordial germ cells within the embryo contain only a few dozen mtDNA molecules, signaling a dramatic reduction in the mtDNA population. mtDNA replication starts again during oogenesis, with the development of primary oocytes: In terms of copy number, mtDNA expansion continues until oocyte maturation. Mature mouse oocytes have been estimated to contain up to 200,000 mtDNA molecules (White et al. 2008).
There are several hypotheses about what the mitochondrial genetic bottleneck is exactly and what evolutionary force causes it. In mouse, the process was found to be random, in which many mtDNA molecules are discarded and only a few are transmitted to primordial germ cells (Jenuth et al. 1996).
The scientific community is increasingly interested in the possible selective nature of the genetic bottleneck. Krakauer and Mira (1999) considered cellular atresia as a possible response to Muller's Ratchet, particularly in birds and mammals. In their view, only a very small number of all primordial follicles (and the primary oocytes inside them) reach maturation during the first stages of fetal life; the others undergo apoptosis. In this way, germ cells carrying “less functional” mitochondrial genomes are removed. In particular, species which produce small numbers of offspring tend to undergo a more severe bottleneck event, in order to guarantee the survival and viability of the (few) members of the future generation. Zhou et al. (2010) believe that selective bottleneck occurs in the maturation of oocytes. They hypothesize a role played by the mitochondrial cloud (MC), a particular cytoplasmic region which contains RNA, organelles, and proteins and is later specifically transferred to the primordial germ cells of the future embryo. The above authors present some biochemical assays (based on estimates of the mitochondrial inner membrane potential of mature zebra fish oocytes), showing how the MC possesses the most efficient mitochondria.
Although these mechanisms have been described in several organisms—for example, MC structures have been observed in Danio rerio, Xenopus laevis, M. musculus, and Drosophila melanogaster—precise clarifications are still needed. Indeed, selection operating on intraindividual mtDNA (at the level of oogenesis or fulliculogenesis) needs to be supported by more precise physiological tests, which should consider a wider range of biochemical parameters (such as membrane potential variations). This would be very important for better understanding of the transmission of mitochondrial diseases in the light of improved artificial reproductive techniques (Poulton et al. 2010).
These putative internal selection mechanisms do exist (Stewart et al. 2008) but are far from being faultless, as human mitochondrial diseases clearly demonstrate. These are caused partly by mitonuclear interactions which may mask the effect of deleterious mutations (for a deeper discussion, see below Positive Selection of Mitochondrial Genomes). Conversely, the “internal quality control” of mtDNA takes place in specific physiological conditions (maturation of oocytes) and does not act in all possible situations of energy requirements of the organism (embryo, fetus, adult, restricted diet, cold environment, etc.). Energy demands do differ and are contradictory, imposing specific “trade-offs” for each functional state of the OXPHOS (oxidative phosphorylation) machinery (Das 2006).
Positive Selection of Mitochondrial Genomes
Evidence of positive selection has been reported by Bazin et al. (2006) in NI estimates of insect and vertebrate mitochondrial genes. Positive selection appears to be rampant in insects (species with large Ne), which have NI indexes well below 1, and mitochondrial genetic diversity was found to be independent of Ne. The results of Bazin et al. gave rise to extensive debate: Some authors criticized the manipulation and interpretation of the data (e.g., Meikeljohn et al. 2007); others are still convinced of the usefulness of the mtDNA for demography and conservation studies, even with draft (Mulligan et al. 2006; Berry 2006).
da Fonseca et al. (2008) explored the possibility of adaptive evolution in 12 of 13 mitochondrial RC subunits in 40 mammalian species. By detecting radical amino acid changes (i.e., changes between two amino acids with differing chemical and physical properties) and their functional role in predicted 3D structures, the above authors proposed a correlation between the physiological consequences of those changes and some life cycle traits in the species examined.
Further studies have shed light on the possible role of mtDNA in adapting to new environments. Ballard et al. (2007) demonstrated the role of amino acid polymorphisms in the three cytochrome oxidase (CO) mitochondrial subunits between sympatric populations of Drosophila simulans, a pan-African species. Fly populations with a particular mtDNA haplotype were found to be more tolerant to cold and could even colonize temperate regions, whereas others lived prevalently in loco. Nuclear CO genes did not show any trace of such a population division. Adaptation of human mtDNA to changes in climatic conditions has been shown by Balloux et al. (2009). Two nonsynonymous substitutions in genes ATP6 and ND3 turned out to be significantly associated with indigenous populations living in cold regions. The ancestral alleles were found to be located in Africa and in warm regions very recently colonized by humans, although no neutral population markers from nDNA were significantly associated with decreasing temperature. In a large-scale human mtDNA sequence analysis, Ruiz-Pesini et al. (2004) showed that some human haplotypes are good candidates for adaptation to colder environments (less efficient cell respiration, more heat production, more tolerance to starvation) with respect to those more frequently found in warmer regions. Again, these interesting hypotheses must be confirmed by physiological tests.
Coevolution studies on nuclear and mtDNA provide further information on this topic. As shown in box 1, the mammalian nuclear genome encodes for about 80 subunits of the RC complexes: They interact with each other and with mitochondrial subunits, enabling correct assembly of the RC. Thus, different mitochondrial phenotypes derive from different cytogenotypes, that is, varying allele combinations between diploid nuclear OXPHOS and haploid mitochondrial genes.
Coevolution between nDNA and mtDNA may occur by means of a two-step procedure: According to this hypothesis, the faster evolutionary genome (mtDNA) drives the slower one to fix mutations in such a way that mitochondrial functions are guaranteed. Even in the case of negatively selected mitochondrial mutations, other mutations may occur in interacting sites located in the same protein or in another interacting one (both mitochondrial and nuclear encoded). These secondary mutations are “compensatory” in a way that restores the functionality of the mutated protein domain, thus facilitating its normal activity. Coevolution also implies interplay between the evolutionary dynamics of interacting genes: In the case of OXPHOS, this coevolution involves cooperation between entire genomes (Rand et al. 2004).
An interesting view of coevolving sites in RC subunits is provided by Schmidt et al. (2001) and Azevedo et al. (2009). The former authors studied the evolution of interacting amino acid residues among CO nuclear and mitochondrial subunits in several mammalian species. They generated a model in which mitochondrial interacting surfaces were fast evolving with respect to non-interacting parts, with the aim of exploring new possibilities of optimizing interactions; the nuclear counterparts are slow evolving (with respect to the rest of the protein) in order to “respond” to mitochondrial novelties. The latter authors, after detecting various mutant and compensatory sites in mammalian mitochondrial OXPHOS subunits by in-depth structural analysis, presented two possible scenarios of coevolution in mtDNA: The quasi-simultaneous occurrence of deleterious amino acid changes and compensatory mutations or the occurrence of a deleterious mutation in a genetic environment characterized by a preexisting compensatory background. This may be the case of a homoplasmic mitochondrial transfer RNA (tRNA)Val gene mutation which has caused severe pathologic phenotypes in several human individuals but not in their mothers, who probably possess a compensatory nuclear genetic background (McFarland et al. 2002).
A promising line of research on nuclear DNA–mtDNA coevolution comes from biochemical tests on hybrid organisms, characterized by diverging nuclear–mitochondrial genetic backgrounds. In marine copepods (Tigriopus californicus), coevolution seems to be very intense: Functional assays of hybrids derived from several geographically separated populations show that cell respiration is considerably altered (Rawson and Burton 2002). In addition, copepod populations may evolve in order to optimize mitonuclear genetic interactions and, when back crossed, the new cytonuclear genotypes are incapable of guaranteeing efficient OXPHOS. Kenyon and Moraes (1997) and Barrientos et al. (1998) carried out physiological tests on xenomitochondrial cybrids (i.e., cell lines with a human nuclear background and extraspecific mitochondria) and confirmed the importance of coevolution, revealing the increase in evolutionary divergence among primate species. Human–primate cybrids can perform respiration, although mitochondrial functionality is partially compromised: Analyzing the functional consequences on each “hybrid” complex, the above authors found that Complex I activity is defective, whereas other hybrid RC complexes appear to have normal activity. In mouse cell lines, a near-linear relationship between mitochondrial dysfunction and divergence among various murid species (M. musculus, Mus spretus, etc.) is observed in cybrids: This dysfunction is not observed in Complex II activity, which is entirely encoded by the nucleus (McKenzie et al. 2003). However, the Drosophilids remain the favorite phylogenetic group in which to study gene and genome interactions because programmed crossings and fitness assays are possible relatively quickly and cheaply. For example, Sackton et al. (2003) showed the disruption effect on CO activity when lines of D. simulans and Drosophila mauritiana were crossed together; the causes of incompatibilities were attributed to nuclear loci.
General ideas can be extrapolated from the literature presented. Selection operates on a single unit, given by the interaction of all the nuclear and mitochondrial encoded OXPHOS subunits. Each subunit may tolerate mutations differentially because of the mutation position, protein function, and presence of compensatory mutations in other sites. mtDNA gene evolutionary rates, being lineage specific, may drive OXPHOS nuclear genes to coevolve closely in some lineages (as in copepod populational hybrids) rather than others (as cited in Montooth et al. 2010). In conclusion, the probability of mitonuclear coadaptation depends on standing variation, modulated by mutational rates, and intensity of purifying selection.
Close coevolution contributes toward exacerbating functional incompatibilities between diverging backgrounds. This is the view of Gershoni et al. (2009) who believe that mitonuclear coadaptation and incompatibilities may lead to speciation.
Variations in Mutational Input
A large body of literature shows that mtDNAs are characterized by high mutational pressure. Some years ago, we examined the evolutionary properties of mtDNAs in metazoans, focusing on the asymmetrical mutational pressure occurring in mitochondrial genes.
In 1998, our group explored the mutational pressure occurring in mammalian mtDNAs, showing that base composition is asymmetrical between the two strands and along the genome (Reyes et al. 1998). Asymmetry (or “bias”) between base pairs was practically evaluated by the GC and AT skew indexes (Perna and Kocher 1995), where GC skew = (G − C)/tot(GC) and AT skew = (A − T)/tot(AT). Reyes et al. (1998) presented a model in which mammalian mtDNA compositional bias was positively correlated with the duration time of the single-strand state of H strand genes. The more a mitochondrial gene persists in an impaired state (i.e., the complementary strand is displaced), the longer the time of exposure to mutation (e.g., spontaneous cytosine deamination and conversion in uracil). According to this view, the molecular basis of the difference of base composition between mtDNA strands is caused by the replication system of this genome.
Today, accumulating genome sequence data depict a scenario in which the compositional properties of metazoan mtDNAs are quite variable: Arthropoda have the lowest GC content and Chordata are the most GC-rich group (in particular, birds). When analysis is extended to several animal phyla (see table 2), GC skew is significant in most of the groups, whereas AT asymmetry is generally less pronounced, with the sole exception of flatworms (Platyhelminthes). The directionality of these compositional asymmetries is also variable: In most groups, GC skew is negative (i.e., G is preferentially located in the minor coding strand), AT skew is positive (i.e., more A in H strand, more T in L strand). Again, Platyhelminthes shows the precisely opposite behavior: Skews are remarkably high, but indices are positive for the AT pair and negative for the GC one. In some taxa, such as molluscs, echinoderms, and arachnids, the indices show great within-group variability and their mean compositional skews are close to 0.
Table 2.
Compositional Properties of Most Frequently Sampled Metazoan Phyla
| Group | Number of Collected Genomes | GC Mean | GC Min | GC Max | GC Skew | AT Skew |
| Annelida | 13 | 34.95 | 27.82 | 44.57 | −0.45 | −0.06 |
| Arthropoda, Arachnida | 41 | 27.87 | 15.73 | 36.8 | −0.09 | −0.01 |
| Arthropoda, Insecta | 193 | 23.64 | 12.59 | 37.6 | −0.18 | +0.06 |
| Chordata, Actinopterygii | 612 | 44.89 | 36.82 | 53.22 | −0.25 | +0.04 |
| Chordata, Amphibia | 155 | 37.45 | 30.92 | 45.1 | −0.25 | +0.04 |
| Chordata, Aves | 110 | 45.4 | 42.3 | 49.51 | −0.38 | +0.12 |
| Chordata, Mammalia | 312 | 40.13 | 30.9 | 45.94 | −0.32 | +0.09 |
| Chordata, Squamata | 101 | 40.82 | 35.43 | 48.46 | −0.35 | +0.12 |
| Chordata, Testudines | 30 | 38.83 | 37.29 | 41.52 | −0.35 | +0.13 |
| Cnidaria | 36 | 35.39 | 22.43 | 49.76 | +0.17 | −0.16 |
| Echinodermata | 22 | 38.18 | 26.74 | 43.66 | −0.04 | −0.1 |
| Mollusca | 75 | 34.02 | 21.88 | 44.98 | +0.04 | −0.08 |
| Platyhelminthes | 32 | 32.39 | 25.95 | 48.31 | +0.39 | −0.32 |
| Porifera | 29 | 34.76 | 27.97 | 43.98 | −0.05 | 0.16 |
Note.—Data have been downloaded from Mitozoa database vrs. 6 (Lupi et al. 2010) and contain reference and nonreference complete mtDNA sequences.
Again in the late 1990s, we focused attention on substitution rates within mammalian mitochondrial genomes (Pesole et al. 1999). They were found to be gene specific: nonsynonymous sites of protein-coding genes and large rRNA genes turned out to be slow-evolving, whereas synonymous sites, small and tRNA genes, and the D-loop (excluding the conserved Central Domain) were classified as fast-evolving sites. As shown in table 3, when compared with nuclear analogues, synonymous mitochondrial sites and Small rRNA genes evolve 20 times faster and mitochondrial tRNA genes up to 100 times faster. This difference in rate probably reflects the different functional constraints affecting mitochondrial genomes.
Table 3.
Sequence Divergence (% Substitutions/Site) Calculated for Specific mtDNA Sites and their Nuclear Analogues (from Pesole et al. 1999)
| Species Pair | Type of Site | mtDNA Divergence | Nuclear DNA Divergence | mtDNA/nDNA Ratio |
| Homo sapiens versus Pan troglodytes | Synonymous | 34.6 ± 3.9 | 1.6 ± 0.9 | 22 |
| Non synonymous | 2.6 ± 0.4 | 0.8 ± 0.2 | 3 | |
| Rattus norvegicus versus Mus musculus | Small rRNA | 7.7 ± 2.4 | 0.4 ± 0.3 | 19 |
| Large rRNA | 17.2 ± 3.8 | 4.1 ± 0.8 | 4 | |
| tRNAs | 9.7 ± 2.4 | 0.1 ± 0.1 | 97 |
More recently, we decided to examine the relative effect of mutation and selection in the evolution of metazoan mitochondrial genomes according to two different approaches, studying codon usage and the synonymous/nonsynonymous substitution rates of the 13 mitochondrial protein–coding genes.
Apart from its great influence on nonsynonymous variability, purifying selection has also been demonstrated to affect synonymous variability in prokaryotic and eukaryotic genomes. According to the “efficiency” hypothesis (Bulmer 1991), in highly expressed genes, synonymous codon usage (SCU) evolved in order to recognize the most abundant isoacceptor tRNAs, guaranteeing efficient translation. Akashi (1994) presented a model (the “accuracy hypothesis”), in which genes tended to use the most efficient codons (within a certain codon family) in the tRNA anticodon recognition process. This would prevent the incorporation of the wrong amino acids during translation and the consequent production of cytotoxic misfolded proteins (see fig. 1).
FIG. 1.—

Effects of wrong tRNA anticodon–mRNA codon association on protein translation. (A) Canonical translation of protein (yellow polygon): Optimal codon (yellow vertical bars) efficiently recognizes tRNA (in yellow) with correct amino acid (yellow circle). Right polypeptide is produced (yellow stripe) and properly folded (yellow polygon). (B) Codon is not optimal (yellow vertical bars plus red bar); then wrong tRNA (in red) can be recruited; an uncorrected amino acid (red cross) is inserted in nascent polypeptide (chain in yellow and gray). A misfolded protein is produced (gray and red polygon) and may undergo degradation (in gray) but, if it does not, it can interact with cell structures.
Drummond and Wilke (2008) supported the accuracy hypothesis by finding a positive correlation between nonsynonymous and synonymous variability in genomes of several model organisms, from Escherichia coli to nuclear H. sapiens. The effect of selection on SCU was found to be more intense for highly expressed genes and for tissues which are believed to be more susceptible to protein misfolding. Thus, this kind of selection, called Mistranslation-Induced protein Misfolding (MIM), is a genome-wide constraint for coding sequence evolution in both prokaryotic and eukaryotic domains. In view of the extreme economy of the mitochondrial translational process (a single tRNA recognizes an entire codon family), we do not expect the “efficiency hypothesis” to occur in mitochondrial genes. In the search for support for the accuracy hypothesis, Jia and Higgs (2008) demonstrated that mitochondrial SCU in mammals and fish is caused by the significant contribution of mutational input, with a certain effect of base composition in the close proximity of synonymous sites.
Thus, at first, we decided to evaluate the contribution of mutation and nonmutational factors in shaping synonymous variability by using classical codon usage indexes. In a large genomic data set, consisting of 138 reference genome sequences for the class Insecta and 1173 for the subphylum Vertebrata (see table 4), we calculated a codon usage bias index, the “effective number of codons” or “ENC” (Wright 1990) and the “mutational” ENC (or “expected” ENC), according to the base composition of the third codon positions of 4-fold degenerate codon families (“quartets”). Codons were counted with script based on the Biopython library (Cock et al. 2009), and subsequent calculations were performed in R with SV script.
Table 4.
Taxonomic Description of Insect and Vertebrate Genomic Data Set
| Group | Number of Collected Genomes | Subgroupa | Number of Genomes by Order |
| Insecta | 138 | Coleoptera | 16 |
| Diptera | 26 | ||
| Hemiptera | 28 | ||
| Hymenoptera | 9 | ||
| Lepidoptera | 14 | ||
| Orthoptera | 18 | ||
| Other orders | 24 | ||
| Vertebrata | 1173 | Actinopterygii | 560 |
| Amphibia | 85 | ||
| Aves | 100 | ||
| Mammalia | 288 | ||
| Reptilia | 122 | ||
| Other classes | 17 |
Note.—Table describes classification for the 138 and 1173 insect and vertebrate genomes (respectively) for which codon usage analysis has been performed (for details, see text).
For insects, subgroup = order; for vertebrates, subgroup = class.
The ENC gives a measure of SCU preferentiality and ranges from 20 (only one codon is used for a given amino acid) to 60 (all encoding codons are used). The ENC index is not based on knowledge of which codons are optimal (i.e., the codons used in highly expressed genes), and this is an advantage for the genetic context we studied (mtDNA), in which there are no sufficiently clear and complete gene expression data available. Mutational ENC may be considered as the codon usage preferentiality which would occur in mtDNAs if mutational pressure were the sole evolutionary force governing such preferentiality. The mutational ENC index was calculated on quartets (encoding for Val, Ala, Pro, Thr, Arg, and Gly amino acids in vertebrate and insect mitochondrial genetic codes) because the corresponding third positions are presumed to be the freest evolving sites in protein-coding genes.
We analyzed ENC variability for the 13 genes of each genome, evaluating the significance of the contribution of the following predictors: “Species” (138 and 1173 for insects and vertebrates, respectively); “Gene” (the 13 mitochondrial genes, although seven species have no canonical gene content); “Position” (the middle gene position from the major coding replication origin, normalized for genome length); “Strand”; and “mutational ENC.” We used linear modeling to find that mutation (as exemplified by the mutational ENC) greatly contributes to ENC variability, incorporating the contribution of the Position and Strand predictors. However, a significant part (about 15% in both groups) is associated with the nonmutational factors Gene and Species, whereas 25% and 35% of ENC variability (insect and vertebrate data sets, respectively) remain unexplained.
We then decided to study codon usage bias by directly observing 4-fold degenerate codon frequencies, gene by gene and genome by genome. This enabled us to overcome the limitations of an index-based approach, which compresses multidimensional codon usage variability into a 1D parameter and suffers in cases of poorly represented amino acid families and short genes. At first, we considered base composition on the third codon positions of the Val, Ala, Pro, Thr, Arg, and Gly codon families. We assumed that base frequencies were uniform along each genome (the simplex model, with only 4 free parameters, corresponding to the 4 base frequencies) or, alternatively, different from gene to gene (the most complex model, with 13 × 4 parameters). The likelihood function of the most complex model “M” was calculated as follows:
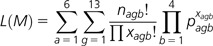 |
where “x” is the count for each of the four “b” codons of the “a” codon family within the “g” gene and “n” is the total count within each family of each gene. Nested models share parameters across categories. The observed frequency of codons within each defined group was used as the maximum likelihood estimator for the parameters “p,” as already shown by Jia and Higgs (2008). The whole procedure was implemented in R (R Development Core Team 2011).
The Likelihood Ratio Test was used to find that base composition was gene specific for all the genomes in question. Regarding SCU, we evaluated whether it was uniform along the genome (the simplest model, with 4 parameters), different from gene to gene (52 parameters), or dependent on the mean genomic use of each synonymous codon (6 × 4 parameters, where 6 refers to the six codon families considered). All these models were compared with the saturated likelihood model with 13 × 6 × 4 parameters, in which each synonymous codon has its own occurrence probability. The second model aimed at demonstrating the role of gene-specific mutational input in shaping SCU and the third was based on the consideration that synonymous codon frequencies could be determined by their optimality in the translation process (and, because of this, they would be uniform among the genes).
We found that the simple codon usage model was rejected with respect to the saturated model. Using Bonferroni sequential correction for multiple testing, we evaluated in which species simple models were rejected (species influencing the results of global likelihood comparisons). In particular, in only 20 of 138 insect species (20%) and 469 of 1173 vertebrate species (40%) was the hypothesis that gene-specific mutational input is the sole evolutionary force governing codon usage bias rejected.
Several considerations may be derived from these data. They confirm that base composition along the genome is not uniform; the molecular mechanism which causes this bias may be the asymmetrical replication of vertebrate and insect mtDNAs (Berk and Clayton 1974; Goddard and Wolstenholme 1978), which would give rise to a different probability of acquiring mutations (Reyes et al. 1998). SCU is thus prevalently determined by gene-specific base composition, but a certain selective effect on it may coexist. In this case, it would be very difficult to detect because it may be very subtle (occurring only in certain genes or codon families) or go in the same direction of mutation (i.e., the optimal codon for translation is the same one preferred by mutational input).
In our second approach, we tried to verify the existence of selection on SCU, considering the relationship between two nucleotide substitution rates: nonsynonymous, related to nonsynonymous (amino acid change) variability and synonymous, due to “silent” synonymous codon sites. We emulated the approach of Drummond and Wilke (2008): Regression analysis between these two estimates enabled us to evaluate the presence of selection in our second genomic data set. This was built by collecting about 350 complete genomes belonging to 45 vertebrate genera, for which at least 4 complete mtDNAs (belonging to at least two different cogeneric species) were available in the public databases (see table 5).
Table 5.
Taxonomic Description of Second Vertebrate Mitochondrial Genomic Data set
| Number of Different Genomes | Class | Number of Genera by Class | Number of Species by Class |
| 347 | Actinopterygii | 18 | 108 |
| Amphibia | 7 | 54 | |
| Aves | 2 | 7 | |
| Mammalia | 14 | 36 | |
| Reptilia | 4 | 20 |
Note.—Table describes taxonomic classification for the second vertebrate genomic data set, used to estimate gene-specific nonsynonymous and synonymous substitution rates (for details, see text).
With respect to the first data set, the second one did not consist solely of reference sequences and was checked for the presence of appropriate annotations. We decided to focus on genus level in order to expand our investigation as much as possible. However, at species level, only very few vertebrate species have a large number of complete published mtDNAs (including H. sapiens, M. musculus, Canis domesticus, Rattus norvegicus, and Bos taurus) with which inferences can be made.
We extracted nucleotide FASTA sequences for all 350 × 13 genes and made nucleotide multialignments with protein multialignments as guides. We then inferred phylogenetic relationships among gene sequences with each multialignment by Bayesian analysis: Consensus tree topologies served as input for subsequent parameter calculation. That is, we calculated nonsynonymous and synonymous substitution rates (log dn, log ds) for the 45 × 13 gene alignments which were constructed by the Codeml program (PAML Package; Yang 2007). We imposed a single dn/ds ratio (ω, omega) for each gene multialignment, hypothesizing that selective processes were constant along each gene tree; lastly, we obtained about 550 dn, ds, and ω estimates.
In linear model analysis, synonymous variability was set as the dependent variable because we considered the selection which would eventually operate on it as a minor component of the purifying selection which affects whole gene sequences. The model which best fitted our data (goodness of fit = 0.87) was
 |
in which 0.03 is the slope value (P value = 0.058) and Ki the intercept for group “i” (1 < i < 45). Table 6 lists some details about this relationship.
Table 6.
Relationship among log ds and the log dn and Genus Predictors
| Response | Slope | Predictor | Intercept | P Value | Genus |
| log ds | 0.03 P value = 0.058 | log dn | 0.89 | 2.98 × 10⁻¹⁵ | Acheilognathus |
| 0.69 | <2 × 10⁻¹⁶ | Acipenser | |||
| — | — | — | |||
| −0.2 | 1.53 × 10⁻¹⁴ | Ursus | |||
| Goodness of fit of the model | 0.87 | ||||
Note.—Logarithmic synonymous and nonsynonymous substitution rates were calculated for genes belonging to the second genomic data set (table 5). According this linear model (log ds ∼ log dn + Genus, described in the text), slope is near 0. Intercept values (fourth column) are significantly different among genera (P values near 0, fifth column). Horizontal lines represent genus-specific intercepts and P values for the remaining 42 genera.
The categorical predictor “genera” has a significant addictive effect on the dependent variable (linear model intercepts are significantly different from genus to genus). The ω parameter established the role of positive and negative selection affecting gene sequences: An estimate of dn higher than that for ds means that nonsynonymous mutations are fixed at a higher rate than synonymous ones and that positive selection is at work. When ω is less than 1, purifying selection is evidenced, whereas neutral evolution affects the sequence in the case of ω = 1.
In our data set, we showed the great influence of purifying selection on all mitochondrial genes (log ω well below 0). CO and cytochrome b genes revealed the most efficient selection, although this was more relaxed for ATP synthase and some NADH dehydrogenase complex genes (see fig. 2).
FIG. 2.—

Log ω estimates for vertebrate genome data set (see text and table 5), divided by 13 mitochondrial genes. Horizontal black lines: mean values; black points: outliers. Genes encoding for proteins of same RC complex grouped together by black horizontal lines. Horizontal dotted line: threshold by which positive or negative selection affecting sequences can be determined.
In particular, the gene order obtained by log ω mean values was CO1 < CO2 < CO3 < CYTB ≪ ND1 < ND5 < ATP6, ND2, ND3, ND4, ND4L, ND6 < ATP8.
Synonymous variation estimates were quite uniform among the 13 genes: Gene-specific log ds values ranged within four orders of magnitude for all groups. Nonsynonymous variability estimates were in fact responsible for the significantly different ω values among the mitochondrial genes. Thus, the dn parameter turns out to be a good proxy for selection efficiency in mitochondrial vertebrate genes.
Concluding Summary
Our results clearly consolidate a scenario in which mutation and drift govern synonymous changes in mitochondrial protein–coding genes, while gene function is strongly preserved by purifying selection. It efficiently removes mutations which cause amino acid changes in mitochondrial RC subunits possessing crucial functions, such as CO1, CO2, CO3, CYTB (see box 1). Thus, the mitochondrial genome is not characterized by purifying selection on SCU, in contrast to the nuclear one. Protein misfolding, perhaps caused by inefficient codon versus anticodon recognition (according to the accuracy hypothesis), is probably not a major problem in organelles.
This scenario indirectly supports the idea of the role of mtDNA in organism adaptation. We would like to argue that mutational load, that is, decrease in fitness due to mutation, at individual level is much lower in mtDNA than in nuclear DNA. We have already stated (see Pesole et al. 1999) that mutational rates are estimated to be higher in mtDNA than in the nuclear locus, and this apparently indicates that mutational load is higher in mtDNA. However, in the same work, we showed that this discrepancy is caused only by synonymous sites, whereas nonsynonymous variation is comparable between the two genomes. We also show here that synonymous variation cannot affect fitness, as in the case of the nucleus, greatly reducing the possible appearance of slightly deleterious mutations. In addition, intraindividual selection, probably due to atresia and the MC, purges nonsynonymous deleterious mutations without evolutionary cost for the individual. This makes the mitochondrion a very efficient engine for evolution, dedicated to a small but key set of genes connected with energy production. It is still unclear whether this purging mechanism can also detect slightly deleterious mutations but, if so, we should expect that, in a given population, there would be fewer segregating deleterious mutations in the mtDNA than in an equivalent portion of the nuclear genome. This would mean that a proportion of standing polymorphisms (greater than the proportion in the nucleus) would have the opportunity to go to fixation because they are beneficial, slightly beneficial, or neutral. This pattern could probably be distinguished from that caused by “hitch-hiking events” by the fact that the decrease would only affect the deleterious mutation. The dn/ds estimator is generally used to evaluate and compare the strength of selection. This is in fact the statistic according to which the common view that mutational load is higher in mtDNA is based (Neiman and Taylor 2009 and Lynch and Blanchard 1998 therein). We believe that a straight comparison of dn/ds between nucleus and mitochondria would be misleading, due to the different dynamics of ds and dn in the two compartments. Synonymous changes are truly neutral only in mtDNA, whereas nonsynonymous changes in mtDNA, when they appear in a population, have very probably already passed some kind of “quality control.” It is therefore not surprising that a greater proportion of nonsynonymous mutations than in the nucleus would be accepted. For this reason, we propose comparing more systematically absolute rates of dn in mtDNA versus nuclear DNA and expect, as found in mammals (Pesole et al. 1999; Saccone et al. 1999), to find very few differences.
This higher efficiency in exploring mutational space would allow mtDNA to adapt fast: Consequently, the well-known bigenomic cooperation for the OXPHOS function should work, the adaptation appearing first in mtDNA and then in the nuclear genome.
In order to verify the population consequences of intraindividual purifying selection, population genetic data in nucleus and mtDNA must be compared with the same set of individuals. This kind of data is already very rare. But in order to distinguish among the different coevolutionary scenarios, the nuclear data must include the nuclear OXPHOS genes, and this has not yet been done. The HAPMAP project (International HapMap Consortium 2003) may have been one opportunity, but unfortunately none of the 5,000 and more individuals for which complete mitochondrial genome information was obtained was used in this project.
Acknowledgments
We would like to thank Giorgio Bernardi for the invitation to the Ravello Meeting that spun the writing of this article, the editor and the two anonymous reviewers that give us very constructive comments. We would like to thanks Giacinto Donvito (Istituto Nazionale di Fisica Nucleare) for the access to the computing grid necessary for the evolutionary parameters estimation presented in this article. The funding for this work came from the Italian Ministry of Research (LIBI project) and the Doctoral School of Genetics and Molecular Evolution of the University of Bari “Aldo Moro.”
References
- Adams KL, Palmer JD. Evolution of mitochondrial gene content: gene loss and transfer to the nucleus. Mol Phylogenet Evol. 2003;29(3):380–395. doi: 10.1016/s1055-7903(03)00194-5. [DOI] [PubMed] [Google Scholar]
- Akashi H. Synonymous codon usage in Drosophila melanogaster: natural selection and translational accuracy. Genetics. 1994;136:927–935. doi: 10.1093/genetics/136.3.927. [DOI] [PMC free article] [PubMed] [Google Scholar]
- Allen JF. The function of genomes in bioenergetic organelles. Philos Trans R Soc Lond B Biol Sci. 2003;358(1429):19–37. doi: 10.1098/rstb.2002.1191. ; discussion. 37–38. [DOI] [PMC free article] [PubMed] [Google Scholar]
- Anderson S, et al. Sequence and organization of the human mitochondrial genome. Nature. 1981;290:457–465. doi: 10.1038/290457a0. [DOI] [PubMed] [Google Scholar]
- Azevedo L, et al. Epistatic interactions modulate the evolution of mammalian mitochondrial respiratory complex components. BMC Genomics. 2009;13(10):266. doi: 10.1186/1471-2164-10-266. [DOI] [PMC free article] [PubMed] [Google Scholar]
- Ballard JW, Melvin RG, Katewa SD, Maas K. Mitochondrial DNA variation is associated with measurable differences in life-history traits and mitochondrial metabolism in Drosophila simulans. Evolution. 2007;61:1735–1747. doi: 10.1111/j.1558-5646.2007.00133.x. [DOI] [PubMed] [Google Scholar]
- Balloux F, Handley LJ, Jombart T, Liu H, Manica A. Climate shaped the worldwide distribution of human mitochondrial DNA sequence variation. Proc Biol Sci. 2009;276:3447–3455. doi: 10.1098/rspb.2009.0752. [DOI] [PMC free article] [PubMed] [Google Scholar]
- Barr CM, Neiman M, Taylor DR. Inheritance and recombination of mitochondrial genomes in plants, fungi and animals. New Phytol. 2005;168(1):39–50. doi: 10.1111/j.1469-8137.2005.01492.x. [DOI] [PubMed] [Google Scholar]
- Barrientos A, Kenyon L, Moraes CT. Human xenomitochondrial cybrids. Cellular models of mitochondrial complex I deficiency. J Biol Chem. 1998;273(23):14210–14217. doi: 10.1074/jbc.273.23.14210. [DOI] [PubMed] [Google Scholar]
- Bazin E, Glémin S, Galtier N. Population size does not influence mitochondrial genetic diversity in animals. Science. 2006;312:570–572. doi: 10.1126/science.1122033. [DOI] [PubMed] [Google Scholar]
- Berk AJ, Clayton DA. Mechanism of mitochondrial DNA replication in mouse L-cells: asynchronous replication of strands, segregation of circular daughter molecules, aspects of topology and turnover of an initiation sequence. J Mol Biol. 1974;86:801–824. doi: 10.1016/0022-2836(74)90355-6. [DOI] [PubMed] [Google Scholar]
- Berry OF. Mitochondrial DNA and population size. Science. 2006;314:1388. doi: 10.1126/science.314.5804.1388. [DOI] [PubMed] [Google Scholar]
- Bibb MJ, Van Etten RA, Wright CT, Walberg MW, Clayton DA. Sequence and gene organization of mouse mitochondrial DNA. Cell. 1981;26:167–180. doi: 10.1016/0092-8674(81)90300-7. [DOI] [PubMed] [Google Scholar]
- Bogenhagen DF. DNA repair '99: repair of mtDNA in Vertebrates. Am J Hum Genet. 1999;64:1276–1281. doi: 10.1086/302392. [DOI] [PMC free article] [PubMed] [Google Scholar]
- Bogenhagen DF, Clayton DA. The number of mitochondrial DNA genomes in mouse L- and human HeLa cells: quantitative isolation of mitochondrial DNA. J Biol Chem. 1974;249:7991–7995. [PubMed] [Google Scholar]
- Brown WM, George M, Jr, Wilson AC. Rapid evolution of animal mitochondrial DNA. Proc Natl Acad Sci U S A. 1979;76(4):1967–1971. doi: 10.1073/pnas.76.4.1967. [DOI] [PMC free article] [PubMed] [Google Scholar]
- Bulmer M. The selection-mutation-drift theory of synonymous codon usage. Genetics. 1991;129:897–907. doi: 10.1093/genetics/129.3.897. [DOI] [PMC free article] [PubMed] [Google Scholar]
- Chang AC, Lansman RA, Clayton DA, Cohen SN. Studies of mouse mitochondrial DNA in Escherichia coli: structure and function of the eucaryotic-procaryotic chimeric plasmids. Cell. 1975;6(2):231–244. doi: 10.1016/0092-8674(75)90014-8. [DOI] [PubMed] [Google Scholar]
- Chevremont M. Notions de cytologie et histologie. In: Desoer, editor. Desoer Liege (Belgium)[43987]: 1960. [Google Scholar]
- Chiba Y. Cytochemical studies on chloroplasts. I. Cytologic demonstration of nucleic acids in chloroplasts. Cytologia. 1951;16:259–264. [Google Scholar]
- Clayton DA, Vinograd J. Circular dimer and catenate forms of mitochondrial DNA in human leukaemic leucocytes. Nature. 1967;216:652–657. doi: 10.1038/216652a0. [DOI] [PubMed] [Google Scholar]
- Cock PJ, et al. Biopython: freely available Python tools for computational molecular biology and bioinformatics. Bioinformatics. 2009;25(11):1422–1423. doi: 10.1093/bioinformatics/btp163. [DOI] [PMC free article] [PubMed] [Google Scholar]
- da Fonseca RR, Johnson WE, O'Brien SJ, Ramos MJ, Antunes A. The adaptive evolution of the mammalian mitochondrial genome. BMC Genomics. 2008;4(9):119. doi: 10.1186/1471-2164-9-119. [DOI] [PMC free article] [PubMed] [Google Scholar]
- Das J. The role of mitochondrial respiration in physiological and evolutionary adaptation. Bioessays. 2006;28:890–901. doi: 10.1002/bies.20463. [DOI] [PubMed] [Google Scholar]
- de Grey ADNJ. Forces maintaining organellar genomes: is any as strong as genetic code disparity or hydrophobicity? Bioessays. 2005;27(4):436–446. doi: 10.1002/bies.20209. [DOI] [PubMed] [Google Scholar]
- Drummond DA, Wilke CO. Mistranslation-induced protein misfolding as a dominant constraint on coding-sequence evolution. Cell. 2008;134:341–352. doi: 10.1016/j.cell.2008.05.042. [DOI] [PMC free article] [PubMed] [Google Scholar]
- Embley TM, Martin W. Eukaryotic evolution, changes and challenges. Nature. 2006;440(7084):623–630. doi: 10.1038/nature04546. [DOI] [PubMed] [Google Scholar]
- Ephrussi B, Slonimski PP. Yeast mitochondria: subcellular units involved in the synthesis of respiratory enzymes in yeast. Nature. 1955;176:1207–1208. doi: 10.1038/1761207b0. [DOI] [PubMed] [Google Scholar]
- Felsenstein J. The evolutionary advantage of recombination. Genetics. 1974;78:737–756. doi: 10.1093/genetics/78.2.737. [DOI] [PMC free article] [PubMed] [Google Scholar]
- Gershoni M, Templeton AR, Mishmar D. Mitochondrial bioenergetics as a major motive force of speciation. Bioessays. 2009;13:642–650. doi: 10.1002/bies.200800139. [DOI] [PubMed] [Google Scholar]
- Goddard JM, Wolstenholme DR. Origin and direction of replication in mitochondrial DNA molecules from Drosophila melanogaster. Proc Natl Acad Sci U S A. 1978;75(8):3886–3890. doi: 10.1073/pnas.75.8.3886. [DOI] [PMC free article] [PubMed] [Google Scholar]
- Gray MW, Burger G, Lang BF. Mitochondrial evolution. Science. 1999;283(5407):1476–1481. doi: 10.1126/science.283.5407.1476. [DOI] [PubMed] [Google Scholar]
- Harman D. A biologic clock: the mitochondria? J Am Geriatr Soc. 1972;20(4):145–147. doi: 10.1111/j.1532-5415.1972.tb00787.x. [DOI] [PubMed] [Google Scholar]
- International HapMap Consortium. The International HapMap Project. Nature. 2003;426(6968):789–796. doi: 10.1038/nature02168. [DOI] [PubMed] [Google Scholar]
- Jenuth JP, Peterson AC, Fu K, Shoubridge EA. Random genetic drift in the female germline explains the rapid segregation of mammalian mitochondrial DNA. Nat Genet. 1996;14(2):146–151. doi: 10.1038/ng1096-146. [DOI] [PubMed] [Google Scholar]
- Jia W, Higgs PG. Codon usage in mitochondrial genomes: distinguishing context-dependent mutation from translational selection. Mol Biol Evol. 2008;25:339–351. doi: 10.1093/molbev/msm259. [DOI] [PubMed] [Google Scholar]
- Kann LM, Rand DM. Mutation and selection at silent and replacement sites in the evolution of animal mitochondrial DNA. Genetica. 1998;102/103:393–407. [PubMed] [Google Scholar]
- Kenyon L, Moraes CT. Expanding the functional human mitochondrial DNA database by the establishment of primate xenomitochondrial cybrids. Proc Natl Acad Sci U S A. 1997;94:91331–99135. doi: 10.1073/pnas.94.17.9131. [DOI] [PMC free article] [PubMed] [Google Scholar]
- Krakauer DC, Mira A. Mitochondria and germ-cell death. Nature. 1999;400(6740):125–126. doi: 10.1038/22026. [DOI] [PubMed] [Google Scholar]
- Kroon AM. Protein synthesis in mitochondria 3: on the effects of inhibitors on the incorporation of amino acids into protein by intact mitochondria and digitonin fractions. Biochim Biophys Acta. 1965;108(2):275–284. doi: 10.1016/0005-2787(65)90012-2. [DOI] [PubMed] [Google Scholar]
- Lane N, Martin W. The energetics of genome complexity. Nature. 2010;467(7318):929–934. doi: 10.1038/nature09486. [DOI] [PubMed] [Google Scholar]
- Lynch M, Blanchard JL. Deleterious mutation accumulation in organelle genomes. Genetica. 1998;102–103(1–6):29–39. [PubMed] [Google Scholar]
- Lupi R, et al. MitoZoa: a curated mitochondrial genome database of metazoans for comparative genomics studies. Mitochondrion. 2010;10(2):192–199. doi: 10.1016/j.mito.2010.01.004. [DOI] [PubMed] [Google Scholar]
- Margulis L. Origin of eukaryotic cells. New Haven (CT): Yale University Press; 1970. [Google Scholar]
- McFarland R, et al. Multiple neonatal deaths due to a homoplasmic mitochondrial DNA mutation. Nat Genet. 2002;30(2):145–146. doi: 10.1038/ng819. [DOI] [PubMed] [Google Scholar]
- McKenzie M, Chiotis M, Pinkert CA, Trounce IA. Functional respiratory chain analyses in murid xenomitochondrial cybrids expose coevolutionary constraints of cytochrome b and nuclear subunits of complex III. Mol Biol Evol. 2003;20(7):1117–1124. doi: 10.1093/molbev/msg132. [DOI] [PubMed] [Google Scholar]
- Meiklejohn CD, Montooth KL, Rand DM. Positive and negative selection on the mitochondrial genome. Trends Genet. 2007;23:259–263. doi: 10.1016/j.tig.2007.03.008. [DOI] [PubMed] [Google Scholar]
- Montooth KL, Meiklejohn CD, Abt DN, Rand DM. Mitochondrial-nuclear epistasis affects fitness within species but does not contribute to fixed incompatibilities between species of Drosophila. Evolution. 2010;64(12):3364–3379. doi: 10.1111/j.1558-5646.2010.01077.x. [DOI] [PMC free article] [PubMed] [Google Scholar]
- Muller HJ. The relation of recombination to mutational advance. Mutat Res. 1964;1:2–9. doi: 10.1016/0027-5107(64)90047-8. [DOI] [PubMed] [Google Scholar]
- Mulligan CJ, Kitchen A, Miyamoto MM. Comment on “Population size does not influence mitochondrial genetic diversity in animals”. Science. 2006;314:1390a. doi: 10.1126/science.1132585. [DOI] [PubMed] [Google Scholar]
- Nass MM, Nass S. Fibrous structures within the matrix of developing chick embryo mitochondria. Exp Cell Res. 1962;26:424–437. doi: 10.1016/0014-4827(62)90194-5. [DOI] [PubMed] [Google Scholar]
- Neiman M, Taylor DR. The causes of mutation accumulation in mitochondrial genomes. Proc Biol Sci. 2009;276:1201–1209. doi: 10.1098/rspb.2008.1758. [DOI] [PMC free article] [PubMed] [Google Scholar]
- Paland S, Lynch M. Transitions to asexuality result in excess amino acid substitutions. Science. 2006;311:990–992. doi: 10.1126/science.1118152. [DOI] [PubMed] [Google Scholar]
- Perna NT, Kocher TD. Patterns of nucleotide composition at fourfold degenerate sites of animal mitochondrial genomes. J Mol Evol. 1995;41:353–358. doi: 10.1007/BF00186547. [DOI] [PubMed] [Google Scholar]
- Pesole G, Gissi C, De Chirico A, Saccone C. Nucleotide substitution rate of mammalian mitochondrial genomes. J Mol Evol. 1999;48:427–434. doi: 10.1007/pl00006487. [DOI] [PubMed] [Google Scholar]
- Piganeau G, Gardner M, Eyre-Walker A. A broad survey of recombination in animal mitochondria. Mol Biol Evol. 2004;21(12):2319–2325. doi: 10.1093/molbev/msh244. [DOI] [PubMed] [Google Scholar]
- Poole AM, Penny D. Evaluating hypotheses for the origin of eukaryotes. Bioessays. 2006;29:74–84. doi: 10.1002/bies.20516. [DOI] [PubMed] [Google Scholar]
- Popadin K, Polishchuk LV, Mamirova L, Knorre D, Gunbin K. Accumulation of slightly deleterious mutations in mitochondrial protein-coding genes of large versus small mammals. Proc Natl Acad Sci U S A. 2007;104(33):13390–13395. doi: 10.1073/pnas.0701256104. [DOI] [PMC free article] [PubMed] [Google Scholar]
- Poulton J, et al. Transmission of mitochondrial DNA diseases and ways to prevent them. PLoS Genet. 2010;6(8):e1001066. doi: 10.1371/journal.pgen.1001066. [DOI] [PMC free article] [PubMed] [Google Scholar]
- R Development Core Team. R: A language and environment for statistical computing. R Foundation for Statistical Computing, Vienna, Austria. ISBN 3-900051-07-0. [cited Jan 2011] 2011. Available from: http://www.R-project.org[43988] [Google Scholar]
- Rand DM, Haney RA, Fry AJ. Cytonuclear coevolution: the genomics of cooperation. Trends Ecol Evol. 2004;19(12):645–653. doi: 10.1016/j.tree.2004.10.003. [DOI] [PubMed] [Google Scholar]
- Rand DM, Kann LM. Excess amino acid polymorphism in mitochondrial DNA: contrasts among genes from Drosophila, mice, and humans. Mol Biol Evol. 1996;13(6):735–748. doi: 10.1093/oxfordjournals.molbev.a025634. [DOI] [PubMed] [Google Scholar]
- Rawson PD, Burton RS. Functional coadaptation between cytochrome c and cytochrome c oxidase within allopatric populations of a marine copepod. Proc Natl Acad Sci U S A. 2002;99:12955–12958. doi: 10.1073/pnas.202335899. [DOI] [PMC free article] [PubMed] [Google Scholar]
- Reinecke F, Smeitink JA, van der Westhuizen FH. OXPHOS gene expression and control in mitochondrial disorders. Biochim Biophys Acta. 2009;1792(12):1113–1121. doi: 10.1016/j.bbadis.2009.04.003. [DOI] [PubMed] [Google Scholar]
- Reyes A, Gissi C, Pesole G, Saccone C. Asymmetrical directional mutation pressure in the mitochondrial genome of mammals. Mol Biol Evol. 1998;15:957–966. doi: 10.1093/oxfordjournals.molbev.a026011. [DOI] [PubMed] [Google Scholar]
- Ruiz-Pesini E, Mishmar D, Brandon M, Procaccio V, Wallace DC. Effects of purifying and adaptive selection on regional variation in human mtDNA. Science. 2004;303(5655):223–226. doi: 10.1126/science.1088434. [DOI] [PubMed] [Google Scholar]
- Saccone C, De Giorgi C, Gissi C, Pesole G, Reyes A. Evolutionary genomics in Metazoa: the mitochondrial DNA as a model system. Gene. 1999;238:195–209. doi: 10.1016/s0378-1119(99)00270-x. [DOI] [PubMed] [Google Scholar]
- Saccone C, Romano B, Di Bitonto G, Barnabei O, Quagliariello E. Effect of atractyloside on the incorporation of labeled nucleotides into the ribonucleic acids of the nuclei and mitochondria of rat liver. Boll Soc Ital Biol Sper. 1965;41(20):1203–1205. [PubMed] [Google Scholar]
- Sackton TB, Haney RA, Rand DM. Cytonuclear coadaptation in Drosophila: disruption of cytochrome c oxidase activity in backcross genotypes. Evolution. 2003;57(10):2315–2325. doi: 10.1111/j.0014-3820.2003.tb00243.x. [DOI] [PubMed] [Google Scholar]
- Scarpulla RC. Transcriptional paradigms in mammalian mitochondrial biogenesis and function. Physiol Rev. 2008;88(2):611–638. doi: 10.1152/physrev.00025.2007. [DOI] [PubMed] [Google Scholar]
- Schmidt TR, Wu W, Goodman M, Grossman LI. Evolution of nuclear- and mitochondrial-encoded subunit interaction in cytochrome c oxidase. Mol Biol Evol. 2001;18(4):563–569. doi: 10.1093/oxfordjournals.molbev.a003836. [DOI] [PubMed] [Google Scholar]
- Stewart JB, Freyer C, Elson JL, Larsson NG. Strong purifying selection in transmission of mammalian mitochondrial DNA. PLoS Biol. 2008;6(1):e10. doi: 10.1371/journal.pbio.0060010. [DOI] [PMC free article] [PubMed] [Google Scholar]
- Trifunovic A, et al. Somatic mtDNA mutations cause aging phenotypes without affecting reactive oxygen species production. Proc Natl Acad Sci U S A. 2005;102(50):17993–17998. doi: 10.1073/pnas.0508886102. [DOI] [PMC free article] [PubMed] [Google Scholar]
- Von Heijne G. Why mitochondria need a genome. FEBS Lett. 1986;198:1–4. doi: 10.1016/0014-5793(86)81172-3. [DOI] [PubMed] [Google Scholar]
- Wallace DC. A mitochondrial paradigm of metabolic and degenerative diseases, ageing, and cancer: a dawn for evolutionary medicine. Annu Rev Genet. 2005;39:359–407. doi: 10.1146/annurev.genet.39.110304.095751. [DOI] [PMC free article] [PubMed] [Google Scholar]
- White DJ, Wolff JN, Pierson M, Gemmell NJ. Revealing the hidden complexities of mtDNA inheritance. Mol Ecol. 2008;17(23):4925–4942. doi: 10.1111/j.1365-294X.2008.03982.x. Erratum in: Mol Ecol 2009 Feb;18(4):762. [DOI] [PubMed] [Google Scholar]
- Wright F. The “effective number of codons” used in a gene. Gene. 1990;87:23–29. doi: 10.1016/0378-1119(90)90491-9. [DOI] [PubMed] [Google Scholar]
- Yang Z. PAML 4: a program package for phylogenetic analysis by maximum likelihood. Mol Biol Evol. 2007;24:1586–1591. doi: 10.1093/molbev/msm088. [DOI] [PubMed] [Google Scholar]
- Zhou RR, Wang B, Wang J, Schatten H, Zhang YZ. Is the mitochondrial cloud the selection machinery for preferentially transmitting wild-type mtDNA between generations? Rewinding Müller's ratchet efficiently. Curr Genet. 2010;56(2):101–107. doi: 10.1007/s00294-010-0291-5. [DOI] [PubMed] [Google Scholar]