Abstract
Magnetic relaxation switch (MRSw) detection is based on aggregate formation or dissociation when magnetic nanoparticles (MNPs) bind to target molecules. In the aggregated state, the dephasing rate of nearby proton spins is higher than in the dispersed state, resulting in a decrease in the spin-spin relaxation time, T2. In this work, an MRSw-based nanosensor for lysozyme (Lys) protein detection was achieved using iron oxide nanoparticles conjugated with either Lys aptamer or linker DNA, which can hybridize with the extended part of the aptamer to form clusters. Upon the addition of Lys, the aptamers bind with their targets, leading to disassembly of clusters and an increase in T2. A detection limit in the nanomolar range was achieved for Lys detection in both buffer and human serum. The determination of Lys level in different types of cancer cell lysates was also performed to demonstrate detection in real clinical samples.
Introduction
Over the past few decades, nanoparticles (NPs) have received considerable attention in advanced biomedical science. The unique characteristics of NPs, such as large surface-to-volume ratio and size-dependent optical and magnetic properties, hold promise for the development of highly sensitive and selective diagnostic tools for clinical use. Specific ligands can be conjugated to a variety of nanoparticles to provide specificity and multivalent affinity. The interaction of NP-ligand conjugates with their target molecules can be transduced into a reporting signal which can be detected by fluorescence,1,2 colorimetric,1 and Raman spectroscopy.1,3
It has been observed that magnetic NPs (MNPs) have the ability to enhance the magnetic resonance (MR) signal of protons from surrounding water molecules.4–6 Aggregation of MNPs induces the coupling of magnetic spin moments and generates strong local magnetic fields. Such local magnetic field inhomogeneities accelerate the dephasing of adjacent water protons, resulting in a decrease of transverse or spin-spin relaxation times (T2). Thus, both aggregation and dissociation of MNP clusters can be detected by a change in proton relaxation times (ΔT2) by using NMR, magnetic resonance imaging (MRI), or relaxometry. This phenomenon has led to the development of magnetic relaxation switches (MRSw), in which the self-assembly of MNPs, or disassembly of pre-existing magnetic clusters, corresponds to the presence or absence of specific targets, respectively. Such reversible systems can be designed to detect a variety of targets, such as DNA,7 bacteria,8 viruses,9 and small molecules,10 with the MNPs going either from the dispersed to aggregated state or vice-versa. Additionally, the detection based on MRSw mechanism is light independent, resulting in the absence of background interference by scattering, absorption, or autofluorescence.11 Therefore, the detection based on MRSw mechanism may be an alternative strategy, especially for biological samples.
Protein dysfunction in the context of cell regulation and signal transduction is always associated with the development of diseases, especially cancer.12–14 Thus, advances in protein detection and quantification are essential for pharmaceutical and biomedical research. Recently, aptamers, which comprise a new class of ligands, have been isolated and identified to recognize a variety of chemical and biological molecules with high affinity and selectivity.15 Aptamers are obtained through an in vitro selection process, which is known as systematic evolution of ligands by exponential enrichment (SELEX), against a variety of targets, such as ions, proteins, and cells.16,17 Aptamers have several advantages over antibodies, such as ease of manipulation, reproducible synthesis, good stability against biodegradation, and non-toxicity.
In the following discussion, we will demonstrate an aptamer-based sensor for protein detection based on MRSw, using lysozyme (Lys) and anti-Lys aptamers as models. Lys is a highly isoelectric point enzyme (pI~11) that contains 129 amino acids. Generally, a low concentration of Lys is distributed in body tissues and secretions. However, it was reported that elevated levels of Lys in serum, urine, and cells are related to many diseases, such as leukemia,18 renal diseases,19 and meningitis.20 Therefore, the detection and quantification of Lys is very important. In order to demonstrate the feasibility of our magnetic nanosensors for real clinical analysis, the detection of Lys in serum and cell lysates was also investigated.
Results and Discussion
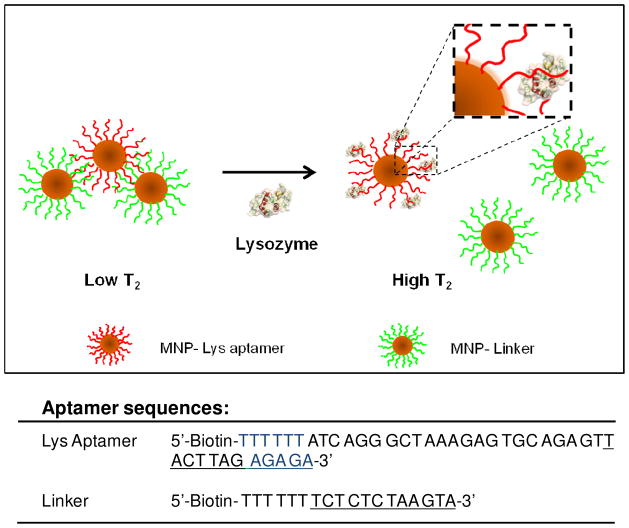
The MRSw mechanism for the Lys sensor is based on analyte-induced disassembly of MNPs, an event which results in an increase in T2, as explained above. As shown in Fig. 1, iron oxide nanoparticles are conjugated with either Lys aptamer or linker DNA. In the absence of Lys, the linker can hybridize with part of the aptamer (7 bases of the aptamer plus a 5-base extension) to form clusters (short T2). However, in the presence of Lys, the aptamer undergoes a structural change in order to bind with the target, resulting in base pair disruption. The five remaining base pairs between MNP-Lys aptamer and MNP-Linker are not strong enough to hold the cluster together at room temperature, leading to the disassembly of the clusters (longer T2). Therefore, the Lys-induced disassembly of the clusters can be monitored by this increase in T2.
Figure 1.
Schematic representation of the magnetic nanosensor for Lys detection based on MRSw. The iron oxide nanoparticles are conjugated with either Lys aptamer or linker DNA which can hybridize with the extended part of the aptamer to form clusters. Upon the addition of Lys, the aptamers bind with their targets, leading to disassembly of clusters and increased T2 relaxation time of the adjacent protons.
Lys nanosensor preparation
In this study, 30 nm iron oxide NPs were chosen in order to prevent unwanted settling and aggregates due to large size of particles.21 Specifically, it was reported that large particles tend to aggregate under magnetic field without any targets which complicated their use for MRSw detection.22 Additionally, the role of MNPs valency on MRSw detection was studied by Koh and coworkers.23 The results demonstrated that the more multivalent MNPs was able to achieve higher sensitivity of target detection. Consequently, streptavidin-coated iron oxide nanoparticles were conjugated with excess amount of either biotin-labeled aptamers or biotin-labeled linker. To prepare Lys nanosensor, equimolar of MNP-Lys aptamer was incubated with MNP-Linker ([Fe] = 12 μg/mL) followed by T2 measurement. Within 5 minutes, the nanosensor showed a decrease in T2, indicating the formation of clusters upon the hybridization between the complementary strands (Supplementary Table 1). In contrast, the T2 of either the individual MNP-Lys aptamer or MNP-Linker showed no significant change. The T2 of the nanosensor remained constant after 10 min of incubation, indicating that the formation of nanosensors could be completed in a short time. The aggregation was confirmed again by mixing a high concentration of MNP-Lys aptamer and MNP-Linker at [Fe] = 100 μg/mL and incubating overnight at 4°C. Precipitation of the nanosensor was observed as a consequence of the formation of large clusters (Supplementary Figure 1). However, the same effect was not observed for individual MNP-Lys or MNP-Linker.
The Lys-induced disassembly of nanosensors
To avoid precipitation, the Lys assay was performed with the nanosensor at a low concentration ([Fe] = 12 μg/mL). Two hundred fifty nM of Lys was added into the prepared nanosensor, followed by T2 measurements at 5-minute intervals after adding the target. For each time interval, the change in T2 (ΔT2) was calculated by the following equation:
where T2sample is the average T2 relaxation time of three replicates of the nanosensor after protein addition and T2blank is the average T2 relaxation time of three replicates of the nanosensor without target protein. A gradual increase in ΔT2 was observed from 5 to 20 min after Lys addition (Supplementary Figure 2), due to disassembly of the magnetic clusters after aptamer binding to the Lys. The signal reached a maximum within 20 min, demonstrating the rapid detection of Lys by the nanosensor.
Selectivity and specificity of magnetic nanosensors
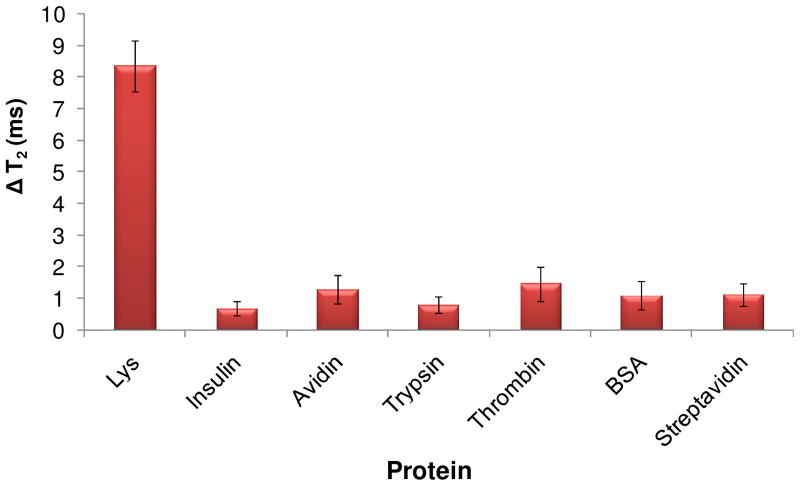
To assess the selectivity of detection, the change in T2 was measured within 40 min after adding 50 nM of Lys or 50 nM of some possible interfering proteins, such as insulin, avidin, trypsin, thrombin, BSA, and streptavidin. As shown in Figure 2, a significant increase in T2 upon adding Lys was observed, while the other proteins showed no significant change in T2 values. The result showed high lysozyme selectivity against other proteins, which may have otherwise have interfered with detection in biological samples.
Figure 2.
Selectivity of the magnetic nanosensor. Disassembly of magnetic clusters upon the addition of 50 nM of Lys target detected by significant change in T2 relaxation time. At the same time, other proteins, as noted, showed only negligible changes, indicating no interaction with the nanosensor.
To confirm that the detection resulted from specific binding between the target protein Lys and nanosensors rather than nonspecific effects, a random DNA sequence conjugated with MNPs was used for nanosensor preparation instead of MNP-Lys aptamer. To demonstrate that Lys cannot induce disassembly of pre-existing clusters prepared between MNP-random sequences and MNP-Linker, seven bases at the end of Lys aptamer and the extended part were preserved in random sequences in order to form the clusters. As expected, the nanosensor prepared by random sequences did not bind with the Lys target, resulting in only minimal change in T2 (Supplementary Figure 3). This result confirmed that the disassembly of nanosensors occurs because of interaction of the aptamer-conjugated MNPs with target Lys to the exclusion of nonspecific interactions.
Quantitative analysis
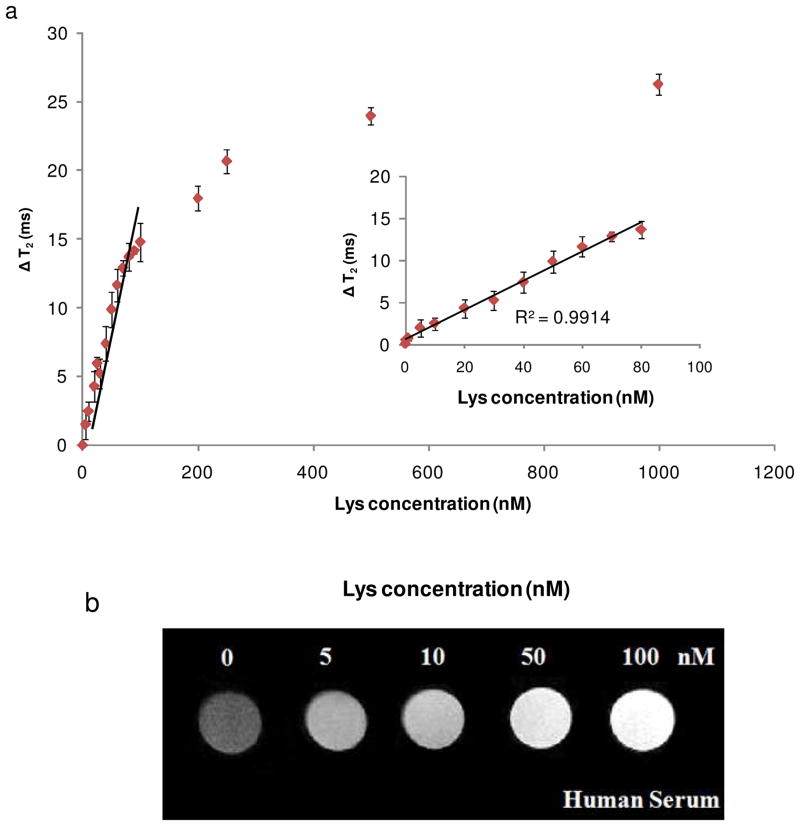
The range of detection was determined by measuring the change of T2 for samples with different concentrations of Lys. The result showed a continuous increase in ΔT2 as the Lys concentration was raised from 0 to 500 nM (Figure 3a). The change of T2 reached maximum when the Lys concentration increased to more than 500 nM, indicating that binding saturation had occurred between Lys aptamers and their targets. A linear relationship between Lys concentration and ΔT2 was observed in the concentration range of 0.5–80 nM with a correlation coefficient (R2) of 0.9914, as shown in the inset of Figure 3a. Using this nanosensor, Lys could be detected at concentrations as low as 0.5nM without any separation or amplification step. The low detection limit of this nanosensor can be attributed to the high affinity of the aptamer to Lys with a dissociation constant (Kd) of 30 nM,24 as well as the low background noise inherent in MRSw detection.
Figure 3.
Changes in T2 relaxation time with increasing concentrations of Lys. (a) The detection range was determined in PBS; inset: expanded linear region of the curve. (b) The detection of Lys-spiked human serum using T2-weighted MR images.
Detection in complex biological media was also demonstrated by spiking Lys into 100% human serum. The result demonstrated that this nanosensor was able to detect Lys in the nanomolar range in serum, and a linear relationship between ΔT2 and Lys concentration from 1 to 80 nM was achieved (Supplementary Figure 4). It is interesting to note that magnetic nanosensors based on MRSw may not offer a very low detection limit compared to fluorescent techniques in buffer systems.25 Nevertheless, because of the light-independent property of MRSw, and the inherent low background, Lys was detectable in the nanomolar range in complex biological medium without any separation or amplification step. This result revealed the feasibility of using this magnetic nanosensor in clinical analysis.
The detection of Lys in human serum was also confirmed using T2-weighted MR imaging. An increase of Lys concentration led to more disassembly of nanosensor clusters, resulting in an increase in T2 and an increase in brightness of the T2 images, as shown in Figure 3b. The change in contrast was also observed in the nanomolar range of Lys protein which corresponds to detection using a benchtop relaxometer.
Detection of Lys in cell lysates
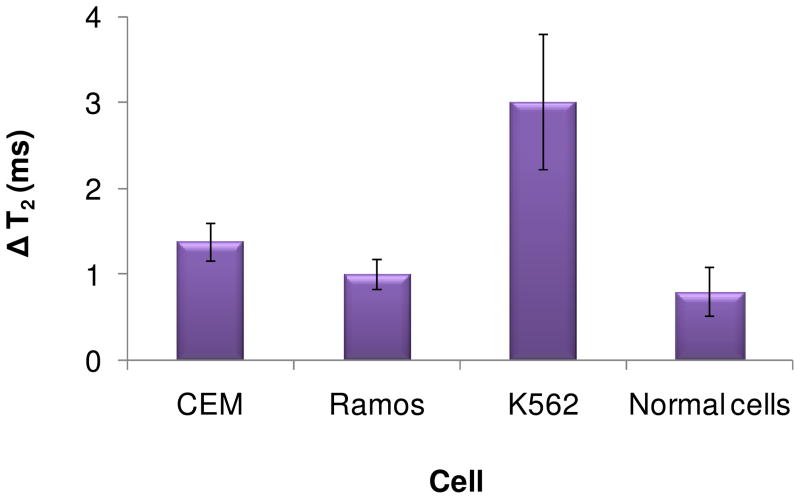
To validate the use of this Lys nanosensor for real clinical samples, an analysis of Lys in lysates from leukemia cells was performed. CEM, Ramos, and K562 cells were chosen to represent a variety of leukemia cell types. Within this set, normal white blood cells were used as a control. Lysates from one million cells of each cell type were incubated with the Lys nanosensor followed by T2 relaxation time measurements similar to those in previous assays. The cell lines containing a large amount of Lys could induce a high degree of cluster disassembly, resulting in significant change in ΔT2. Based on the MR response, the three cancer cell lines showed a variation of ΔT2, indicating that different amounts of Lys were contained in each cell type (Figure 4). Normal white blood cells showed only a small change in T2, indicating a low concentration of Lys. It was previously reported that a high concentration of Lys was detected in myeloid leukemia cells.26 As expected, a significant increase in T2 was observed in K562 cells, which belong to a myeloid leukemia cell line, based on their high Lys expression. In contrast, CEM and Ramos, which are T and B lymphoid leukemia cells, showed small ΔT2, similar to that of normal cells, indicating a low Lys expression, a result which agrees with the literature.26,27 The accuracy of the assay was verified by the analytical recovery experiment. The K562 cells which showed highest amount of Lys among others were chosen to perform analytical recovery. The K562 cell lysate samples were spiked with Lys at three different concentrations, 5, 10, and 20 nM, respectively. The % recovery of each sample was calculated from the ratio between the amounts of detected Lys in spiked sample to the amounts of additional Lys and the unspiked sample. The results of theses recovery tests were demonstrated in Table 1. The addition of Lys from 5 to 20 nM to the cell lysates led to the % recovery of about 90% indicated the reliability of theses assays. The results suggested that this magnetic nanosensor could be potentially used for differentiation of Lys levels in specimens between healthy individuals and patients with leukemia.
Figure 4.
Determination of Lys in cell lysates. Normal white blood cells were used as a standard to represent the normal Lys level. A significantly elevated amount of Lys was observed in K562 cells, while CEM and Ramos only showed small differences in Lys levels compared to normal white blood cells.
Table 1.
Determination of Lys in K562 cells and spiked samples
| Samples | ΔT2 | Lys concentration (nM/1 × 106 cells) | Recovery % |
|---|---|---|---|
| K562 cells | 3.01±0.79 | 13.92 | N/A |
| K562 cells + 5 nM Lys | 3.67± 0.42 | 17.72 | 93.66% |
| K562 cells + 10 nM Lys | 4.38±0.56 | 21.47 | 89.76% |
| K562 cells + 20 nM Lys | 5.89±0.68 | 30.49 | 89.89% |
Conclusion
In conclusion, we successfully demonstrated an aptamer-based biosensor for protein detection using MRSw and Lys as the model target protein. Good selectivity for Lys compared to other proteins was demonstrated by minimal disassembly of pre-existing clusters prepared by random DNA sequences conjugated with MNPs. A detection limit in the nanomolar range was achieved for Lys detection in both buffer and human serum. Detection was confirmed by the T2-weighted MR image of Lys-induced disassembly. An assay to determine the level of Lys in cell lysates also demonstrated the potential of this Lys nanosensor for real clinical sample analysis. Overall, this MRSw-based nanosensor offers the advantages of high sensitivity and simplicity for the detection in turbid media and biological samples without protein purification or separation; consequently, the system is feasible for point-of-care diagnostics.
Methods
Synthesis of DNA
All DNA samples were synthesized using standard phosphoramidite chemistry with an ABI3400 DNA/RNA synthesizer (Applied Biosystems, CA). Biotin core pore glass (CPG) from Glen Research was used for the synthesis. After the synthesis, the aptamers were deprotected in concentrated AMA (1:1 mixture of ammonium hydroxide and aqueous methylamine) solution at 65°C for 30 min, prior to further purification with reversed phase high-pressure liquid chromatography (RP-HPLC) using a ProStar HPLC Station (Varian, CA) equipped with a fluorescent and a photodiode array detector and a C-18 reversed phase column (Econosil, C18, 5 μM, 250 × 4.6 mm) from Alltech (Deerfield, IL). The eluent was 100mM triethylamine-acetic acid buffer (TEAA, pH 7.5) and acetonitrile (0–30min, 10–100%). The collected DNA products were dried and detritylated with acetic acid. The detritylated aptamers were precipitated with ethanol and dried using a vacuum drier. The purified aptamers were then dissolved with DNA grade water and quantified by determining the UV absorption at 260 nm using a UV-Vis spectrometer (Cary Bio-300, Varian).
Cluster formation of nanosensors
In order to prepare magnetic nanosensors, 30 nm streptavidin-coated iron oxide nanoparticles (Ocean Nanotech) were dispersed at 0.1 mg/mL in 100 mM phosphate-buffered saline (PBS), pH 7.4. An excess amount of biotin-labeled Lys aptamer or linker DNA was then added to separate samples of the streptavidin-coated MNPs. The mixtures were vortexed at room temperature for 1 h followed by washing 3x with PBS buffer using centrifugation at 14000 rpm to remove any DNA that did not conjugate to the MNPs. The conjugates were dispersed in PBS and stored at 4°C at a concentration of 0.1 mg/mL. Equimolar amounts of MNP-Lys aptamer and MNP-Linker were mixed together and dispersed in PBS buffer at a final concentration of 12 μg Fe/mL, leading to cluster formation within 20 min. The spin-spin relaxation times (T2) were measured at 1.5 T by mq60 NMR analyzer (Minispec, Bruker, Germany), operating at 37°C to confirm the aggregation of nanosensors.
Nanosensor preparation and Lys detection
The Lys nanosensor was prepared as mentioned in the previous section. A stock solution of protein (0.1mM) was prepared in deionized water and diluted in PBS as necessary. Fifty μL aliquots of Lys with different concentrations were incubated with 200 μL nanosensor mixture in PBS at room temperature at a final volume of 250 μL and [Fe] = 12 μg/mL. The spin-spin relaxation times (T2) were measured after 40 min of incubation without a washing step. The samples with human serum (Innovative Research) were prepared by adding protein and nanosensors to 100% human serum using the same concentration of nanosensors. T2-weighted MR images were obtained by using a 4.7 T NMR instrument with a spin echo pulse sequence, variable echo time (TE) of 50–100 ms and repetition time (TR) of 3000 ms.
Lys detection in cell lysates
All cancer cell lines were obtained from the American Type Culture Association (ATCC). CEM and Ramos cells were cultured in RPMI 1640 medium (ATCC). K562 cells were maintained in culture with IMDM (ATCC). All media for cancer cells were supplemented with 10% heat-inactivated FBS and 100 U/mL penicillin–streptomycin. All cultured cells were grown in a humidified incubator at 37°C under a 5% CO2 atmosphere. The normal white blood cells (WBC) were separated from whole blood samples (Innovative Research) and transferred into 15 mL tubes. To isolate the WBC, blood was centrifuged at 2000 rpm for 10 min at room temperature. This procedure separated the blood specimen into three layers: an upper plasma layer, a lower red blood cell (RBC) layer, and a thin interface buffy coat containing the WBC. With a transfer pipette, the plasma was first removed, and then the buffy coat was carefully aspirated into a separated tube. Cell suspensions were centrifuged at 1000 rpm for 5 min, and the pellet was resuspended in 2mL of washing buffer. After washing 2x, ten microliter aliquots of the cell suspension were mixed with 10 μL trypan blue solution. Cell quantification was performed using a hemocytometer (Hausser Scientific) and a microscope (Olympus). Ten million cells of each cell type were resuspended in 250 μL of 1% ice cold CHAPS (3-[(3-Cholamidopropyl) dimethylammonio]-1-propanesulfonate) lysis buffer. The lysates were incubated for 30 min on ice and centrifuged 20 min at 12000 rpm at 4°C. The lysates were transferred to clean centrifuge tubes for Lys assay or frozen at −80 °C. Fifty μL aliquots, which contained lysate from 2×10⁶ cells, were incubated with nanosensor solution in PBS using the same conditions mentioned above, followed by the spin-spin relaxation time measurement.
Supplementary Material
References
- 1.Liu J, Cao Z, Lu Y. Chem Rev. 2009;109:1948–1998. doi: 10.1021/cr030183i. [DOI] [PMC free article] [PubMed] [Google Scholar]
- 2.Wang L, Wang K, Santra S, Zhao X, Hilliard LR, Smith JE, Wu Y, Tan W. Anal Chem. 2006;78:646–654. [Google Scholar]
- 3.Jain PK, Huang X, El-sayed IH, El-sayed MA. Acc Chem Res. 2007;41:1578–1586. doi: 10.1021/ar7002804. [DOI] [PubMed] [Google Scholar]
- 4.Weissleder R, Moore A, Mahmood U, Bhorade R, Benveniste H, Chiocca EA, Basilion HP. Nat Med. 2000;6:351–354. doi: 10.1038/73219. [DOI] [PubMed] [Google Scholar]
- 5.Zhao M, Beauregard DA, Loizou L, Davletov B, Brindle KM. Nat Med. 2001;7:1241–1244. doi: 10.1038/nm1101-1241. [DOI] [PubMed] [Google Scholar]
- 6.Liu W, Dahnke H, Jordan EK, Schaeffter T, Frank JA. NMR Biomd. 2008;21:242–250. doi: 10.1002/nbm.1187. [DOI] [PubMed] [Google Scholar]
- 7.Perez JM, Josephson L, O’Loughlin T, Hogemann D, Weissleder R. Nature biotech. 2002;20:816–820. doi: 10.1038/nbt720. [DOI] [PubMed] [Google Scholar]
- 8.Kaittanis C, Naser SA, Perez JM. Nano Lett. 2007;7:380–383. doi: 10.1021/nl062553z. [DOI] [PubMed] [Google Scholar]
- 9.Perez JM, Simeone FJ, Saeki Y, Josephson L, Weissleder R. J Am Chem Soc. 2003;125:10192–10193. doi: 10.1021/ja036409g. [DOI] [PubMed] [Google Scholar]
- 10.Tsourkas A, Hofstetter O, Hofstetter H, Weissleder R, Josephson L. Angew Chem Int Ed. 2004;116:2449–2543. doi: 10.1002/anie.200352998. [DOI] [PubMed] [Google Scholar]
- 11.Haun JB, Yoon TJ, Lee H, Weissleder R. Advanced Review. 2010;2:291–304. doi: 10.1002/wnan.84. [DOI] [PubMed] [Google Scholar]
- 12.Hunter T. Cell (Cambridge, Mass) 2000;100:113. [Google Scholar]
- 13.Cohen P. Nat Rev Drug Discovery. 2002;1:309–315. doi: 10.1038/nrd773. [DOI] [PubMed] [Google Scholar]
- 14.Von Ahsen O, Bomer U. Chembiochem. 2005;6:481–490. doi: 10.1002/cbic.200400211. [DOI] [PubMed] [Google Scholar]
- 15.Brody EN, Gold L. Rev Mol Biotechnol. 2000;74:5–13. doi: 10.1016/s1389-0352(99)00004-5. [DOI] [PubMed] [Google Scholar]
- 16.Ellington AD, Szostak JW. Nature. 1990;346:818–822. doi: 10.1038/346818a0. [DOI] [PubMed] [Google Scholar]
- 17.Tuerk C, Gold L. Science. 1990;249:505–510. doi: 10.1126/science.2200121. [DOI] [PubMed] [Google Scholar]
- 18.Levinson SS, Elin RJ, Yam L. Clin Chem. 2002;48:1131–1132. [PubMed] [Google Scholar]
- 19.Harrison JF, Lunt GS, Scott P, Blainey JD. Lancet. 1968;1:371–375. doi: 10.1016/s0140-6736(68)91350-0. [DOI] [PubMed] [Google Scholar]
- 20.Klockars M, Reitamo S, Weber T, Kerttula Y. Acta Med Scand. 1978;203:71–74. doi: 10.1111/j.0954-6820.1978.tb14834.x. [DOI] [PubMed] [Google Scholar]
- 21.Weissleder R, Lee AS, Khaw A, Shen T, Brady TJ. Magn Reson. 1992;8:55–63. [Google Scholar]
- 22.Koh I, Hong R, Weissleder R, Josephson L. Angew Chem Int Ed. 2008;47:4119–4121. doi: 10.1002/anie.200800069. [DOI] [PMC free article] [PubMed] [Google Scholar]
- 23.Koh I, Hong R, Weissleder R, Josephson L. Anal Chem. 2009;81:3618–3622. doi: 10.1021/ac802717c. [DOI] [PMC free article] [PubMed] [Google Scholar]
- 24.Cox JC, Ellington AD. Bioorg Med Chem. 2001;9:2525–2531. doi: 10.1016/s0968-0896(01)00028-1. [DOI] [PubMed] [Google Scholar]
- 25.Wang B, Yu C. Angew Chem Int Ed. 2010;49:1485–1488. doi: 10.1002/anie.200905237. [DOI] [PubMed] [Google Scholar]
- 26.Saito N. Leukemia and Lymphoma. 1990;2:347–350. doi: 10.3109/10428199009106471. [DOI] [PubMed] [Google Scholar]
- 27.Leculier C, Coupri N, Francina A, Archimbaud E, Adeleine P, Treille D, Denoyel G, Fiere D. Blood. 1992;79:760–764. [PubMed] [Google Scholar]
Associated Data
This section collects any data citations, data availability statements, or supplementary materials included in this article.


