Abstract
Purpose/Background:
Ultrasonography (US) may aid the assessment of the anterior talofibular ligament (ATFL) injury after lateral ankle sprains by allowing the clinician to visualize and measure talocrural laxity. Comparison of US against another objective method of ankle laxity assessment, such as ankle arthrometry (AA), is needed. The purpose was to evaluate the relationship between the ATFL length measurements measured from stress US images to the inversion and anterior drawer displacement measured with AA in healthy subjects.
Methods:
This descriptive laboratory study included 26 ankles from healthy subjects. The apparent length of the ATFL was measured using US during anterior drawer (USAD) and inversion (USINV) stress and the translation of the talocrural joint was measured using AA during anterior drawer (AAAD) and inversion (AAINV) stress. Percent change in length for USAD and USINV were quantified. Intraclass correlation coefficients and pearson product moment correlations Bland-Altman limits of agreement were calculated between relevant variables.
Results:
USAD and USINV percent change in length were positively correlated (r = .76). Bland Altman analysis revealed a mean difference of 5.38 mm (95% CI: –3.5 to 12 mm) with the AAAD producing higher values than the USAD. No significant correlations were found between the US and AA variables, however the absolute AAAD and AAINV variables were also positively correlated (r = .61).
Conclusions:
The US and AA variables were not directly correlated when measuring inversion and anterior laxity in healthy ankles. Differences between the devices that may affect this include different rates of joint loading, patient position and method of assessing laxity. The AA results demonstrated greater anterior displacement. Results may differ in ankle injured subjects who may demonstrate increases in anteroposterior and inversion laxity.
Level of Evidence:
2b. Exploratory study in healthy cohort.
Keywords: ankle laxity, anterior displacement, inversion rotation, percent length change
INTRODUCTION
Lateral ankle sprains are common injuries and inadequate diagnosis and treatment can have long-term negative effects including instability, pain, and dysfunction.1 These injuries make up approximately 25% of the injuries from running and jumping sports.2 The lateral ankle is supported primarily by the anterior talofibular ligament (ATFL) and the calcaneofibular ligament (CFL), and injury to one or both of these ligaments may lead to increased anterior drawer and inversion laxity.3,4 Current assessment techniques of the ATFL include manual physical examination, radiography including stress radiographs, magnetic resonance imaging (MRI), arthrograms, and arthrometry. Each of these has limitations in clinical practice such as questionable reliability, radiation exposure, or device availability. The use of stress ultrasound (US) in the evaluation of the ATFL may provide diagnostic information regarding the extent of the ligament injury and talocrural joint integrity.1,5,6 Stress ultrasound, or ultrasonography, is used to describe imaging of the ankle joint during anterior drawer or inversion stress to identify changes in talofibular position resulting from the stress. It is similar to stress radiography in that the same joint stress is applied; however, ultrasound is used to image ankle anatomy rather than radiography.
Ankle physical examination consists of manual joint stress testing that involves the application and interpretation by the examiner of passive movement of the patient's ankle at the end range of motion. The anterior drawer and talar tilt tests are used to assess ligament integrity and, following lateral ankle sprains, stretched or torn ligaments can result and the examiner may perceive an increase in joint laxity. However, these tests have not been shown to be reliable nor valid and a need exists for improved measurement techniques.3,7 Stress radiographs measure the amount of movement relative to the tibia under anterior drawer or inversion stress in an effort to quantify talocrural and subtalar joint laxity. Some limitations with stress radiography are that the testing may be influenced by pain and also unnecessarily expose the subject or provider to ionizing radiation, however the standardization of stress forces that occurs using devices of proven reliability has been shown to reduce measurement errors.8
Ankle arthrometry (AA) is an objective measure of rearfoot inversion and anterior ankle displacement and is a reliable and valid measure of talocrural and subtalar joint stability. The Hollis ankle arthrometer (Blue Bay Research, Milton, FL) is a device specifically designed to measure ankle joint laxity and Kovaleski et al demonstrated high interrater and intrarater reliability.4,9 Kovaleski et al. found a strong correlation between arthrometer variables of anterior to posterior translation (r = .88) and inversion (INV) (r = .86) when compared to the actual motion occurring between the tibia and calcaneus as demonstrated by pins inserted into the bones of cadaver ankles.4 Ankle arthrometry has been used to assess anterior and inversion laxity in patients with acute ankle sprains and chronic ankle instability.10–12 Currently, AA is primarily limited to research applications since the device is not widely available in clinical practice settings.
Ultrasound can be used to visualize the ATFL from the malleolar origin to the talar insertion and the apparent ligament length can be measured using a digital caliper either during the exam or later using the saved images.5,13 A longitudinal measurement between the bony attachments of the ATFL is taken by identifying the fibular origin and performing a straight-line measurement along the ATFL fibers to the insertion on the talar neck. When using this method, Brasseur et al.14 found the apparent length of the ATFL to be 16.1 ± 3.63 mm. Furthermore, Oae et al1 reported high accuracy using a longitudinal US ATFL imaging compared to arthroscopy in the identification of morphological changes suggestive of ATFL injury in 34 patients (19 males, 15 females) in need of ankle arthroscopy (mean age 29 years, range 13–55) presenting clinically with both acute and chronic lateral ankle injuries. Campbell et al6 included manual anterior drawer stress to an US exam and further identified ATFL injury indicating that the combined use of US imaging and ankle joint stress, followed by measurement of the changes in talofibular displacement using methods described by Brasseur et al and Glaser et al,5,14 may provide clinicians with more accurate and reliable information on talocrural joint integrity than do the manual anterior drawer and talar tilt stress tests.
Although US imaging of the ATFL can provide valuable information regarding the structure and the distance between bony attachments, it is unknown whether changes in the length of the ATFL represented on an US image are related to the talocrural displacement measured with an ankle arthrometer. The authors hypothesize that the amount of ATFL lengthening measured from an US image during anterior drawer and inversion are directly related to the amount of anterior translation and inversion degrees of laxity measured with an ankle arthrometer during separate trials. The purpose of this study was to evaluate the relationship between the ATFL length measurements measured from stress US images to the inversion and anterior translation observed with AA in healthy subjects.
METHODS
This descriptive laboratory study explored the relationship between absolute length measurements of the ATFL during anterior drawer and inversion stress and depicted on an US image (USAD and USINV, respectively), the relative changes in ATFL length during the anterior drawer and inversion stress, using ultrasound analysis (USAD% and USINV%, respectively) with the anterior drawer and inversion laxity results obtained using the ankle arthrometer (AAAD and AAINV, respectively) . The relationships of particular interest were those between the following variables: USAD and AAAD, USAD% and AAAD, USINV and AAINV, and USINV% and AAINV. Secondary relationships of interest were between USAD and USINV, USAD% and USINV%, and finally between AAAD and AAINV.
Subjects
Twenty-six healthy subjects (12 males, 14 females) who had no history of injury to at least one of their ankles participated. Fifteen subjects had no history of injury to either ankle, while 11 subjects had a history of unilateral ankle injury. For the purposes of this study, a randomly selected ankle from the participants with no injury history was chosen and the uninjured ankle was used in subjects with a unilateral history of injury for 26 ankles included. See Table 1 for subject demographic information.
Table 1.
Subject demographics (n = 26). Values are represented as means ± SD.
| Age (years) | Height (cm) | Mass (kg) | BLS | Foot Length (cm) |
|---|---|---|---|---|
| 24.8 ± 4.6 | 172.9 ± 9.3 | 74.7 ± 18.1 | 2.7 ± 2.2 | 24.6 ± 2.3 |
BLS= Beighton Laxity Score; cm= centimeter; kg= kilogram.
Exclusion criteria included a history of bilateral ankle sprains, ankle or tarsal fracture, or current skin lesions around the foot or ankle region. A Latin square was used to randomize the order in which the AA or the US assessments were performed. All subjects were informed of the possible risks associated with the experiment and signed a consent form prior to participation. The university institutional review board approved the study methods.
Instruments
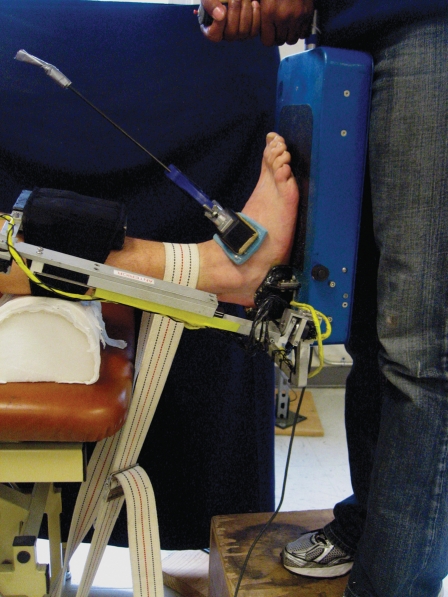
A portable US unit with a 38 mm linear transducer probe operating at 8 MHz (GE Logic Book PRO, Fairfield, CT) was used to acquire US images in conjunction with the LigMaster™ multi-joint arthrometer (SportTech, Inc. Charlottesville, VA) that was used to apply 125 N of anterior drawer force and to invert and stabilize the ankle near the end range of inversion range of motion. The Hollis ankle arthrometer (Blue Bay Research Inc., Milton, FL) was used to apply and measure the amount of anterior ankle translation during 125 N of anterior drawer force and degrees of ankle inversion motion with a 4000 N*mm of inversion torque.
Testing procedures
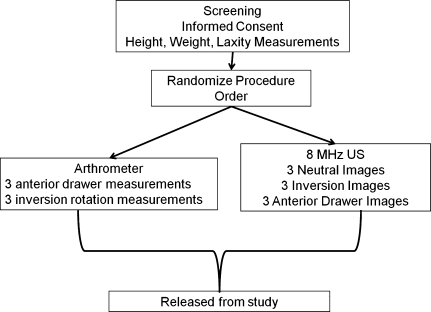
A flow chart of subjects through the study is shown in Figure 1.
Figure 1.
Flow chart for study procedures.
Ultrasound Exam
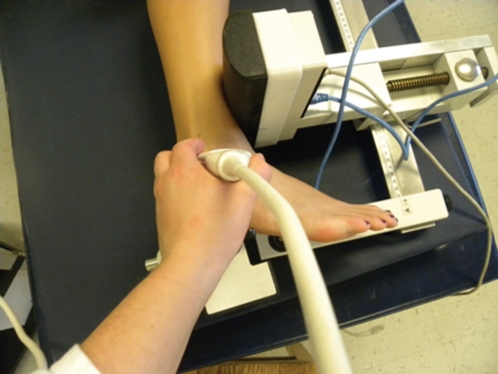
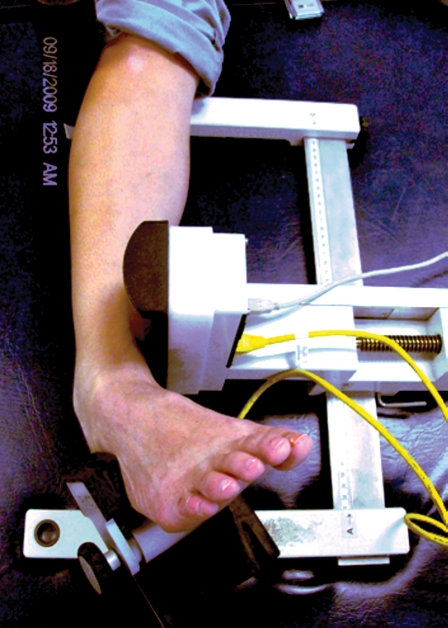
US images were taken in three positions (neutral, inversion, anterior drawer). Anterior drawer and inversion testing positions are shown in Figures 2 and 3. Standard ultrasound transmission gel was used as the conducting agent. Neutral images (USNEUT) were captured first while the subject was sidelying with the ankle joint in a neutral position (0° dorsi/plantar flexion and 0° inversion/eversion). While in this position, three images of the ATFL were obtained after identifying the bony landmarks of the talus and lateral malleolus.15 Between each USNEUT image, the examiner removed the US probe and the subject actively moved the ankle 3 times into full plantar and dorsi flexion and then returned to the neutral position for the subsequent images.
Figure 2.
Anterior drawer stress used to capture USAD images.
Figure 3.
Ankle inversion method used to capture USINV images.
USINV images were taken with the subject in the supine position with the heel resting in the heel cup of the LigMaster™. The heel cup was then fastened securely to the ankle as it rested in approximately 30° of plantar flexion. The cushioned pressure actuator placed 3.0 cm proximal to the medial malleolus applied lateral displacement of the leg causing the ankle to rotate passively to end range of motion. The subject was instructed to relax the muscles of the leg while the ankle was passively inverted to the end range of ankle inversion and the degrees of motion were recorded using the digital output from the LigMaster™ device that uses a rotary encoder device within the frame to detect angular displacement with ankle inversion. Once positioned, the US probe was used to acquire an image. The inversion stress was then released following each image and then reapplied to the same end-range position previously determined at the first.
Next, three images were obtained of the ATFL while an anterior drawer stress was applied to the ankle. The subject rested in the sidelying position with a slightly flexed knee and the medial heel resting against the LigMaster™ device. The examiner applied a 125N force with the pressure actuator to the distal tibia resulting in posterior tibial displacement over a fixed foot and ankle joint. The ATFL was then identified with US and an image was taken. The stress was then released, and reapplied until three images were taken and stored for later measurement. US images were stored in digital format for subsequent analysis using ImageJ v. 1.42k software (ImageJ, U. S. National Institutes of Health, Bethesda, MD).
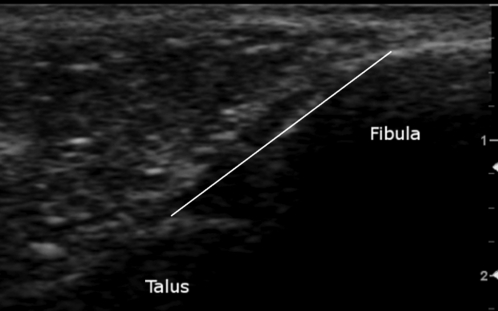
The origin and insertion points of the ATFL were used as bony landmarks during the acquisition of the US images to ensure standardization of the ATFL across different images in a manner similar to previously reported methods.14,5 The anterolateral aspect of the lateral malleolus was identified as the ATFL origin and the peak of the talus was used as the insertion point. The peak of the talus also represents the anterior aspect of the lateral talar articular cartilage and the lateral neck of the talus. These bony landmarks can be identified by their hyperechogenic nature and were verified during ankle movement to ensure that the talar insertion was consistently selected at a similar location across images.16 Figure 4 depicts an example of the US images used in this study.
Figure 4.
US image between the fibula and talus directly over the ATFL. ATFL measurement (mm) is taken from the origin at the anterolateral aspect of the lateral malleolus and ends at the peak of the talus representing the site where the talar neck meets the anterior border of the lateral talar articular surface.
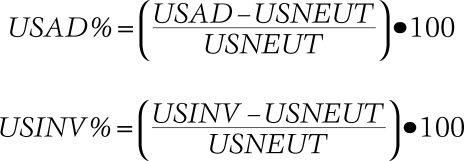
In the measurement of the US images, three examiners independently identified and selected the lateral malleolus origin and talar insertion of the ATFL. A straight-line caliper was used to measure the linear distance (mm) between the landmarks. The US image had a field of view of 13.3 by 10.8 cm in size and 521 by 412 pixels in resolution. To standardize the linear measurement for all images, the digital caliper was calibrated to 13.8 pixels per mm from a scale that appears on each image. The examiners trained in this US technique were blinded to ankle position (neutral, anterior drawer, and inversion) during the measurement process. Each examiner measured each image once, the mean of each of the individual examiner's means were found, and a grand mean was taken from these three means and was used in the final analysis. Normalized length change values are similar to those used by Ozeki et al17 and were calculated from the USNEUT values for both USAD (USAD%) and USINV (USINV%) using these formulae:
 |
Stress ultrasound measurement reliability was assessed by a pilot study that involved measuring the captured images from 20 ankles taken during the three test conditions (180 images). The examiners were two post-professional athletic training masters students with additional training in US to both acquire the images and perform the ATFL measurements with ImageJ software. Each examiner independently measured each image once and a mean ATFL length was calculated for each ankle, at each position. The interexaminer reliability of these position means was calculated from these means.
Intraexaminer reliability was measured by a third examiner who measured the same data set on two different days and the mean ATFL lengths of each ankle, at each position were used to determine the test-retest reliability. The examiner was a physical therapist with 13 years of clinical experience and 5 years of experience with using US. Intraclass correlation coefficients were calculated on the average measures. Intraclass correlation coefficients (ICC3,k) were 0.77 (95% CI: .42, .91) for neutral; 0.91 for anterior drawer (95% CI: .78, .97) and 0.91 for inversion (95% CI: .71, .96) for interexaminer reliability. Intraexaminer reliability was 0.93 for neutral (95% CI: .81, .97), 0.94 for anterior drawer (95% CI: .71, .98) and 0.96 for inversion (95% CI: .89, .98).
Ankle Arthrometer
AA variables were obtained as previously described by Hubbard et al.11,12 The subject was placed in the AA with the heel secured in a specialized cup and a clamp secured over the talus (Figure 5). A pad was placed against the anterior tibia and secured around the leg. The subject was then moved to a supine position with the foot and AA off the edge of the plinth. A stabilization belt was placed over the shank to restrict movement during the exam. Three trials of anterior drawer were performed to 125 N of force and peak anterior displacement (mm) was recorded. The ankle was then inverted three times with 4000 N*mm of torque and the peak amount of inversion displacement was measured in degrees. The mean value of the three trials for each position was used for statistical analysis. These procedures with this device have previously demonstrated inter- and intratester reliability of .80 to .97.4
Figure 5.
Anterior drawer testing and inversion testing as performed with the Hollis ankle arthrometer. Subject is supine with the foot/ankle secured in the device and strapped down to the table frame.
Statistical analysis
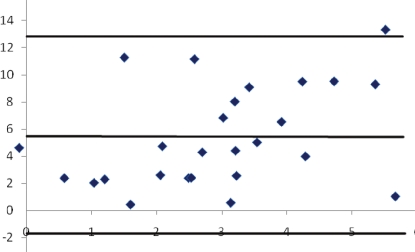
The US dependent variables were USAD mean length, USINV mean length, USAD%, and USINV%. The instrumented arthrometer dependent variables were AAAD (mm) and AAINV (°). A bivariate correlation analysis was used to determine the relationships between the 6 dependent variables. The alpha level was set a priori at p<.05 for all correlation analyses. A Bland-Altman plot was used to determine the limits of agreement between the USAD and AAAD variables.18
RESULTS
Descriptive statistics are shown in Table 2 and correlation analysis results are shown in Table 3. No significant correlations were identified within the primary relationships of interest between AA and US variables. The secondary comparisons of interest between USAD - USINV and USAD% - USINV% were both strongly correlated, as was the AAAD and AAINV comparison. Figure 6 shows the Bland- Altman plot and reveals the mean difference between the USAD mean displacement and the AAAD mean length measurement. The AAAD variables were, on average, 5.38 mm (95% CI: –3.5 to 12 mm) greater than the USAD variables; a nonsignificant finding due to the width of the confidence interval.
Table 2.
Descriptive statistics for all subjects. Represented as mean ± Standard Deviation
| USNEUT (mm) | USAD (mm) | US1NV (mm) | AAAD (mm) | AA1NV (°) | USAD (%) | US1NV (%) |
|---|---|---|---|---|---|---|
| 18.7 ± 0.2 | 19.0 ± 0.2 | 20.1 ± 0.2 | 5.6 ± 2.8 | 25.7 ± 9.1 | 1.7 ± 10.5 | 7.6 ± 9.9 |
AAAD= ankle arthrometry anterior drawer translation; AAINV= ankle arthrometry inversion rotation; USAD= ultrasound length during anterior drawer stress; USAD %,= normalized mean ATFL length change with anterior drawer stress; USNEUT= ultrasound length in neutral ankle position; USINV= ultrasound length during ankle inversion; USINV% = normalized mean length change with inversion stress.
Table 3.
Relationships between dependent variables.
| Comparison | r value (p-value) |
|---|---|
| USAD - AAAD | −.34 (.09) |
| USINV - AAINV | .04 (.85) |
| USAD% - AAAD | −.21 (.30) |
| USINV% - AAINV | −.05 (.82) |
| USAD - USINV | .76 (<.001)* |
| USAD% - USINV% | .76 (<.001)* |
| AAAD - AAINV | .61 (<.001)* |
AAAD= ankle arthrometry anterior drawer translation; AAINV= ankle arthrometry inversion rotation; mm= millimeter; USAD= ultrasound length during anterior drawer stress; USAD %= normalized mean ATFL length change with anterior drawer stress; USINV= ultrasound length during ankle inversion; USINV= normalized mean length change with inversion stress
Correlation is significant at the p<0.01 level (2-tailed).
Figure 6.
Bland Altman plot of ankle arthrometer anterior drawer (AAAD) and ultrasound anterior drawer (USAD) difference from USNEUT. Lines represent the mean difference (5.4 mm) and the 95% confidence interval for the mean difference (−1.9, 12.6 mm).
DISCUSSION
There were no significant correlations between the US and AA variables used during the assessment of anterior drawer or inversion laxity in the four key comparisons of interest. Strong, positive correlations were observed on the three secondary comparisons of interest between USAD and USINV and the AAAD and AAINV variables, respectively; a finding that suggests both the US and AA method are revealing similar patterns of anterior and inversion ankle laxity through two considerably different techniques. The measurement of AAAD tended to be 5.38 mm greater than USAD indicating that each method is quantifying anterior talocrural laxity differently and that the sources of both laxity and error must be considered when evaluating and using both the US and AA method.
The lack of correlation between the US and AA variables may be attributed to the small changes in ligament lengthening in subjects without a history of ankle injury. For example, the mean USAD% was less than 2% in this study. This small amount of excursion may have limited the utility of the Pearson's correlation to detect a relationship between the two variables in this sample. Jeys et al19 indicated that normal ankle ligament changes with motion are less than 5%. If the normal ligament is lengthening only a small amount from its resting length in a neutral position, then a linear correlation may not exist, particularly when evaluated at a single absolute load of 125 N. The relationship may differ in ankles with ATFL injuries that exhibit increased lengthening due to injury. The subjects in the current study were healthy individuals with no history of ankle injury. Healthy subjects were used since this study was the first to explore a relationship between these devices and the authors did not want any displacement or laxity measurements to be affected by pain during testing. It was hypothesized that as the USAD displacement value increased, the AAAD length measurement would increase, but the results did not support that hypothesis. Analyzing this relationship with a Bland-Altman plot, the AAAD consistently produced 5 mm more translation in comparison to USAD. The current US measurements of mean ATFL lengths were similar to those described in both anatomical and MRI studies.14,20 Also consistent with current findings reported in Table 2, were the findings of de Asla et al20 who reported in-vivo ATFL length changes in healthy ankles from 16 mm in neutral to 20.8 mm during active ankle plantar flexion and supination motion using MRI. ATFL length was found in the de Asla et al study by measuring the linear distance between the centroids of both the lateral malleolus and talus at different positions of ankle active motion using 4 healthy ankles. Significant changes in length of the ATFL were observed with the supinated position, which was similar to the inversion position used in this study.
The AA and the US methods used in this study have four key differences that may explain the inability to identify relationships between the ankle laxity variables. First, The AA uses digital sensors that are placed away from the talocrural joint on a footplate and a tibia pad. This arrangement allows for subtalar motion, soft tissue compressibility and leg motion to be captured resulting in additional movement and systematic error that is not captured with an US image. Second, the US uses a two-dimensional image of the ligament from origin to insertion. While the stress applied to the ankle during US imaging is similar to that used during the AA method, the US image (and relative changes between positions) isolates changes to predominantly talofibular motion. US measurements taken between the talus and fibula do not account for subtalar motion that the AA device measurement includes, both in anterior displacement and inversion.9 Third, the subject is supine with the knee in 0° of flexion and 0° of plantarflexion during the AAAD test and in sidelying with the knee slightly flexed to approximately 30° during the USAD condition. The extended knee position may increase the passive muscle tension from the gastrocsoleus complex and thereby alter ankle laxity and stiffness.21 Finally, the rate and duration of joint loading used was different between the two stress devices. The magnitude of loading was similar (125 N) for both devices, but the AAAD requires the examiner to load the ankle joint at a rate of approximately 30 N/sec while, during the USAD exam, the rate of joint loading is only 10–12 N/sec using the LigMaster™ device. The ankle then remains at a constant load of 125 N until the examiner can capture an ATFL image, a process that may take 15–30 seconds, possibly allowing tissue creep to occur. These same issues are present during the inversion testing which may similarly account for differences between these variables. The contributions of these factors help explain the differences between these variables of ankle laxity.
When comparing the AAAD with the AAINV variable a strong, positive correlation was found. This correlation indicates that as the displacement increases in the AAAD, that a corresponding increase in the degrees of AAINV rotation occurs in healthy ankles. This may occur to a greater degree in subjects with greater physiological laxity. Kovaleski et al also tested AAAD and AAINV both before and after sectioning of the ATFL and CFL in cadaver ankles and observed changes in inversion rotation after sectioning of the ATFL, suggesting that increases in anterior displacement are accompanied by concomitant increases in inversion rotation.4 Hubbard et al found that AAAD and AAINV were both effective at measuring ankle laxity and indicated that similar changes in both inversion degrees of motion and anterior displacement existed between healthy and ankle-injured subjects, even in subjects suspected of having only ATFL injuries without CFL involvement.10 Similarly, these results found a strong positive correlation when analyzing the USAD and USINV variables. This is an interesting finding in context of the AAAD and AAINV relationship and suggests that while the AA appears to measure the laxity of the entire ankle complex (talocrural and subtalar joints) the US methods focus upon ATFL changes and talofibular motion alone. A strong positive correlation was also revealed when comparing the USAD% normalized length with the USINV% normalized length and suggests that the normalized ATFL length changes visualized with US reflect similar relationships between each other as do previously validated methods of mechanical arthrometry.
Previous authors have reported AA results in healthy subjects and those with ankle instability in terms of total anteroposterior and inversion-eversion displacement.9,22 The present study measured the only mean maximum anterior displacement and mean inversion rotation and observed 5.64 ± 2.79 mm of anterior translation in healthy ankles and a mean inversion rotation of 25.6 ± 9.0°. Hubbard et al22 reported total anteroposterior translation of 18 ± 4 mm and inversion rotation of 32 ± 3°.22 The combination of anteroposterior or inversion-eversion displacements were not used because the authors' interest was not with anteroposterior laxity, but merely the direction-specific laxity in the anterior and inversion motions in order to make comparisons to the US variables.
This authors of the current study evaluated the mean anterior displacement using AA against the mean anterior displacement as measured between two bony landmarks rendered on an US image. While theoretically related, each procedure has sources of error that occur which may be of different magnitude. Such uncontrollable sources of error are limitations of this study. Also, a limitation noted is that healthy subjects were included who do not have a history of capsuloligamentous ankle injuries and the “normal” laxity present may be small thus limiting the applicability of the Pearson product moment correlation as a method to characterize any hypothesized relationships. Further investigations that attempt to characterize the relationship between these two methods for quantifying ankle laxity should consider methods that use a range of applied loads and degrees of motion.
Conclusion
Variables of ankle laxity from the US and AA images were not directly correlated when measuring inversion and anterior laxity in healthy ankles. The lack of correlation between the USAD and AAAD variables may stem from unique aspects of each measurement device such as differences in subject positioning, sources of measurement error, and the rate of ankle joint loading. Additionally, the AA quantifies total ankle joint complex displacement while the US method specifically isolates changes to the talofibular aspect of the talocrural joint. Thus in healthy ankles, it appears that the US method and AA are not measuring the same components of ankle joint laxity. Future studies should examine the use of these two assessment techniques in ATFL-injured subjects to examine the relationship between measured variables.
REFERENCES
- 1. Oae K, Takao M, Uchio Y, Ochi M. Evaluation of anterior talofibular ligament injury with stress radiography, ultrasonography and MR imaging. Skeletal Radiol. Aug 15 2009;39(1):41–47 [DOI] [PubMed] [Google Scholar]
- 2. Valderrabano V, Hintermann B, Horisberger M, Fung TS. Ligamentous posttraumatic ankle osteoarthritis. Am J Sports Med. 2006;34(4):612–620 [DOI] [PubMed] [Google Scholar]
- 3. Colville MR, Marder RA, Boyle JJ, Zarins B. Strain measurement in lateral ankle ligaments. Am J Sports Med. March 1, 1990 1990;18(2):196–200 [DOI] [PubMed] [Google Scholar]
- 4. Kovaleski JE, Hollis J, Heitman RJ, Gurchiek LR, Pearsall AW. Assessment of ankle-subtalar-joint-complex laxity using an instrumented ankle arthrometer: an experimental cadaveric investigation. J Athl Train. Dec 2002;37(4):467–474 [PMC free article] [PubMed] [Google Scholar]
- 5. Glaser F, Friedl W, Welk E. [The value of ultrasound in the diagnosis of capsule ligament injuries of the upper ankle joint]. Unfallchirurg. Nov 1989;92(11):540–546 [PubMed] [Google Scholar]
- 6. Campbell DG, Menz A, Isaacs J. Dynamic ankle ultrasonography: a new imaging technique for acute ankle ligament injuries. Am J Sports Med. 1994;22(6):855–858 [DOI] [PubMed] [Google Scholar]
- 7. Fujii T, Luo ZP, Kitaoka HB, An KN. The manual stress test may not be sufficient to differentiate ankle ligament injuries. Clin Biomech (Bristol, Avon). Oct 2000;15(8):619–623 [DOI] [PubMed] [Google Scholar]
- 8. Lohrer H, Nauck T, Arentz S, Scholl J. Observer reliability in ankle and calcaneocuboid stress radiography. Am J Sports Med. Jun 2008;36(6):1143–1149 [DOI] [PubMed] [Google Scholar]
- 9. Kovaleski JE, Gurchiek LR, Heitman RJ, Hollis JM, Pearsall AW. Instrumented measurement of anteroposterior and inversion-eversion laxity of the normal ankle joint complex. Foot Ankle Int. Dec 1999;20(12):808–814 [DOI] [PubMed] [Google Scholar]
- 10. Hubbard TJ, Cordova M. Mechanical instability after an acute lateral ankle sprain. Arch Phys Med Rehabil. Jul 2009;90(7):1142–1146 [DOI] [PubMed] [Google Scholar]
- 11. Hubbard TJ. Ligament laxity following inversion injury with and without chronic ankle instability. Foot Ankle Int. Mar 2008;29(3):305–311 [DOI] [PubMed] [Google Scholar]
- 12. Hubbard TJ, Hicks-Little CA. Ankle ligament healing after an acute ankle sprain: an evidence-based approach. J Athl Train. Sep-Oct 2008;43(5):523–529 [DOI] [PMC free article] [PubMed] [Google Scholar]
- 13. Fessell DP, Vanderschueren GM, Jacobson JA, et al. US of the ankle: technique, anatomy, and diagnosis of pathologic conditions. Radiographics. 1998;18(2):325–340 [DOI] [PubMed] [Google Scholar]
- 14. Brasseur JL, Luzzati A, Lazennec JY, Guerin-Surville H, Roger B, Grenier P. Ultrasono-anatomy of the ankle ligaments. Surg Radiol Anat. 1994;16(1):87–91 [DOI] [PubMed] [Google Scholar]
- 15. Childress S, Croy T, Hertel J, Saliba S. Comparison of low and high frequency ultrasound imaging in the measurement of anterior talofibular ligament length. National Athletic Trainers' Association Annual Meeting & Clinical Symposium, June 2011,. Vol 46 New Orleans, LA: Journal of Athletic Training; 2011:S12 [Google Scholar]
- 16. De Maeseneer M, Marcelis S, Jager T, et al. Sonography of the normal ankle: a targeted approach using skeletal reference points. Am. J. Roentgenol. 2009;192(2):487–495 [DOI] [PubMed] [Google Scholar]
- 17. Ozeki S, Yasuda K, Kaneda K, Yamakoshi K, Yamanoi T. Simultaneous strain measurement with determination of a zero strain reference for the medial and lateral ligaments of the ankle. Foot Ankle Int. Sep 2002;23(9):825–832 [DOI] [PubMed] [Google Scholar]
- 18. Smith MW, Ma J, Stafford RS. Bar charts enhance Bland-Altman plots when value ranges are limited. J Clin Epidemiol. Feb 2010;63(2):180–184 [DOI] [PMC free article] [PubMed] [Google Scholar]
- 19. Jeys L, Korrosis S, Stewart T, Harris NJ. Bone anchors or interference screws?: A biomechanical evaluation for autograft ankle stabilization. Am J Sports Med. 2004;32(7):1651–1659 [DOI] [PubMed] [Google Scholar]
- 20. de Asla RJ, Kozanek M, Wan L, Rubash HE, Li G. Function of anterior talofibular and calcaneofibular ligaments during in-vivo motion of the ankle joint complex. J Orthop Surg Res. 2009;4(7):1–6 [DOI] [PMC free article] [PubMed] [Google Scholar]
- 21. Kovaleski JE, Norrell PM, Heitman RJ, Hollis JM, Pearsall AW. Knee and ankle position, anterior drawer laxity, and stiffness of the ankle complex. J Athl Train. May-Jun 2008;43(3):242–248 [DOI] [PMC free article] [PubMed] [Google Scholar]
- 22. Hubbard TJ, Kaminski TW, Vander Griend RA, Kovaleski JE. Quantitative assessment of mechanical laxity in the functionally unstable ankle. Med Sci Sports Exerc. May 2004;36(5):760–766 [DOI] [PubMed] [Google Scholar]


