Abstract
Background
Protein supplements are routinely used after a laparoscopic gastric bypass (LGB). The aim of this study is to evaluate the impact of an amino acid supplement on glucose homeostasis, hormonal and inflammatory markers after LGB.
Methods
30 patients undergoing LGB were randomized to receive or not to receive 24g of an oral supplement containing a leucine metabolite, glutamine and arginine twice daily for 8 weeks. Changes in weight, BMI, ghrelin, GLP-1, GIP, glucose, insulin, C-peptide, insulin sensitivity, IL-6, CRP, leptin and IGF-1 were assessed preoperatively, 2 weeks and 8-weeks postoperatively.
Results
30 patients (96.7% females, 46.9 ± 8.4 years, 113.4 ± 11.6 kg and BMI 43.3 ± 4.1 kg/m2) were randomized. The experimental (N=14) and control groups (N=16) were not significantly different at baseline. Weight and BMI were decreased significantly at two weeks and at eight weeks (p<0.0001 for each variable), but no statistical significance was observed between the two groups. Fasting glucose decreased significantly at 2 & 8 weeks as compared to base line (p<0.0001) with no difference between experimental and control groups (p=0.8), but insulin and calculated insulin sensitivity, that were similar at baseline, become significantly worse in the experimental group 8 weeks after surgery ( p=0.02 for insulin, p=0.04 for the homeostasis model assessment (HOMA) index). CRP, which was similar at baseline, was found to be significantly lower at 8 weeks in control vs. experimental group, (P=0.018). IL-6 decreased significantly from baseline at 2 weeks and rebounded at 8 weeks in both groups, there was a trend of higher IL-6 in the experimental group that becomes significant at 8 weeks (p=0.05). Leptin and IGF-1 levels decreased significantly from baseline at 2 & 8 weeks (p<0.0001) but there was no difference between the two groups. No significant change in GLP-1, ghrelin or GIP were noticed after 8 weeks.
Conclusion
An amino acid supplement had no effect on the early postoperative incretins following LGB. It may have a negative influence on glycemic control and degree of inflammation. Future studies are needed to clarify these effects.
Keywords: Gastric bypass, Amino Acid supplement, Insulin sensitivity CRP, IL-6, IGF-1, leptin, Ghrelin
Introduction
Bariatric surgery is currently the only effective means for achieving substantial and sustained long-term weight loss in the morbidly obese. Roux-en-Y gastric bypass (RYGB), the most commonly performed bariatric operation in the United States, includes both restrictive and malabsorptive components. Limited capacity of the gastric pouch, intolerance of meat in the early postoperative period and more distal mixing with biliopancreatic secretion are some of the reasons to be concerned about possible protein malnutrition following RYGB. Protein malnutrition carries substantial morbidities for patients including hypoalbuminemia, immune anergy, electrolyte and mineral imbalance, anasarca and muscle wasting. In order to avoid protein malnutrition, the current ASMBS recommendations (1) and the common practice is to supplement the patient’s protein intake during the early postoperative period.
Insulin resistance that can lead to impaired glucose tolerance and type 2 diabetes mellitus (T2DM) is a prominent feature of obesity (2, 3). Obesity is also associated with an increased lowgrade inflammatory tone as evidenced by increased levels of pro-inflammatory cytokines that can subsequently lead to insulin resistance (4–6). There is a large and growing body of literature concerning the beneficial metabolic and hormonal changes resulting from RYGB. Some of the most important changes are improved fasting glucose and insulin sensitivity (IS) (2,3,7–10), decreased systemic inflammation (11), changes in appetite and hunger related hormones (ghrelin, leptin) and changes in incretins like glucagon like peptide-1 (GLP-1) and gastric inhibitory polypeptide (GIP). These changes may play an important role in the dramatic improvement in many of the patients’ comorbidities, especially T2DM (12). This metabolic improvement, not just weight loss, has become one of the main goals of the operation. Since the routine use of hyperinsulinemic clamp, the gold standard of insulin sensitivity, is not practical, several surrogate indices for IS have been developed using fasting glucose and insulin. Presently, the homeostasis model assessment (HOMA) index is the most widely used followed by quantitative insulin sensitivity check index (QUICKI), and both have been broadly evaluated (13, 14). C-reactive protein (CRP) is a useful indicator of inflammatory processes (15). Interleukin (IL)-6 is a key cytokine with impact on both immunoregulation and nonimmune events in most tissues (16). A vast number of epidemiological, genetic, rodent and human studies have investigated the putative role of inflammation as expressed by CRP and IL-6 in the pathogeneses of obesity, insulin resistance and T2DM (17–19).
There are many commercially available protein supplements for consumption after RYGB. These protein supplements contain various amounts and compositions of amino acids. Dietary amino acids have been shown to affect both glucose homeostasis and systemic inflammation (20–22). The supplemented amino acids have the potential to alter some or all of the hormonal and metabolic changes following RYGB. It isn’t currently clear whether such effects are taking place.
We have previously reported that the use of a commercially available oral amino acid supplement composed of beta-hydroxy-beta-methylbutyrate (a leucine metabolite), glutamine and arginine (HMB/Glu/Arg) had no effect on the changes in weight, resting energy expenditure, lean body mass or fat mass during the early post operative period after LGB (23). The purpose of this study was to describe the alternations in glucose homeostasis, inflammatory markers, hormones and incretins related to the use of HMB/Glu/Arg supplements following LGB.
Materials and Methods
This was an unblinded, randomized control pilot study on a population of 30 morbidly obese patients (as defined by NIH criteria) who underwent LGB. The patients were consented and enrolled in this institutional review board-approved protocol. Exclusion criteria included age younger than 18 years, pregnancy, weight greater than the limit of the dual emission x-ray absorptiometry (DXA) table (300 lb) and a known allergy to any component of the supplement. Postoperatively, all patients were instructed to take an adult strength, chewable multivitamin with iron and 1,200 mg of elemental calcium citrate daily for postoperative supplementation. Each patient received a monetary incentive in a graduated manner to participate and complete the protocol. Patients in the experimental group (n = 14) were provided with a supply of a commercially available oral supplement containing HMB/Glu/Arg at no cost. The patients were instructed to consume 24 g (1 packet) of the mixture dissolved in 8–10 ounces of water twice daily and record their consumption on a log sheet. Each packet of the supplement contains 1.5 g of calcium beta-hydroxy, beta-methylbutyrate (which provides 1.2 g of HMB), 7 g of glutamine, 7 g of arginine, 2 g of sugar, 7.8 g of carbohydrates, and 78 calories. At the three time points (before surgery, two weeks and 8 weeks after surgery) the patients were admitted to a clinical research center on the evening before the planned evaluation. In the morning following an overnight fast of at least 8 hours, venous blood was drawn for analysis, and the patients underwent an evaluation of weight, body composition and energy expenditure. The details concerning the measurements of weight, lean body mass (LBM) and fat mass (by dual emission x-ray absorptiometry) and resting metabolic rate (RMR) by indirect calorimetry using a Deltatrac II metabolic monitor are discussed in detail elsewhere (23).
Concentrations of serum variables were determined in the Core Laboratory of the GCRC (now Center for Clinical and Translational Science; CCTS), Nutrition Obesity Research Center (NORC), and Diabetes Research and Training Center (DRTC). Glucose was measured in 3 μL sera using the glucose oxidase method on a Stanbio Sirrus analyzer (Stanbio Laboratory, Boerne, TX). CRP was measured in 20 μL sera using a turbidometric method on a Stanbio Sirrus analyzer (Stanbio Laboratory, Boerne, TX). Insulin was assayed in 50 μL aliquots using immunofluorescence on a TOSOH AIA-II analyzer (TOSOH Corp., South San Francisco, CA). C-peptide was assayed in 20 μL aliquots using the TOSOH analyzer. Leptin was measured by radioimmunoassay (Linco/Millipore; St. Charles, MO). GIP and GLP-1 were analyzed in duplicate by ELISA (Linco/Millipore, St. Charles, MO) in 20 μL and 100 μL sera, respectively. Ghrelin was measured in duplicate 20 μL aliquots of sera by radioimmunoassay (Linco/Millipore). IGF-1 was measured in duplicate 20 μL aliquots of sera by immunoradiometric assay (DSL/Beckman-Coulter, Webster, TX).
In order to avoid bias, patients receiving either oral hypoglycemic agents or insulin were excluded from the glycemic control related calculations (fasting glucose, insulin, C-peptide, and insulin sensitivity). Of the 30 patients, 9 were excluded (5 control and 4 study groups) for this reason. All results are expressed as means ± standard deviation. The graphs represent mean ± standard error. Patient characteristics at baseline were analyzed using Fisher’s exact test and two independent samples t test as appropriate. After checking for normality assumptions, the paired t test was used to compare preoperative values to 2-week and 8-week values separately in both groups. A one-way analysis of variance (ANOVA) was used to determine whether the mean changes in postoperative parameters were significant between the experimental and control group. Independent unpaired t test was used to determine at which time point the difference became significant. All p values were considered statistically significant at <0.05 alpha levels. Analyses were done using PASW statistics, SPSS version 18.0.0. Figures were performed using GraphPad Prism, version 5.02, GraphPad Inc. The formulas for calculated insulin sensitivity are: HOMA = [Glucose (mg/dl)]×[insulin (mIU/L)]/405 and QUICKI =1/ log [Glucose (mg/dl)]× log [insulin (mIU/L)].
Results
Thirty morbidly obese subjects were included in the study. Fourteen patients were randomized to the experimental group and sixteen to the control group. Baseline demographics and characteristics of experimental and control groups are summarized in Table 1, and no significant differences were observed in any of the baseline variables. As reported previously (23), weight, BMI, LBM and RMR were decreased significantly at two weeks and at eight weeks, but no statistically significant difference was observed between the two groups (Table 2).
Table 1.
Demographics at baseline
| Variable | Total (N=30) | Study (n= 14) | Control (n=16) | P value |
|---|---|---|---|---|
| Age (years) | 46.9 ± 8.4 | 47.9 ± 9.6 | 46 ± 7.5 | NS |
| Gender, n (%) Female | 29 (96.7%) | 14(100%) | 15(93.8%) | NS |
| Male | 1 (3.3%) | 0 | 1(6.2%) | NS |
| Race, n (%) White | 24 (80%) | 11(78.6%) | 13(81.2%) | NS |
| African American | 6 (20%) | 3(21.4%) | 3(18.8%) | NS |
Table 2.
Changes in weight, BMI, Fat mass lean mass and energy expenditure in the control and study populations
| Control group N=16 | Experimental group N=14 | |||||
|---|---|---|---|---|---|---|
| Baseline | Two weeks | Eight Weeks | Baseline | Two weeks | Eight Weeks | |
| Weight | 112.8 ±12.3 | 106.1 ± 12.6 | 97.2± 12.4 | 114.0 ± 11.1 | 107.0 ± 11.3 | 98.2 ± 11.4 |
| BMI | 43.6 ± 4.2 | 41.0 ± 4.3 | 37.5 ± 4.2 | 42.9 ± 4.1 | 40.3 ± 4.3 | 37.0 ± 4.3 |
| FM | 55.4 ± 8.3 | 53.9 ± 8.9 * | 47.5 ± 8.8 | 58.7 ± 7.9 | 56.4 ± 8.9 | 49.5 ± 8.8 |
| LM | 54.0 ± 8.1 | 48.2 ± 7.5 | 46.1 ± 6.0 | 52.4 ± 6.9 | 46.8 ± 5.6 | 44.7 ± 5.9 |
| RMR | 1848 ± 299.4 | 1589 ± 236.2 | 1554 ± 146.0 | 1799 ± 280.5 | 1610 ± 212.3 | 1512 ± 188.4 |
Weight –kg, BMI –body mass index in kg/m2, FM fat mass in kg, LM –Lean mass in kg, RMR –resting metabolic rate in kcal/day Values are mean±SD. All P values comparing study to control groups are NS, Comparing values at 2 and 8 weeks to baseline all P values <0.05 unless specified by *
Glycemic Control
After the exclusion of the T2DM patients, there were 11 and 10 patients left in the control and study groups, respectively, for glycemic evaluation. There was no significant difference in baseline demographics, weight, BMI, LBM, fat mass and energy expenditure between the two groups.
Whole study population (N=21)
The mean fasting glucose of the 21 non-diabetic patients decreased significantly from 113.1±14.4 mg/dl at baseline to 95.1±15.1 mg/dl and 95.0±9.8 mg/dl after 2 and 8 weeks respectively (both p<0.0001 when compared to baseline). Both mean fasting insulin and C-peptide levels decreased at two weeks (Insulin 16.8±7.6 uU/ml, to 12.6±16.8 uU/ml, C-peptide 3.2±1.1 ng/ml to 2.5±1.8 ng/ml), but the change was only significant for C-peptide (P=0.017) and not for insulin (p=0.2). Although the insulin at two weeks dropped in 13 patients, it was increased in 4 patients and remained stable in other 4 patients. At 8 weeks both insulin and C-peptide decreased significantly when compared to baseline (16.8±7.6 uU/ml, vs. 7.4±4.6 uU/m, and 3.2±1.1 ng/ml vs. 1.89±0.8 ng/ml, p<0.0001 for both, respectively).
Experimental vs. control groups
Fasting glucose, insulin, C-peptide and insulin sensitivity values improved significantly during the 8 weeks followup in both groups (Table 3). When comparing the study and control groups as a whole using the ANOVA, no significant differences were seen in fasting glucose (P=0.80), but the insulin was significantly higher in the experimental group (p=0.026). Insulin concentration dropped sharply by 41.5% at two weeks compared to the baseline (14.8±7.2 uU/m, vs. 7.6±3.4 uU/m, p=0.0016) in the control group but it decreased only by 6.9% in the study group (19.0±7.8 uU/m, vs. 18.1±23.4 uU/m, p=0.90). At 8 weeks, the fasting insulin concentration decreased by 60.3% in the controls and 44.4% in the study group, compared to baseline, both statistically significant (p=0.029, p<0.0001 respectively). When comparing the groups’ insulin level at each time point separately using the non parametric t-test, the insulin level in the study group becomes significantly higher compared to the control group at 8 weeks (p=0.21, 0.16 and 0.02 for baseline, 2 and 8 weeks respectively). C-peptide levels demonstrated a trend similar to insulin with a higher C-peptide levels in the study group (table 3), but the difference approached, but did not reach, statistical significance (p=0.057).
Table 3.
Comparison to Baseline of Glycemic Variables for non-diabetic patients in each Group
| Control Group N=11 | Experimental group N=10 | |||||||||
|---|---|---|---|---|---|---|---|---|---|---|
| Baseline | 2 weeks | 8 weeks | Baseline | 2 weeks | 8 weeks | |||||
| Glucose | 114.1±16.2 | 94.7±17.6 | P<0.001 | 95.9±10.5 | P<0.001 | 112.1±12.8 | 95.6±12.6 | P=0.01 | 94.0±9.4 | P<0.01 |
| Insulin | 14.8±7.2 | 7.58±3.4 | P<0.01 | 5.3±2.9 | P<0.001 | 19.0±7.8 | 18.11±23 | NS | 9.7±5.1 | P<0.01 |
| C | 2.98±0.9 | 1.98±0.8 | P<0.001 | 1.65±0.46 | P<0.001 | 3.46±1.4 | 3.04±2.4 | NS | 2.15±1.04 | P<0.001 |
| Peptide | 4.20±2.22 | 1.85±1.03 | P=0.002 | 1.28±0.73 | P<0.001 | 5.38±2.51 | 4.55±6.2 | NS | 2.32±1.37 | P<0.01 |
| HOMA | 0.71±0.12 | 0.58±0.13 | P=0.002 | 0.48±0.14 | P<0.001 | 0.77±0.09 | 0.69±0.14 | NS | 0.63±0.09 | P<0.01 |
Glucose - mg/dl, Insulin-µU/ml, C Peptide –ng/ml All values are Mean ± SD, all P Values are comparing to baseline.
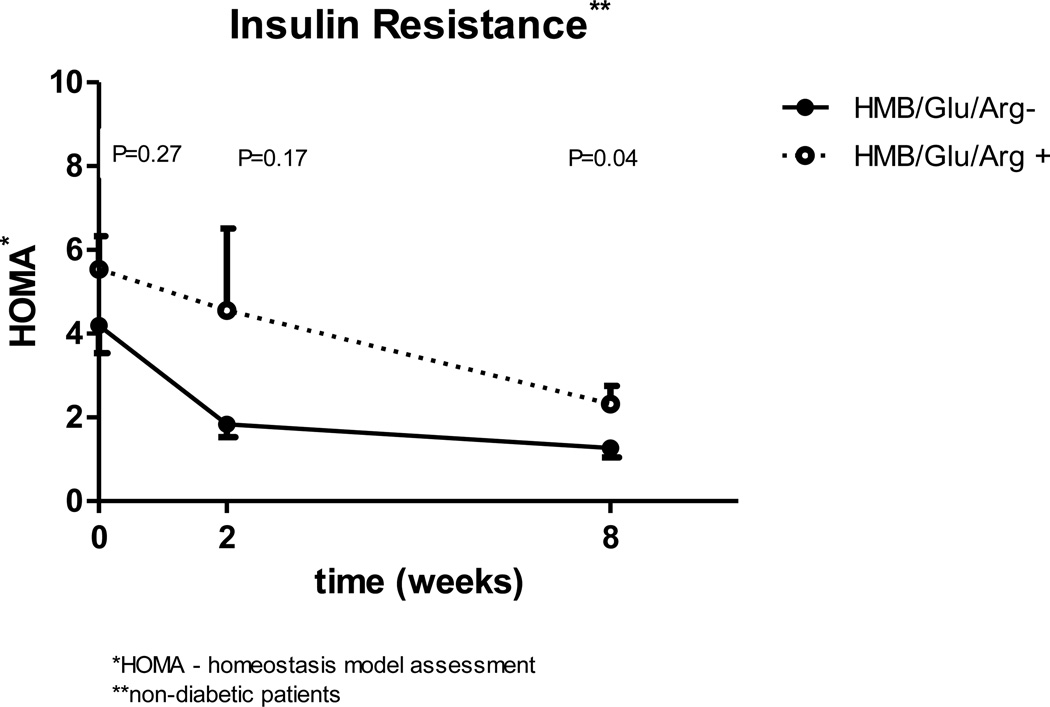
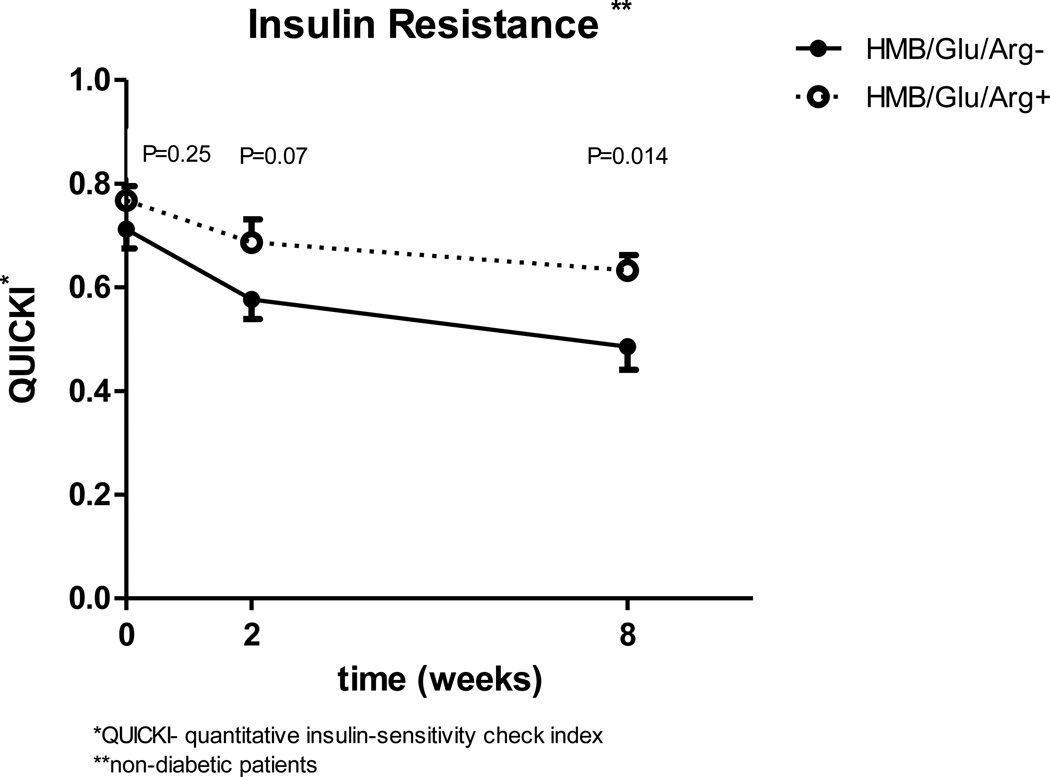
When the two groups were compared for calculated insulin sensitivity taking in to account the three time points, the study group has worse insulin sensitivity. The difference is significant for both QUICKI (p=0.005) and HOMA (p=0.04) parameters. Comparing the groups insulin sensitivity for each of the three time points separately, demonstrates that the two groups had a similar baseline HOMA and QUICKI (HOMA 4.2 vs 5.5 [p=0.27] QUICKI 0.71 vs 0.76 [p=0.25] for control and study groups respectively). At two weeks, (Fig 1, 2) there is a favorable change in insulin sensitivity in the control group which is not statistically significant from the study group (p=0.17 for HOMA and p=0.07 for QUICKI), but the difference continues to grow and it becomes statistically significant after 8 weeks (p=0.04 for HOMA and p=0.014 for QUICKI).
Figure 1.
Figure 2.
Inflammatory markers
Whole study population
C-reactive protein (CRP) and interleukin-6 (IL-6) were the inflammatory markers measured. A substantial drop in both was observed two weeks after surgery in the 30 subjects (Table 4). The plasma CRP level dropped by an average of 27.3%±8.8% and that of IL-6 dropped by 24±6.8% at two weeks, both of which were statistically significant compared to baseline. After 8 weeks, the CRP plasma level had declined by 34.6%±10.3% from baseline (p<0.001). However unlike the CRP, the IL-6 level recovered partially at 8 weeks, and the observed mean change from baseline was reduced to 8.2±6.8% (p=0.07).
Table 4.
Comparison to Baseline of Inflammatory Markers N=30
| Baseline | Two weeks | P Value | 8 weeks | P Value | |
|---|---|---|---|---|---|
| CRP mg/L | 12.2±7.2 | 8.97±7.47 | P=0.003 | 8.2±7.4 | P<0.001 |
| IL-6 pg/ml | 2.9±1.76 | 1.9±0.93 | P=0.002 | 2.4±1.24 | P=0.074 |
All values are Mean±SD, P Value –compared to baseline
Experimental vs. control
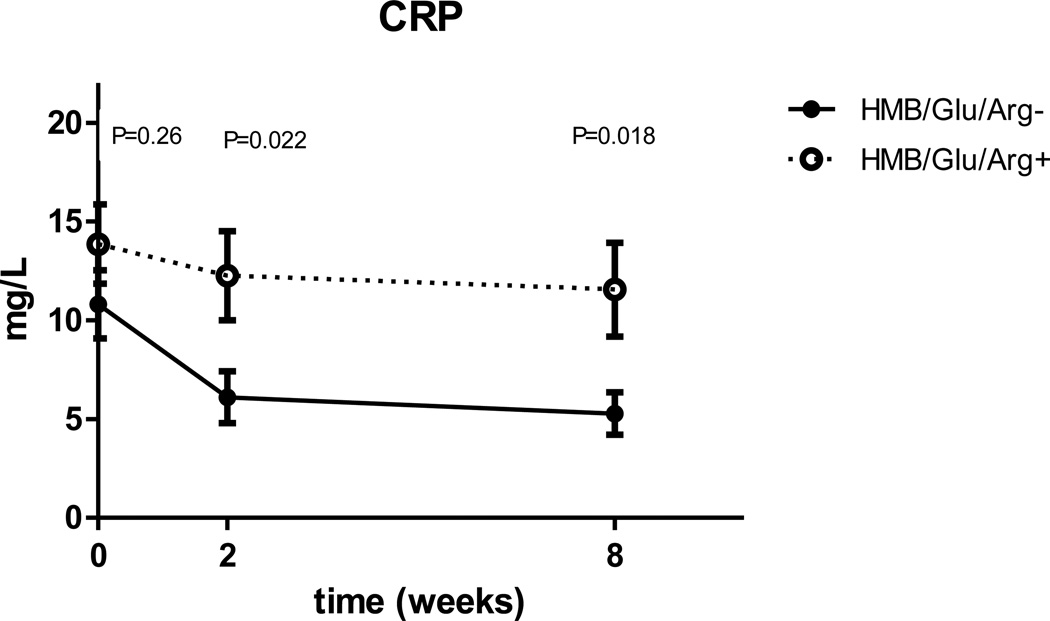
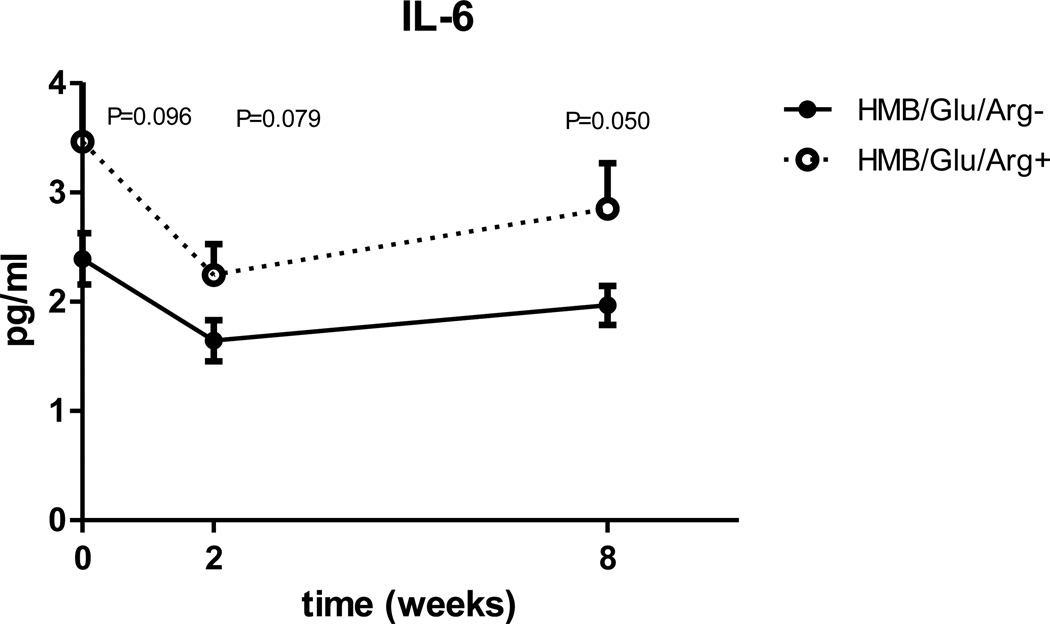
Both groups demonstrated a similar course (a drop in CRP, and an initial drop followed by partial rebound of IL-6 levels, Fig. 3, 4) but when comparing the inflammatory markers, using the ANOVA, the study group had significantly higher CRP (p=0.01) and IL-6 (p=0.03) When looking in to the changes in inflammatory markers at each time point, the difference between the groups reaches significance at two and 8 weeks after surgery for CRP (Fig 3) and at 8 weeks for IL-6 (Fig 4).
Figure 3.
Figure 4.
Incretins and Hormones
Whole study population
A significant drop of IGF-1 and leptin (Table 5) was demonstrated at both two and 8 weeks when compared to baseline. The mean ghrelin concentration decreased from 718 pg/ml at baseline to a 607±219 pg/ml at two weeks (p=0.03). However, although ghrelin concentration at 8 weeks remained lower than baseline (639±240 pg/ml), the change was no longer statistically significant (p=0.2). No change in fasting GIP or GLP-1 was demonstrated (Table 5).
Table 5.
Comparison to Baseline of Hormones and Incretins N=30
| Factor | Baseline | Two Weeks | P Value | 8 weeks | P value |
|---|---|---|---|---|---|
| IGF-1 ng/ml | 218±66 | 169±77 | P=0.002 | 157±71 | P<0.0001 |
| Leptin uU/ml | 39.2±9.7 | 27.7±9.8 | P<0.0001 | 20.6±8.0 | P<0.0001 |
| Ghrelin pg/ml | 718±369 | 607±219 | P=0.035 | 639±240 | NS |
| GLP-1pmol/L | 3.4±4.4 | 3.1±3.3 | NS | 3.3±5.5 | NS |
| GIP pg/ml | 53±28 | 61±27 | NS | 55±29 | NS |
All Values are mean±SD, P Value in comparison to baseline.
Experimental vs control
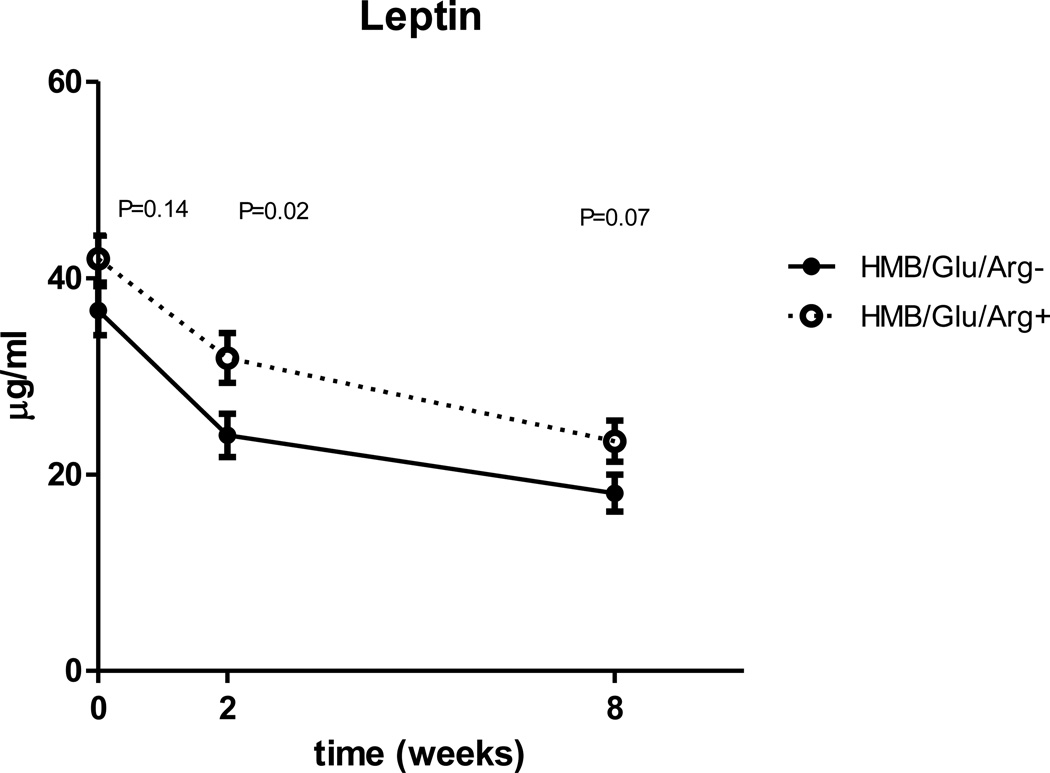
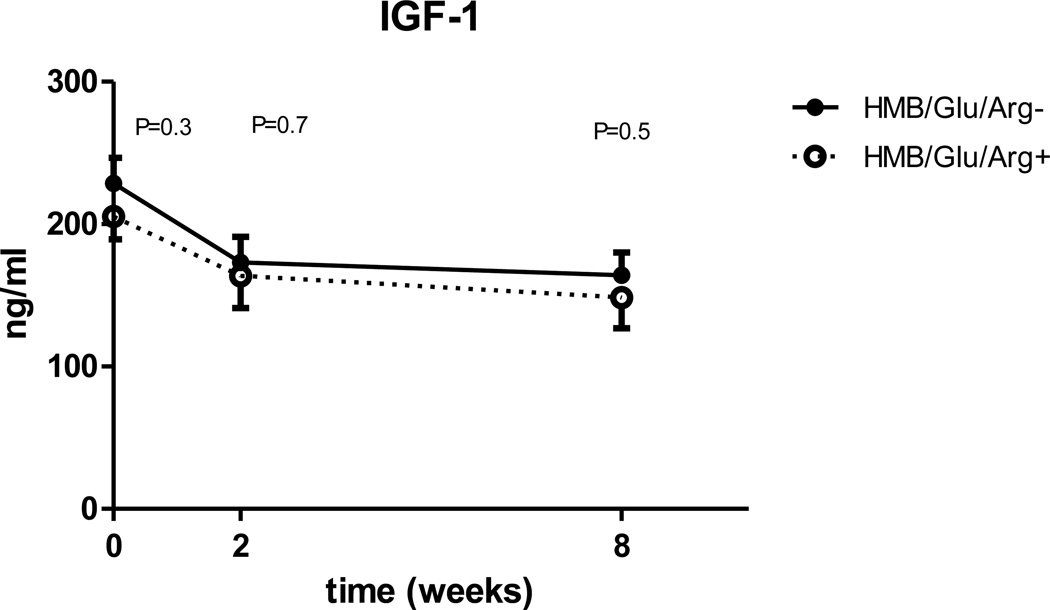
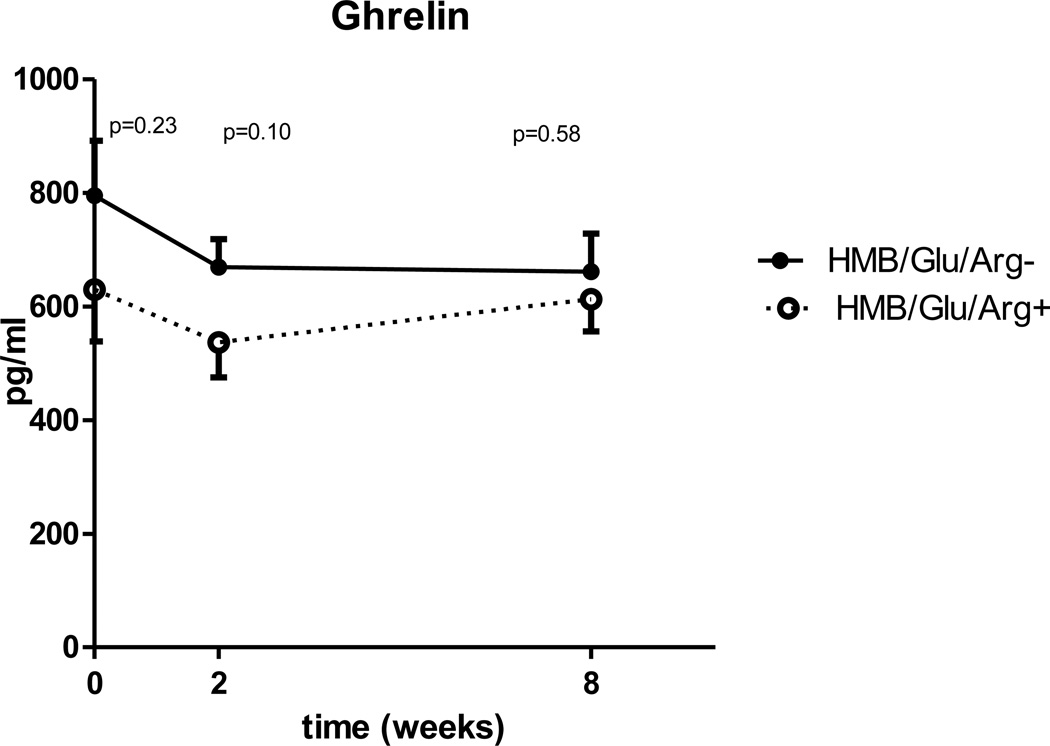
When compared for all three time points, leptin is significantly higher in the experimental group (p=0.014), but unlike insulin sensitivity and inflammatory markers the difference between the groups doesn’t expand with time (fig 5). There is a trend for lower IGF-1 and ghrelin in the experimental group, but the changes are not statistically significant (Fig. 6, 7). No differences were observed in GLP-1 or GIP mean concentrations between the control and experimental groups (table 5).
Figure 5.
Figure 6.
Figure 7.
Discussion
During the last decade there has been an intense interest in the metabolic changes associated with bariatric surgery in general and in RYGB specifically. The improvement of the metabolic comorbidities associated with morbid obesity (diabetes, dyslipidemia, hypertension etc.) has perhaps become the primary objective of the operation. The most intriguing metabolic changes described are the decrease in insulin resistance, decrease in chronic inflammation, changes in gut incretin secretion and the lower levels of appetite and energy balance related hormones including ghrelin, leptin, insulin and IGF. The aim of this study was to describe the influence of a dietary supplement containing arginine, glutamine and the leucine metabolite (HMB) on the metabolic and hormonal changes during the early period after LGB.
Our population demonstrated an early (two weeks) significant decrease in fasting glucose, insulin, C-peptide and inflammatory markers. At eight weeks, the fasting glucose stabilized within the normal range, but a further decrease in insulin concentration translated into continued improvement in calculated insulin sensitivity (HOMA, QUICKI). Unlike the continued significant decline in CRP levels between 2 and 8 weeks, we observed a rebound of mean plasma IL-6 at 8 weeks. This intriguing difference in the trend of two inflammatory markers has been reported earlier by other investigators as well. Vázquez et al reported no change in IL-6 or TNF alpha, but they noted a significant drop in CRP 4 months in 26 patients after vertical banded gastroplasty and biliopancreatic diversion (24). Herrera et al reported a similar decrease in CRP, but they documented an actual increase in IL-6 3 months after RYGB in 22 patients (25). The explanation of that phenomenon is not clear, but it might be related to the fact that the CRP is an acute phase reactant produced by the liver while IL-6 is produced predominantly by macrophages and adipocytes whose microenvironment is likely quite different from that of the liver after RYGB. Salas-Salvadó J et al. (26) reported that obese subjects adhering to a low calorie diet experienced a significant decline in CRP and IL-6, but two weeks after the end of the diet, there was a rebound of both to almost baseline levels without any change in the subjects’ weight. The authors speculated that the observed improvement and rebound in inflammation are secondary to the change in energy balance and not to the loss of fat mass. This may apply to our study population that is subject to severe calorie restriction immediately after the operation. This is followed by a gradual increase in food tolerance and higher caloric intake at 8 week compared to 2 weeks after the procedure.
As has been reported previously, we observed a significant decrease in IGF-I, leptin, and ghrelin following LGB (27,28), but we were not able to demonstrate a significant change in either GLP-1 or GIP. This may be attributed to the fact that the blood samples were drawn during the fasting state and, therefore, may not reflect the modulation of secretion of incretins in response to nutrient intake. We believe that the observed metabolic and hormonal changes in our study population reflect the typical postoperative changes as described in the literature.
Following LGB, the experimental group demonstrated a significant improvement in their metabolic profile as compared to baseline, but the improvement in most parameters was not as significant as in the control group. It has been reported that improved insulin sensitivity parallels the trends of lower inflammation, lower leptin and higher IGF-I (25, 27, 28). The fact that we observe the same changes in measured parameters reinforces our conclusion that these observations do represent an actual physiologic difference.
The interpretation of the results may be limited due to the fact that we do not know if there was a difference in caloric intake between the two groups. We did not control their intake, nor did we ask the subject to keep a self-reported food journal. The amount and type of calories ingested between observations could have an impact on the measured values; however, there was no difference in weight loss or BMI change.
The observed changes between the control and experimental groups may be attributable to the metabolic effects of the supplemented amino acids. These amino acids are by no means metabolically innocent bystanders, used only as building blocks for proteins. Multiple studies done in vitro, in vivo, in animals and in humans have demonstrated that amino acids are potent modulators of glycemic control and energy balance (29–35). Arginine, leucine and glutamine have been shown to directly affect insulin secretion from the pancreatic beta cells (20). Glutamine is a well-known precursor of hepatic gluconeogenesis. A number of studies have demonstrated that increased levels of plasma amino acids (especially leucine) lead to a decreased whole-body glucose disposal primarily due to increased peripheral insulin resistance (30,36–37). Leucine infusion across a human forearm caused 80% reduction in glucose uptake and increased production of free fatty acids and ketone bodies (37). Most studies focus on amino acids induced alternations of insulin sensitivity in skeletal muscle, but similar effects were reported in hepatocytes (30) and adipocytes (31).
A number of mechanisms by which dietary proteins and amino acids modulate glucose metabolism and insulin sensitivity have been proposed. Amino acids have a demonstrable effect on cell signaling that is involved in the pathogenesis of insulin resistance. The mammalian target of rapamycin (mTOR) pathway, a phosphatidylinositol 3-kinase-related protein family (PI kinase-3) plays a role in many cellular signal transduction pathways including that of insulin and IGF-I (32,33). Tremblay et al reported a 55% reduction in insulin dependent glucose transport in muscle cells following an exposure to a mixture of amino acids. This negative effect was prevented by inhibition of the mTOR pathway by rapamycin (31). Leucine is the most patent amino acid in causing phosphorylation of PI kinase-3 and altering the mTOR pathway. This alternation influences glucose homeostasis by affecting both peripheral glucose utilization and pancreatic beta cells function (40–43). Moreover, leucine has also been demonstrated to influence, through mTOR, leptin (44–46) and IGF-I (47) related physiology. Some amino acids like glutamine and arginine have become an essential part of the immune modulating nutritional regimens in postoperative and critically ill patients (22). Taken as a whole, these studies demonstrate the metabolically active role of supplemental amino acids, and their potential adverse impact on some of the variables measured in our study.
Conclusion
Although an increase in whole-body insulin sensitivity, an alteration of incretin production, and a decrease in chronic inflammation after RYGB surgery are well established, the mechanisms involved are not fully understood. The current study confirms the findings reported in the surgical literature as related to the metabolic changes that occur after gastric bypass. Our pilot study involving the addition of a commercially available amino acid supplement mixture did not demonstrate any salutary effect in the early postoperative period on the measured parameters. This pilot study suggests that amino acids supplements may have undesirable metabolic implications. Currently, there is a very little evidence concerning the optimal supplemental management of protein following uncomplicated RYGB. In order to optimize the nutritional regimen after RYGB, we may need to concentrate on the quality and not just the quantity of protein supplementation.
Footnotes
Presented at the Southern Surgical Association, 122nd Annual Meeting, Palm Beach, Florida, December, 2010.
References
- 1.Allied Health Sciences Section Ad Hoc Nutrition Committee. ASMBS Allied Health Nutritional Guidelines for the Surgical Weight Loss Patient. Surg Obes Relat Dis. 2008 Sep–Oct;4(5 Suppl):S73–S108. doi: 10.1016/j.soard.2008.03.002. [DOI] [PubMed] [Google Scholar]
- 2.Geloneze B, Tambascia MA, Pareja JC, et al. The insulin tolerance test in morbidly obese patients undergoing bariatric surgery. Obes Res. 2001;9:763–769. doi: 10.1038/oby.2001.105. [DOI] [PubMed] [Google Scholar]
- 3.Ballantyne GH, Farkas D, Laker S, et al. Short-term changes in insulin resistance following weight loss surgery for morbid obesity: laparoscopic adjustable gastric banding versus laparoscopic Roux-en-Y gastric bypass. Obes Surg. 2006;16:1189–1197. doi: 10.1381/096089206778392158. [DOI] [PubMed] [Google Scholar]
- 4.Bastard JP, Maachi M, Lagathu C, et al. Recent advances in the relationship between obesity, inflammation, and insulin resistance. Eur Cytokine Netw. 2006;17:4–12. [PubMed] [Google Scholar]
- 5.Festa A, D'Agostino R, Jr, Williams K, et al. The relation of body fat mass and distribution to markers of chronic inflammation. Int J Obes Relat Metab Disord. 2001;25:1407–1415. doi: 10.1038/sj.ijo.0801792. [DOI] [PubMed] [Google Scholar]
- 6.Permana PA, Menge C, Reaven PD. Macrophage-secreted factors induce adipocyte inflammation and insulin resistance. Biochem Biophys Res Commun. 2006;341:507–514. doi: 10.1016/j.bbrc.2006.01.012. [DOI] [PubMed] [Google Scholar]
- 7.Bikman BT, Zheng D, Pories WJ, et al. Mechanism for improved insulin sensitivity after gastric bypass surgery. J Clin Endocrinol Metab. 2008 Dec;93(12):4656–4663. doi: 10.1210/jc.2008-1030. [DOI] [PMC free article] [PubMed] [Google Scholar]
- 8.Friedman JE, Dohm GL, Leggett-Frazier N, et al. Restoration of insulin responsiveness in skeletal muscle of morbidly obese patients after weight loss. Effect on muscle glucose transport and glucose transporter GLUT4. J Clin Invest. 1992;89:701–705. doi: 10.1172/JCI115638. [DOI] [PMC free article] [PubMed] [Google Scholar]
- 9.Ferrannini E, Mingrone G. Impact of different bariatric surgical procedures on insulin action and beta-cell function in type 2 diabetes. Diabetes Care. 2009;32:514–520. doi: 10.2337/dc08-1762. [DOI] [PMC free article] [PubMed] [Google Scholar]
- 10.Lima MM, Pareja JC, Alegre SM, et al. Acute effect of roux-en-y gastric bypass on whole-body insulin sensitivity: a study with the euglycemic-hyperinsulinemic clamp. J Clin Endocrinol Metab. 2010 Aug;95(8):3871–3875. doi: 10.1210/jc.2010-0085. [DOI] [PubMed] [Google Scholar]
- 11.Pardina E, Ferrer R, Baena-Fustegueras JA, et al. The relationships between IGF-1 and CRP, NO, leptin, and adiponectin during weight loss in the morbidly obese. Obes Surg. 2010 May;20(5):623–632. doi: 10.1007/s11695-010-0103-5. [DOI] [PubMed] [Google Scholar]
- 12.Buchwald H, Estok R, Fahrbach K, et al. Weight and type 2 diabetes after bariatric surgery: systematic review and meta-analysis. Am J Med. 2009 Mar;122(3):248–256.e5. doi: 10.1016/j.amjmed.2008.09.041. [DOI] [PubMed] [Google Scholar]
- 13.Katz A, Nambi SS, Mather K, et al. Quantitative insulin sensitivity check index: a simple, accurate method for assessing insulin sensitivity in humans. J Clin Endocrinol Metab. 2000;85:2402–2410. doi: 10.1210/jcem.85.7.6661. [DOI] [PubMed] [Google Scholar]
- 14.Matthews DR, Hosker JP, Rudenski AS, et al. Homeostasis model assessment: insulin resistance and β-cell function from fasting plasma glucose and insulin concentrations in man. Diabetologia. 1985;vol.28(no. 7):412–419. doi: 10.1007/BF00280883. [DOI] [PubMed] [Google Scholar]
- 15.Morley JJ, Kushner I. Serum C-reactive protein levels. C-reactive protein and the plasma protein response to tissue injury. Annals NY Acad Sci. 1982;389:406–417. doi: 10.1111/j.1749-6632.1982.tb22153.x. [DOI] [PubMed] [Google Scholar]
- 16.Kamimura D, Ishihara K, Hirano T. IL-6 signal transduction and its physiological roles: the signal orchestration model. Rev Physiol Biochem Pharmacol. 2003;149:1–38. doi: 10.1007/s10254-003-0012-2. [DOI] [PubMed] [Google Scholar]
- 17.Kristiansen OP, Mandrup-Poulsen T. Interleukin-6 and diabetes: the good, the bad, or the indifferent? Diabetes. 2005 Dec;54 Suppl 2:S114–S124. doi: 10.2337/diabetes.54.suppl_2.s114. [DOI] [PubMed] [Google Scholar]
- 18.Rattazzi M, Puato M, Faggin E, et al. C-reactive protein and interleukin-6 in vascular disease: culprits or passive bystanders? J. Hypertens. 2003 Oct;21(10):1787–1803. doi: 10.1097/00004872-200310000-00002. [DOI] [PubMed] [Google Scholar]
- 19.Empana JP, Jouven X, Canouï-Poitrine F, et al. C-reactive protein, interleukin 6, fibrinogen and risk of sudden death in European middle-aged men: the PRIME study. Arterioscler Thromb Vasc Biol. 2010 Oct;30(10):2047–2055. doi: 10.1161/ATVBAHA.110.208785. [DOI] [PubMed] [Google Scholar]
- 20.Newsholme P, Gaudel C, McClenaghan NH. Nutrient regulation of insulin secretion and beta-cell functional integrity. Adv Exp Med Biol. 2010;654:91–114. doi: 10.1007/978-90-481-3271-3_6. [DOI] [PubMed] [Google Scholar]
- 21.Linn T, Santosa B, Gronemeyer D, et al. Effect of long-term dietary protein intake on glucose metabolism in humans. Diabetologia. 2000 Oct;43(10):1257–1265. doi: 10.1007/s001250051521. [DOI] [PubMed] [Google Scholar]
- 22.Marik PE, Zaloga GP. Immunonutrition in critically ill patients: a systematic review and analysis of the literature. Intensive Care Med. 2008 Nov;34(11):1980–1990. doi: 10.1007/s00134-008-1213-6. [DOI] [PubMed] [Google Scholar]
- 23.Clements RH, Saraf N, Kakade M, et al. Nutritional effect of oral supplement enriched in beta-hydroxy-beta-methylbutyrate, glutamine and arginine on resting metabolic rate after laparoscopic gastric bypass. Surg Endosc. 2010 Oct 17; doi: 10.1007/s00464-010-1371-9. [DOI] [PMC free article] [PubMed] [Google Scholar]
- 24.Vázquez LA, Pazos F, Berrazueta JR, et al. Effects of changes in body weight and insulin resistance on inflammation and endothelial function in morbid obesity after bariatric surgery. J Clin Endocrinol Metab. 2005 Jan;90(1):316–322. doi: 10.1210/jc.2003-032059. [DOI] [PubMed] [Google Scholar]
- 25.Herrera MF, Pantoja JP, Velázquez-Fernández D, et al. Potential additional effect of omentectomy on metabolic syndrome, acute-phase reactants, and inflammatory mediators in grade III obese patients undergoing laparoscopic Roux-en-Y gastric bypass: a randomized trial. Diabetes Care. 2010 Jul;33(7):1413–1418. doi: 10.2337/dc09-1833. [DOI] [PMC free article] [PubMed] [Google Scholar]
- 26.Salas-Salvadó J, Bulló M, García-Lorda P, et al. Subcutaneous adipose tissue cytokine production is not responsible for the restoration of systemic inflammation markers during weight loss. Int J Obes (Lond) 2006 Dec;30(12):1714–1720. doi: 10.1038/sj.ijo.0803348. [DOI] [PubMed] [Google Scholar]
- 27.Rubino F, Gagner M, Gentileschi P, et al. The early effect of the Roux-en-Y gastric bypass on hormones involved in body weight regulation and glucose metabolism. Ann Surg. 2004 Aug;240(2):236–242. doi: 10.1097/01.sla.0000133117.12646.48. [DOI] [PMC free article] [PubMed] [Google Scholar]
- 28.Edén Engström B, Burman P, Holdstock C, et al. Effects of gastric bypass on the GH/IGF-I axis in severe obesity--and a comparison with GH deficiency. Eur J Endocrinol. 2006 Jan;154(1):53–59. doi: 10.1530/eje.1.02069. [DOI] [PubMed] [Google Scholar]
- 29.Krebs M, Krssak M, Bernroider E, et al. Mechanism of amino acid-induced skeletal muscle insulin resistance in humans. Diabetes. 2002;51:599–605. doi: 10.2337/diabetes.51.3.599. [DOI] [PubMed] [Google Scholar]
- 30.Flakoll PJ, Wentzel LS, Rice DE, et al. Short-term regulation of insulin-mediated glucose utilization in four-day fasted human volunteers: role of amino acid availability. Diabetologia. 1992;35:357–366. doi: 10.1007/BF00401203. [DOI] [PubMed] [Google Scholar]
- 31.Tremblay F, Marette A. Amino acid and insulin signaling via the mTOR/p70 S6 kinase pathway. A negative feedback mechanism leading to insulin resistance in skeletal muscle cells. J. Biol. Chem. 2001;276:38052–38060. doi: 10.1074/jbc.M106703200. [DOI] [PubMed] [Google Scholar]
- 32.Patti ME, Brambilla E, Luzi L, et al. Bidirectional modulation of insulin action by amino acids. J. Clin. Invest. 1998;101:1519–1529. doi: 10.1172/JCI1326. [DOI] [PMC free article] [PubMed] [Google Scholar]
- 33.Takano A, Usui I, Haruta T, et al. Mammalian target of rapamycin pathway regulates insulin signaling via subcellular redistribution of insulin receptor substrate 1 and integrates nutritional signals and metabolic signals of insulin. Mol. Cell Biol. 2001;21:5050–5062. doi: 10.1128/MCB.21.15.5050-5062.2001. [DOI] [PMC free article] [PubMed] [Google Scholar]
- 34.Tremblay F, Lavigne C, Jacques H, et al. Role of dietary proteins and amino acids in the pathogenesis of insulin resistance. Annu Rev Nutr. 2007;27:293–310. doi: 10.1146/annurev.nutr.25.050304.092545. [DOI] [PubMed] [Google Scholar]
- 35.Tokunaga C, Yoshino K, Yonezawa K. mTOR integrates amino acid- and energy-sensing pathways. Biochem Biophys Res Commun. 2004 Jan 9;313(2):443–446. doi: 10.1016/j.bbrc.2003.07.019. [DOI] [PubMed] [Google Scholar]
- 36.Krebs M, Krssak M, Bernroider E, et al. Mechanism of amino acid-induced skeletal muscle insulin resistance in humans. Diabetes. 2002;51:599–605. doi: 10.2337/diabetes.51.3.599. [DOI] [PubMed] [Google Scholar]
- 37.Pisters PW, Restifo NP, Cersosimo E, et al. The effects of euglycemic hyperinsulinemia and amino acid infusion on regional and whole body glucose disposal in man. Metabolism. 1991;40:59–65. doi: 10.1016/0026-0495(91)90193-z. [DOI] [PubMed] [Google Scholar]
- 38.Linn T, Geyer R, Prassek S, Laube H. Effect of dietary protein intake on insulin secretion and glucose metabolism in insulin-dependent diabetes mellitus. J Clin Endocrinol Metab. 1996 Nov;81(11):3938–3943. doi: 10.1210/jcem.81.11.8923841. [DOI] [PubMed] [Google Scholar]
- 39.Abumrad NN, Robinson RP, Gooch BR, et al. The effect of leucine infusion on substrate flux across the human forearm. J. Surg. Res. 1982;32 doi: 10.1016/0022-4804(82)90126-3. 453–63 for discussion about leucine. [DOI] [PubMed] [Google Scholar]
- 40.Baum JI, O'Connor JC, Seyler JE, et al. Leucine reduces the duration of insulin-induced PI 3-kinase activity in rat skeletal muscle. Am. J. Physiol. Endocrinol. Metab. 2005;288:E86–E91. doi: 10.1152/ajpendo.00272.2004. [DOI] [PubMed] [Google Scholar]
- 41.Du M, Shen QW, Zhu MJ, et al. Leucine stimulates mammalian target of rapamycin signaling in C2C12 myoblasts in part through inhibition of adenosine monophosphate-activated protein kinase. J Anim Sci. 2007 Apr;85(4):919–927. doi: 10.2527/jas.2006-342. [DOI] [PubMed] [Google Scholar]
- 42.Yang J, Chi Y, Burkhardt BR, et al. Leucine metabolism in regulation of insulin secretion from pancreatic beta cells. Nutr Rev. 2010 May;68(5):270–279. doi: 10.1111/j.1753-4887.2010.00282.x. [DOI] [PMC free article] [PubMed] [Google Scholar]
- 43.Layman DK. The role of leucine in weight loss diets and glucose homeostasis. J Nutr. 2003;133:261S–267S. doi: 10.1093/jn/133.1.261S. [DOI] [PubMed] [Google Scholar]
- 44.Cota D, Proulx K, Smith KA, et al. Hypothalamic mTOR signaling regulates food intake. Science. 2006;312:927–930. doi: 10.1126/science.1124147. [DOI] [PubMed] [Google Scholar]
- 45.Lynch CJ, Gern B, Lloyd C, et al. Leucine in food mediates some of the postprandial rise in plasma leptin concentrations. Am J Physiol Endocrinol Metab. 2006;25:25. doi: 10.1152/ajpendo.00462.2005. [DOI] [PubMed] [Google Scholar]
- 46.Roh C, Han J, Tzatsos A, et al. Nutrient-sensing mTOR-mediated pathway regulates leptin production in isolated rat adipocytes. Am. J. Physiol. Endocrinol. Metab. 2003;284:E322–E330. doi: 10.1152/ajpendo.00230.2002. [DOI] [PubMed] [Google Scholar]
- 47.Kornasio R, Riederer I, Butler-Browne G, et al. Beta-hydroxy-beta-methylbutyrate (HMB) stimulates myogenic cell proliferation, differentiation and survival via the MAPK/ERK and PI3K/Akt pathways. Biochim Biophys Acta. 2009 May;1793(5):755–763. doi: 10.1016/j.bbamcr.2008.12.017. [DOI] [PubMed] [Google Scholar]


