

Abstract
Multidrug and toxin extrusion 1 (MATE1/solute carrier 47A1) mediates cellular transport of a variety of structurally diverse compounds. Paraquat (PQ), which has been characterized in vitro as a MATE1 substrate, is a widely used herbicide and can cause severe toxicity to humans after exposure. However, the contribution of MATE1 to PQ disposition in vivo has not been determined. In the present study, we generated Mate1-deficient (Mate1–/–) mice and performed toxicokinetic analyses of PQ in Mate1–/– and wild-type (Mate1+/+) mice. After a single intravenous administration of PQ (50 mg/kg), Mate1–/– mice exhibited significantly higher plasma PQ concentrations than Mate1+/+ mice. The renal PQ concentration was markedly increased in Mate1–/– mice compared with Mate1+/+ mice. The subsequent nephrotoxicity of PQ were examined in these mice. Three days after intraperitoneal administration of PQ (20 mg/kg), the transcript levels of N-acetyl-β-d-glucosaminidase (Lcn2) and kidney injury molecule-1 (Kim-1) in the kidney were remarkably enhanced in the Mate1–/– mice. This was accompanied by apparent difference in renal histology between Mate1–/– and Mate1+/+ mice. In conclusion, we demonstrated that Mate1 is responsible for renal elimination of PQ in vivo and the deficiency of Mate1 function confers deteriorated kidney injury caused by PQ in mice.
Keywords: Paraquat, multidrug and toxin extrusion 1 (MATE1/solute carrier 47A1), genetic deficiency, pharmacokinetics, nephrotoxicity
Introduction
Paraquat (N,N-dimethyl-4,4′-bipyridinium dichloride; PQ) is a widely used herbicide due to its rapid effect and quick deactivation once in contact with soil. However, it is of great toxicological importance and associated with a high mortality rate during human exposure.1−5 Epidemiological studies also suggest that PQ exposure may increase the risk for Parkinson’s disease.6,7 PQ accumulates with high concentrations in lung, liver and kidney,8,9 which causes the primary symptoms of PQ toxicity, including respiration difficulty, hepatitis, and acute renal failure, respectively.(10) PQ toxicity results from the overproduction of reactive oxygen species.11,12 In cells, PQ is first reduced to form free radial monocation (PQ+) by the reactions mediated by a series of enzymes, including NADPH cytochrome P-450 reductase,(13) NADPH cytochrome C reductase,(14) the mitochondrial complex I (known as NADH), and ubiquinone oxidoreductase.(15) Subsequently, the monocation is rapidly oxidized while generating abundant superoxide radical (O2–).(16) The superoxide radical starts a cascade of downstream reactions leading to the production of reactive oxygen species, mainly hydrogen peroxide (H2O2) and hydroxyl radical (HO–), which cause DNA damage or genotoxicity, destroy the lipids of cell membranes, and finally induce cell death.(17)
PQ is an organic cation with two positive charges and is not metabolized in vivo.(18) PQ is predominantly eliminated by urine and, partly, by feces.(19) The capability of organic cation transporters to transport PQ across the basolateral membrane from blood into the cell and consequently through the apical membrane from intracellular into tubule lumina or bile duct may determine the elimination rate and retention time of PQ in vivo. The transporters responsible for transporting organic cations across cellular membrane include organic cation transporters 1–3 (OCT1–3), encoded by solute carrier family 22A 1–3 (SLC22A1–3),1,20 organic cation/carnitine transporters 1–3 (OCTN1–3), encoded by SLC22A4, -5, and -21,(21) and multidrug and toxin extrusion protein 1–2 (MATE1–2), encoded by SLC47A1 and -2.22,23 Human OCT1 is mainly expressed in the liver, while OCT2 in the basolateral membrane of renal proximal tubules.(24) In rodents, OCT1 is also abundantly expressed in the kidney.(24) OCT3, also called extraneuronal monoamine transporter for its role in the extraneuronal monoamine uptake system (uptake 2), is expressed ubiquitously in most tissues, but with relatively low levels.(25) OCTNs are sodium-dependent and high-affinity carnitine transporters. The OCTN1 and OCTN2 expressed in the apical membrane of renal proximal tubules mediate the reabsorption of carnitine and other organic cations to maintain their plasma levels.(26) The MATE protein family, including MATE1 and MATE2 in mammalians, has been recently suggested to be responsible for renal or hepatic organic cation elimination or secretion using a H+-coupled antiport mechanism.27,28
Limited in vitro evidence has suggested that hOCT2, not hOCT1 or hOCT3, hMATE1 and rMATE1 transport PQ in a time- and dose-dependent manner in the overexpression models of HEK-293 cells.(29) However, the involvement of these organic cation transporters in the disposition and toxicity of PQ in vivo remains undefined. In this study, we generated the mouse model of Mate1 deficiency (Mate1–/–) by the gene trap technique. The toxicokinetics and toxicity of PQ were examined in the Mate1–/– and the wild-type mice. Our data indicated that Mate1 played a critical role in the renal elimination of PQ and disruption of Mate1 function remarkably potentiated PQ nephrotoxicity in mice.
Experimental Section
Materials
Paraquat hydrochloride was purchased from Sigma-Aldrich Co (St. Louis, MO). Paraquat [methyl-14C] dichloride hydrate (0.1 mCi/mmol) was purchased from American Radiolabeled Chemicals Inc. (St. Louis, MO). [14C]-Metformin (50 μCi, 1.85 MBq) was purchased from Moravek Biochemicals and Radiochemicals Inc. (Brea, CA). All other reagents were commercially available.
Generation of the Mouse Deficient of Mate1
The C57BL/6 ES cells with the Mate1 gene trapped by a retroviral gene trap vector at intron 10 were obtained from the Texas A&M Institute for Genomic Medicine (TIGM, College Station, TX).(30) The ES cells were injected into 8-cell embryos isolated from timed pregnant C57BL/6 albino females. Injected 8-cell embryos were cultured to blastocysts and then transferred into the uterus of pseudopregnant females for development into individual pups. Positive chimeric mice were identified by spotted white hairs. The chimeric males were mated with C57BL/6 females to generate F1 offspring from which the germ line transmission of the target allele was confirmed by PCR method. Although the mutant mice were derived from general C57BL/6 background, the mice used in the present study had been backcrossed to C57BL/6J for at least 5 generations to exclude potential subtle genetic background effects.
Animals
All procedures were carried out in accordance with NIH guidelines for animal experimentation, and all experimental protocols were approved by the Institutional Animal Care and Use Committee (IACUC) of the School of Pharmacy, University of Maryland Baltimore. Animals were housed under controlled conditions (21 ± 2 °C, humidity 60 ± 10% and 12 h/12 h dark/light cycle) and had free access to food and water. All animals used in the present study were male mice with the same genetic background of C57BL/6J, between 12 and 18 weeks of age.
Genomic DNA Extraction and Genotyping
The tail was cut from all offsprings and genomic DNA isolated by QIAamp DNA extraction mini kit (QIAGEN Co., Valencia, CA). The genomic DNA was amplified with two pairs of primers to genotype the mice (one pair for the wild-type allele and the other for the mutant allele: wild-type/mutant forward primer, 5′-GAATGGGTGGGCCAAGTATG-3′; wild-type reverse primer, 5′-CATTGACCTGTCGTGCTGGAT-3′; mutant reverse primer, 5′-CTTGCAAAATGGCGTTACTTAAGC-3′). The PCR condition was as follows: an initial 3-min denaturation at 94 °C, then 94 °C for 30 s, 54 °C for 30 s, 72 °C for 45 s for 35 cycles, 72 °C for 10 min for last extension. The amplified PCR products were separated in a 2% agarose gel and stained with ethidium bromide.
Reverse Transcription and Real-Time PCR
Total RNA was isolated from the liver and kidney of mice using TRIzol and phenol–chloroform method. The total RNA (2 μg) was reverse transcribed using a high capability reverse transcipt kit (Roche Applied Science, Indianapolis, IN). The reaction mixtures were diluted by 4 times, and 1 μL was then used as the template for regular PCR or real-time PCR. The regular PCR condition was as follows: an initial 3-min denaturation step at 94 °C, then 94 °C for 30 s, 54 °C for 30 s, 72 °C for 10 s for 25 cycles for Mate1 and glyceraldehyde-3-phosphate dehydrogenase (Gapdh) in the liver and kidney. The real-time PCR condition was as follows: an initial 2-min incubation step at 50 °C, then 3-min denaturation at 94 °C, followed by 40 cycles of 2 steps at 94 °C for 30 s and 60 °C for 60 s. Real-time PCR was performed on ABI PRISM 7700 (Applied Biosystems, Foster City, CA). The expression of biomarker genes for kidney injury, including Kim-1 and Lcn2, and drug transporters located in the liver and kidney, including Oct1–3, Octn1–3, Mrp1–4, Oatp1a1, Oatp1a4, Oatp1b2, Mdr1, Bcrp, and Bsep, were determined by real-time PCR.
Function Deficiency of Mate1 in Mate1–/– Mice
Metformin has been well characterized as a substrate for Mate1 in vitro and in vivo.(31) In the previous report, metformin pharmacokinetics was significantly altered in the Mate1 knockout mice created by traditional recombination gene targeting.(32) To functionally validate our Mate1–/– mouse model, we determined and compared metformin tissue distribution in these mice and wild-type control mice. Five milligrams per kilogram metformin, containing 0.2 μCi/mL [14C]-metformin, was injected via tail vein into Mate+/+ and Mate1–/– mice. At 60 min after injection, different tissues including liver and kidney were removed, weighed, homogenized, and centrifuged. 100 μL of supernatant was added into scintillation buffer and counted in a multipurpose scintillation counter (Beckman LS6500 Counter, Brea, CA) to determine tissue accumulation of metformin.
PQ Toxicokinetics
In humans, moderate-to-severe poisoning is usually secondary to ingestion of 20–50 mg/kg PQ.(33) In this study, Mate1+/+ and Mate1–/– mice were injected by tail vein with 50 mg/kg PQ as described elsewhere.18,33−35 PQ was dissolved in 0.9% saline (the ratio of total paraquat to [14C]-PQ was 130:1). Blood samples were collected by tail bleeding at 5, 10, 20, 30, 60, and 90 min after injection. The radioactivity in 20 μL of blood was counted in a multipurpose scintillation counter (Beckman LS6500 counter, Brea, CA). The mice were sacrificed at 90 min, and the tissues were isolated, gently washed, weighed, submerged in phosphate buffered saline, pH 7.4, and further homogenized completely. The homogenized tissues were centrifuged at 15000 rpm for 10 min and the radioactivity in the supernatant was counted.
Determination of Toxicokinetic Parameters
WinNonlin version 5.2.1 (Pharsight Corporation, Mountain View, CA) was used to analyze the plasma concentration–time profiles of PQ after the intravenous administration in mice. Toxicokinetic parameters and the area under the blood concentration–time curve from time 0 to infinity (AUC∞) were calculated by the nonlinear least-squares method. The AUC until 90 min (AUC0–90) was determined by the trapezoidal rule.
PQ Tissue Toxicity
For tissue toxicity experiments, Mate1+/+ and Mate1–/– mice were injected with 20 mg/kg PQ as described elsewhere.34,35 PQ was dissolved in 0.9% saline and injected ip. The mice were sacrificed at 72 h after injection. Total RNA was extracted from one kidney. The expression of Lcn2 and Kim-1 genes, as indicators of acute kidney injury,36,37 were determined by real-time PCR as described above. For histopathological analysis, the other kidney and the liver were collected and submerged immediately into 10% formalin saline buffer overnight, and further processed to paraffin embedding and hematoxylin and eosin (H&E) staining.
Statistical Analysis
All data were expressed as the mean ± standard deviation (SD). Data from real-time PCR were analyzed statistically with the one-way analysis of variance (ANOVA) followed by Dunnett’s test. Data from blood biochemical analysis and toxicokinetic analysis were analyzed statistically using the unpaired Student’s t test. A P value of <0.05 was considered statistically significant.
Results
Disruption of the Mate1 Gene by a Gene Trap Vector in Mice
In order to understand the physiology and pharmacology significance of Mate1, we generated a Mate1 mutant mouse strain. The mice were derived from an embryonic stem cell line of mutated C57BL/6 ES cell library created by gene trapping in the Texas A&M Institute for Genomic Medicine (TIGM, College Station, TX).(30) The ES cell line was integrated with a retrovirus vector containing the 5′ selectable marker β-geo, a functional fusion between the β-galactosidase and neomycin resistance genes, in the intron 10 of Mate1 genomic locus (Figure 1A). Chimeric mice were first generated from ES cells and then mated with wild-type C57BL/6J mice, resulting in germ line transmission. A PCR-based genotyping assay was established to distinguish wild-type, heterozygous, and homozygous mice (Figures 1A and 1B). Heterozygous mice were intercrossed to generate enough wild-type mice and homozygous mutant mice for the following experiments. The Mate1 transcript level was also determined by real-time PCR in RNA samples from mouse kidney. There was at least 90% reduction in Mate1 expression in the kidney of mutant mice compared to the wild-type mice (Figure 1C).
Figure 1.

Generation of Mate1-deficient mice via gene trapping. (A) Schematic of gene trapping and genotyping strategy. Forward and reverse primers are located in intron 10 of Mate1 genomic locus; V76 reverse primer located in backbone of the trapping vector (Omnibank Gene Trap Vector 76).(30) (B) PCR-based genotyping distinguishes wild-type, heterozygous, and homozygous animals. Two polymerase chain reactions (PCR) are needed for genotyping every mouse. The two PCR products were mixed equally and separated at 2% gel with ethidium bromide staining. (C) Transcript levels of Mate1 in Mate1+/+ and Mate1–/– male mice. The mRNA level shown is relative to that of Gapdh. ***P < 0.001
Phenotypic Characterization
We monitored all the mice for at least 3 months. We found that there was modest but significant difference in body weight between the wild-type and homozygous mutant mice at 3 months of age (wild-type 25.9 ± 1.14 g vs mutant 30.18 ± 1.57 g, P = 0.03, n = 5). We did not detect any other overt phenotypes in the homozygous mutant animals. Homozygous mutant mice were observed to be viable and fertile, consistent with previous results of the Mate1 knockout mice created by gene targeting using homologous recombination.(32) Metformin is a well characterized substrate for Mate1.(38) The accumulation of metformin has been previously demonstrated to be significantly different between wild-type and Mate1 knockout mice.(32) In the present study, the accumulation of metformin in the liver and kidney was determined to functionally validate our mouse model. At 60 min after an intravenous dose of 5 mg/kg metformin, hepatic and renal accumulation was 6.9- and 3.4-fold higher in the homozygous mutant mice than in the wild-type control mice, respectively (P < 0.05, Figure 2). The results were comparable to those obtained by others between Mate1 knockout mice and wild-type mice.(32) Based on the results from genotyping, transcript and function measurement, we concluded that the Mate1 gene was effectively disrupted in our homozygous mutant mice, which are therefore designated as Mate1–/– mice.
Figure 2.

Metformin accumulation in the liver and the kidney of Mate1+/+ mice and Mate1–/– mice. The Mate1+/+ (white bar) and Mate1–/– (black bar) mice were sacrificed at 60 min after the administration of 5 mg/kg metformin containing 0.2 μci/ml [14C]-metformin via tail vein injection. Each bar represents the mean ± SD for 6 male mice. ***P < 0.001 significantly different from Mate1+/+ mice.
Drug Transporter Gene Expression in Mate1–/– and Mate1+/+ Mice
To clarify whether mRNA levels of other drug transporter genes, in particular organic cation transporter genes, are altered in Mate1–/– mice, the mRNA expression of main transporters in the kidney and liver was determined by real-time PCR. Except that Abcb1a expression was elevated by 150% in the liver of Mate1–/– mice (Figure 3), there was no difference in the expression of other transporter genes between Mate1+/+ and Mate1–/– mice (data not shown).
Figure 3.

Hepatic Abcb1a transcript levels in Mate1+/+ and Mate1–/– mice. The mRNA level shown is relative to the transcript level of Gapdh. *P < 0.05, significantly different from Mate1+/+ mice.
Toxicokinetics of PQ in Mate1+/+ and Mate1–/– Mice
We compared the toxicokinetics of PQ (50 mg/kg), a substrate of Mate1 identified in vitro,(29) in Mate1–/– and Mate1+/+ mice. The plasma concentrations of PQ were markedly elevated in Mate1–/– mice compared with Mate1+/+ mice (Figure 4A). The AUC0–90min for PQ in Mate1–/– was significantly increased 64% when compared with that in Mate1+/+ mice (5530 ± 394 vs 3380 ± 216 μg·min/mL, P = 0.005). Cmax in Mate1–/– and Mate1 +/+ was 127 ± 13.4 and 80.5 ± 21.7 μg·mL/mg, respectively, increasing 57% in the Mate1–/– mice (P = 0.03). The difference of Tmax between Mate1–/– (84.2 ± 11.4 min) and Mate1+/+ (61.8 ± 15.2 min) did not reach a statistical significance (P = 0.06). The toxicokinetic parameters were summarized in Table 1. The accumulation of PQ in the major tissues including lung, liver and kidney were also measured after the single dose. The renal accumulation of PQ in Mate1–/– mice was increased by 147% as compared to the Mate1+/+ mice (P = 0.014). In the lung, PQ accumulation was elevated by 59.5% in Mate1–/– mice (P = 0.03). However, there was a reversed trend regarding PQ accumulation in the liver. The hepatic accumulation of PQ tended to be lower in Mate1–/– mice than in Mate1+/+ mice (P = 0.16) (Figure 4B). Although PQ accumulation tended to be higher in other tissues such as brain, the differences did not reach statistical significance (data not shown).
Figure 4.

PQ toxicokinetics in the mice of different Mate1 genotypes. (A) The plasma concentration profile of PQ in Mate1–/– (▲) and Mate1+/+ (■) mice. 50 mg/kg PQ in saline was administered via tail vein injection. Blood samples were collected at the time points indicated. PQ levels in the blood samples were determined by counting 14C-PQ (the ratio of labeled to total PQ is 1:130). Each point represents the mean ± SD for 6 male mice. *P < 0.05; **P < 0.01; ***P < 0.001, significantly different from Mate1+/+ mice. (B) PQ accumulation in different tissues from Mate1+/+ mice (white bar) and Mate1–/– mice (black bar) at 90 min after 50 mg/kg PQ administration via tail vein injection. Each bar represents the mean ± SD for 6 male mice. *P < 0.05; **P < 0.01, significantly different from Mate1+/+ mice.
Table 1. Toxicokinetic Parameters of PQ in Mate1+/+ and Mate1–/– Mice after 50 mg/kg PQ Injection via Tail Vein.
| parameters | Mate1+/+ | Mate1–/– | P value |
|---|---|---|---|
| AUC0–90 (μg·min/mL) | 3380 ± 216 | 5530 ± 394 | 0.005 |
| AUC0–∞ (μg·min/mL) | 7000 ± 2200 | 9530 ± 2230 | 0.16 |
| Cmax (min) | 80.5 ± 21.7 | 127 ± 13.4 | 0.03 |
| Tmax (μg/m) | 61.8 ± 15.2 | 84.2 ± 11.4 | 0.06 |
| T1/2 (min) | 64.5 ± 9.3 | 55.2 ± 14.4 | 0.67 |
PQ Toxicity in Mate1+/+ and Mate1–/– Mice
The mice of different Mate1 genotypes (Mate1+/+ and Mate1–/–) were injected ip with 20 mg/kg PQ. The respiration and behavior activities were observed for 72 h after PQ administration. Mate1–/– mice exhibited more difficult respiration, less movement, and decreased body weight in comparison to Mate1+/+ mice (data not shown). All mice were sacrificed at 72 h. The total RNA was extracted from the kidney and liver. The transcript levels of the Kim-1 and Lcn2 genes, as indicators of acute kidney injury,36,37 were determined. Lcn2 expression was apparently elevated by PQ treatment, with much more dramatic increase in the Mate1–/– mice when compared with Mate1+/+ by over 40-fold (P < 0.001). Similarly, Kim-1 expression was 27-fold higher in the Mate1–/– mice than that in the Mate1+/+ mice after PQ treatment (P < 0.001) (Figures 5A and 5B). The data indicated that PQ caused more severe acute kidney injury in Mate1–/– mice than in Mate1+/+ mice.
Figure 5.

Renal transcript levels of the biomarker genes for acute kidney injury in the mice received PQ treatment. (A) Lcn2 transcript levels. (B) Kim-1 transcript levels, in the kidney of Mate1+/+ (white bar) and Mate1–/– (black bar) genotypes, respectively. The mRNA level shown is relative to Gapdh transcript level. ***P < 0.001, significantly different from Mate1+/+ mice.
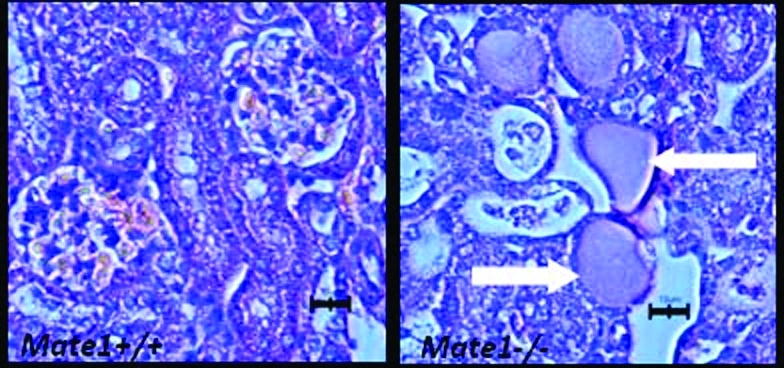
Histopathologic evaluation of kidneys from PQ-treated mice demonstrated much more severe necrosis containing eosinophilic amorphous material and pyknotic debris (depicted by arrows in Figure 6B) in Mate1–/– mice than in Mate1+/+ mice. In addition, Mate1–/– kidney showed degeneration including tubular dilatation, tubular cell vacuolation, and tubular cell detachment from basement membrane after the PQ treatment. In the liver, the damage by PQ also showed the same trend as that in the kidney between the two genotypes (Figures 7A and 7B). There was no obvious damage in the liver of Mate1+/+ mice, while in Mate1–/– mice, balloon hepatocytes and apoptotic necrotic cells adjacent to the central vein existed and the basal membrane adjacent to the central vein was inconsecutive and broken.
Figure 6.

Histopathologic changes in the kidney from the mice received PQ treatment. The Mate1+/+ (A) and Mate1–/– (B) mice were treated with a 20 mg/kg single ip dose for 72 h. Mate1–/– kidney shows sever necrosis containing eosinophilic amorphous material and pyknotic debris (white arrows). The black scale bar represents 10 μm.
Figure 7.

Histopathologic changes in the liver from the mice received PQ treatment. The Mate1+/+ (A) and Mate1–/– (B) mice were treated with a 20 mg/kg single ip dose for 72 h. Mate1–/– liver shows balloon hepatocytes and apoptotic necrotic cells adjacent to the central vein and the basal membrane adjacent to the central vein was inconsecutive and broken (white arrows). The black scale bar represents 10 μm.
Discussion
In the present study, the mouse model of Mate1 deficiency was successfully established via the gene trap technology. Successful gene trapping was confirmed by using the primers specific to the trap vector and to the Mate1 genomic locus. Mate1 transcripts were rarely detected in the kidney and liver of Mate1–/– mice, two tissues with high Mate1 expression in wild-type mice.(37) Using metformin as a probe substrate, our Mate1–/– mice exhibited loss of Mate1 transporter function that was comparable to a previous Mate1 knockout mouse model created by conventional targeting recombination.(32) We did not detect any alteration in the expression of other transporters, including those transporting organic cations, except Abcb1a encoding P-glycoprotein (P-gp) in the liver. The mouse model of Mate1 deficiency should be an appropriate tool to characterize the disposition of the xenobiotics interacting with MATE1 in vivo.
PQ, a widely used herbicide, is rapidly distributed into tissues and accumulated in the lung, liver and kidney with high concentrations, resulting in serious toxicity in these organs. The kidney is mainly responsible for the elimination of most systemic PQ with minor contribution from the liver.18,39 In order to treat patients with PQ poisoning, it is critical to understand the mechanism of PQ elimination in the kidney and preserve renal function. In the in vitro overexpression system of HEK-293 cells, PQ has been characterized as a substrate toward OCT2 and MATE1.(29) Human OCT2 is primarily expressed at the basolateral membrane and is responsible for the entry of organic cations into the renal proximal tubular cells.(1) In contrast, MATE1 is located in the brush-border membrane and responsible for the second step of renal secretion of organic cations. In the present study, we sought to determine the role of Mate1 in determining PQ disposition and toxicity in vivo by using our established Mate1–/– mouse model. We performed the toxicokinetics of PQ in Mate1–/– mice and Mate1+/+ mice. The concentrations of PQ in the blood were markedly higher in Mate1–/– mice compared with Mate1+/+ mice, along with significant differences in multiple toxicokinetic parameters. The data indicate that Mate1 plays a critical role in PQ disposition. It should be noted that the Mate1–/– mice gained more body weight at 3 months of age than wild-type mice. The reason remains to be determined. Currently, there were no reports on effect of body weight on PQ disposition. In this study, PQ was dosed based on the body weight and the reported differences between Mate1–/– mice and wild-type mice had been normalized with body weight, suggesting that the toxicokinetic differences between the two genotypes are not secondary to the body weight difference.
PQ accumulation in the kidney and lung, two of the major organs responsible for PQ acute toxicity, was significantly higher for the Mate1–/– mice than for the Mate1+/+ mice after an acute single dose of 50 mg/kg. However, unexpectedly, PQ accumulation in the liver, another major organ responsible for PQ toxicity, tended to, while not significantly, be lower for the former after the acute dose. Since the hepatic accumulation of metformin, a probe substrate of Mate1,(38) is significantly higher in the mice deficient of Mate1 function,(32) we speculate that the difference in hepatic PQ accumulation between Mate1–/– and Mate1+/+ mice was secondary to Mate1 deficiency. One possibility is that Mate1 deficiency caused functional changes for other PQ transporters in the liver. We detected the transcript levels of multiple drug transporter genes in the livers and kidneys from Mate1–/– and Mate1+/+ mice with and without PQ treatment. While PQ treatment seemed to downregulate several transporter genes in the kidney and liver of both Mate1+/+ and Mate–/– mice, only hepatic Abcb1a was found to be differently expressed between these two mice, with Mate1–/– mice showing 150% higher expression. P-gp, encoded by Abcb1a in mice, is an ATP-driven transmembrane transporter capable of transporting a wide variety of structurally diverse and functionally unrelated compounds out of the cell.(40) Dinis-Oliveira et al. have reported that the induction of de novo synthesis of P-gp by dexamethasone decreases PQ lung accumulation and consequently its toxicity.(41) On the other hand, verapamil, a competitive inhibitor of this transporter, when given one hour before dexamethasone, blocked these protective effects and caused an increase of PQ lung concentration and an aggravation in toxicity.(42) It is thus likely that the increased Abcb1a expression was able to overcome Mate1 deficiency and responsible for the less or unaltered PQ accumulation in the Mate1–/– mice during the studied time. However, this hypothesis needs to be further tested. In particular, it is necessary to directly confirm PQ as a P-gp substrate and determine the mechanism of hepatic Abcb1a upregulation secondary to Mate1 deficiency. It should be noted that Mate1–/– mice still exhibited more severe hepatoxicity than Mate1+/+ mice after three days of PQ exposure, which may be explained by a much higher systemic PQ exposure over time and/or severe toxicity in other critical organs including kidney and lung.
PQ poisoning can cause acute kidney injury (AKI).(3) Kidney injury molecular-1 protein (Kim-1),36,43 and lipocalin 2 gene (Lcn2), encoding neutrophil gelatinase-associated lipocalin (NGAL),37,44 have been demonstrated to be highly upregulated during AKI. They are both primarily potential biomarkers of the early stage of AKI in rodents and humans.36,37 We found that the mRNA expression of Kim-1 and Lcn2 genes were elevated dramatically in the Mate1–/– mice treated by 20 mg/kg PQ for three days, with only marginal increase detected in the Mate1+/+ mice. Moreover, the histology of kidney and liver showed more severe damage in Mate1–/– mice when compared to Mate1+/+ mice. We also observed apparent toxic symptoms such as respiration difficulty and body weight loss in Mate1–/– mice but not in Mate1+/+ mice. These results, coupled with the toxicokinetic ones, indicated that Mate1 played a critical role in PQ-induced acute toxicity including AKI by modulation of PQ elimination in the kidney. In humans, MATE1 is highly expressed in the kidney and the liver. MATE2 (MATE2-K) exhibits a kidney-specific expression. MATE1 and MATE2 are detected at similar mRNA levels in human kidney. In mice, Mate1 is highly expressed in both the kidney and the liver. The tissue distribution of Mate1 in mice is generally consistent with that in humans. However, MATE2 is not expressed in mice. Therefore, in the case of MATE, Mate1–/– mice may represent a model of deficiency in both MATE1 and MATE2 in human kidney.(32)
Previous data suggest a positive dose–response relationship between lifetime cumulative exposure to PQ and risk of PD.45−47 Future studies are warranted to use the Mate1–/– mice to determine the role of Mate1 in PQ-induced chronic toxicity such as PD risk. Our data suggest that the toxic response to PQ in patients may vary because of different activity of MATE and that we should avoid the drugs and factors inhibiting MATE function when treating these patients. For example, patients with certain genetic variants of MATE including MATE1 and MATE2 may have different susceptibility to PQ toxicity. Two variants of human MATE1 with no function and four with altered function have been reported.48,49 Three of them were polymorphic in a particular ethnic population with allele frequencies greater than 2%. Clinical significance of human MATE polymorphisms in PQ-associated symptoms and diseases merits further investigation.
In summary, we generated a mouse model of Mate1 functional deficiency by gene trapping. The mouse model can be used to characterize in vivo xenobiotic disposition and explore Mate1 physiology. By using this model, we have demonstrated for the first time that the Mate1 transporter plays a critical role in the renal elimination of PQ in mice and in conferring PQ toxicity. Future studies are required to define the effect of MATE transporter function on PQ toxicity in humans.
Acknowledgments
Dr. Yan Shu receives intramural start-up funds from the School of Pharmacy, University of Maryland Baltimore. Dr. Hongbing Wang receives a research grant from the National Institutes of Health, National Institute of Diabetes and Digestive and Kidney Diseases (Grant No. DK061652).
Funding Statement
National Institutes of Health, United States
References
- Wright S. H. Role of organic cation transporters in the renal handling of therapeutic agents and xenobiotics. Toxicol. Appl. Pharmacol. 2005, 204 (3), 309–319. [DOI] [PubMed] [Google Scholar]
- Aleksunes L. M.; Augustine L. M.; Scheffer G. L.; Cherrington N. J.; Manautou J. E. Renal xenobiotic transporters are differentially expressed in mice following cisplatin treatment. Toxicology 2008, 250 (2–3), 82–88. [DOI] [PMC free article] [PubMed] [Google Scholar]
- Kimbrough R. D. Toxic effects of the herbicide paraquat. Chest 1974, 65 (Suppl.), 65S–67S. [DOI] [PubMed] [Google Scholar]
- Rogers P. A.; Spillane T. A.; Fenlon M.; Henaghan T. Suspected paraquat poisoning in pigs and dogs. Vet. Rec. 1973, 93 (2), 44–45. [DOI] [PubMed] [Google Scholar]
- Vale J. A.; Meredith T. J.; Buckley B. M. Paraquat poisoning: clinical features and immediate general management. Hum. Toxicol. 1987, 6 (1), 41–47. [DOI] [PubMed] [Google Scholar]
- Ascherio A.; Chen H.; Weisskopf M. G.; O’Reilly E.; McCullough M. L.; Calle E. E.; et al. Pesticide exposure and risk for Parkinson’s disease. Ann. Neurol. 2006, 60 (2), 197–203. [DOI] [PubMed] [Google Scholar]
- Kamel F.; Engel L. S.; Gladen B. C.; Hoppin J. A.; Alavanja M. C.; Sandler D. P. Neurologic symptoms in licensed pesticide applicators in the Agricultural Health Study. Hum. Exp. Toxicol. 2007, 26 (3), 243–250. [DOI] [PubMed] [Google Scholar]
- Samai M.; Sharpe M. A.; Gard P. R.; Chatterjee P. K. Comparison of the effects of the superoxide dismutase mimetics EUK-134 and tempol on paraquat-induced nephrotoxicity. Free Radical Biol. Med. 2007, 43 (4), 528–534. [DOI] [PubMed] [Google Scholar]
- Molck A. M.; Friis C. Transport of paraquat by isolated renal proximal tubular segments from rabbits. Pharmacol. Toxicol. 1998, 83 (5), 208–213. [DOI] [PubMed] [Google Scholar]
- Cristovao A. C.; Choi D. H.; Baltazar G.; Beal M. F.; Kim Y. S. The role of NADPH oxidase 1-derived reactive oxygen species in paraquat-mediated dopaminergic cell death. Antioxid. Redox Signaling 2009, 11 (9), 2105–2118. [DOI] [PMC free article] [PubMed] [Google Scholar]
- Liochev S. I.; Fridovich I. The role of O2.- in the production of HO.: in vitro and in vivo. Free Radical Biol. Med. 1994, 16 (1), 29–33. [DOI] [PubMed] [Google Scholar]
- Winterbourn C. C.; Sutton H. C. Hydroxyl radical production from hydrogen peroxide and enzymatically generated paraquat radicals: catalytic requirements and oxygen dependence. Arch. Biochem. Biophys. 1984, 235 (1), 116–126. [DOI] [PubMed] [Google Scholar]
- Clejan L.; Cederbaum A. I. Synergistic interactions between NADPH-cytochrome P-450 reductase, paraquat, and iron in the generation of active oxygen radicals. Biochem. Pharmacol. 1989, 38 (11), 1779–1786. [DOI] [PubMed] [Google Scholar]
- Fernandez A.; Kiefer J.; Fosdick L.; McConkey D. J. Oxygen radical production and thiol depletion are required for Ca(2+)-mediated endogenous endonuclease activation in apoptotic thymocytes. J. Immunol. 1995, 155 (11), 5133–5139. [PubMed] [Google Scholar]
- Fukushima T.; Yamada K.; Isobe A.; Shiwaku K.; Yamane Y. Mechanism of cytotoxicity of paraquat. I. NADH oxidation and paraquat radical formation via complex I. Exp. Toxicol. Pathol. 1993, 45 (5–6), 345–349. [DOI] [PubMed] [Google Scholar]
- Ge W.; Zhang Y.; Han X.; Ren J. Cardiac-specific overexpression of catalase attenuates paraquat-induced myocardial geometric and contractile alteration: role of ER stress. Free Radical Biol. Med. 2010, 49 (12), 2068–2077. [DOI] [PMC free article] [PubMed] [Google Scholar]
- Niso-Santano M.; Bravo-San Pedro J. M.; Gomez-Sanchez R.; Climent V.; Soler G.; Fuentes J. M.; et al. ASK1 overexpression accelerates paraquat-induced autophagy via endoplasmic reticulum stress. Toxicol. Sci. 2011, 119 (1), 156–168. [DOI] [PubMed] [Google Scholar]
- Chan B. S.; Lazzaro V. A.; Seale J. P.; Duggin G. G. The renal excretory mechanisms and the role of organic cations in modulating the renal handling of paraquat. Pharmacol. Ther. 1998, 79 (3), 193–203. [DOI] [PubMed] [Google Scholar]
- Chui Y. C.; Poon G.; Law F. Toxicokinetics and bioavailability of paraquat in rats following different routes of administration. Toxicol. Ind. Health 1988, 4 (2), 203–219. [DOI] [PubMed] [Google Scholar]
- Jonker J. W.; Schinkel A. H. Pharmacological and physiological functions of the polyspecific organic cation transporters: OCT1, 2, and 3 (SLC22A1–3). J. Pharmacol. Exp. Ther. 2004, 308 (1), 2–9. [DOI] [PubMed] [Google Scholar]
- Lash L. H.; Putt D. A.; Cai H. Membrane transport function in primary cultures of human proximal tubular cells. Toxicology 2006, 228 (2–3), 200–218. [DOI] [PubMed] [Google Scholar]
- Meyer zu Schwabedissen H. E.; Verstuyft C.; Kroemer H. K.; Becquemont L.; Kim R. B. Human multidrug and toxin extrusion 1 (MATE1/SLC47A1) transporter: functional characterization, interaction with OCT2 (SLC22A2), and single nucleotide polymorphisms. Am. J. Physiol. 2010, 298 (4), F997–F1005. [DOI] [PubMed] [Google Scholar]
- Ohta K. Y.; Inoue K.; Yasujima T.; Ishimaru M.; Yuasa H. Functional characteristics of two human MATE transporters: kinetics of cimetidine transport and profiles of inhibition by various compounds. J. Pharm. Pharm. Sci. 2009, 12 (3), 388–396. [DOI] [PubMed] [Google Scholar]
- Alnouti Y.; Petrick J. S.; Klaassen C. D. Tissue distribution and ontogeny of organic cation transporters in mice. Drug Metab. Dispos. 2006, 34 (3), 477–482. [DOI] [PubMed] [Google Scholar]
- Duan H.; Wang J. Selective transport of monoamine neurotransmitters by human plasma membrane monoamine transporter and organic cation transporter 3. J. Pharmacol. Exp. Ther. 2010, 335 (3), 743–753. [DOI] [PMC free article] [PubMed] [Google Scholar]
- Iwata D.; Kato Y.; Wakayama T.; Sai Y.; Kubo Y.; Iseki S.; et al. Involvement of carnitine/organic cation transporter OCTN2 (SLC22A5) in distribution of its substrate carnitine to the heart. Drug Metab. Pharmacokinet. 2008, 23 (3), 207–215. [DOI] [PubMed] [Google Scholar]
- Masuda S.; Terada T.; Yonezawa A.; Tanihara Y.; Kishimoto K.; Katsura T.; et al. Identification and functional characterization of a new human kidney-specific H+/organic cation antiporter, kidney-specific multidrug and toxin extrusion 2. J. Am. Soc. Nephrol. 2006, 17 (8), 2127–2135. [DOI] [PubMed] [Google Scholar]
- Tsuda M.; Terada T.; Ueba M.; Sato T.; Masuda S.; Katsura T.; et al. Involvement of human multidrug and toxin extrusion 1 in the drug interaction between cimetidine and metformin in renal epithelial cells. J. Pharmacol. Exp. Ther. 2009, 329 (1), 185–191. [DOI] [PubMed] [Google Scholar]
- Chen Y.; Zhang S.; Sorani M.; Giacomini K. M. Transport of paraquat by human organic cation transporters and multidrug and toxic compound extrusion family. J. Pharmacol. Exp. Ther. 2007, 322 (2), 695–700. [DOI] [PubMed] [Google Scholar]
- Zambrowicz B. P.; Abuin A.; Ramirez-Solis R.; Richter L. J.; Piggott J.; BeltrandelRio H.; et al. Wnk1 kinase deficiency lowers blood pressure in mice: a gene-trap screen to identify potential targets for therapeutic intervention. Proc. Natl. Acad. Sci. U.S.A. 2003, 100 (24), 14109–14114. [DOI] [PMC free article] [PubMed] [Google Scholar]
- Konig J.; Zolk O.; Singer K.; Hoffmann C.; Fromm M. Double-transfected MDCK cells expressing human OCT1/MATE1 or OCT2/MATE1: determinants of uptake and transcellular translocation of organic cations. Br. J. Pharmacol. 2011, 163 (3), 546–555. [DOI] [PMC free article] [PubMed] [Google Scholar]
- Tsuda M.; Terada T.; Mizuno T.; Katsura T.; Shimakura J.; Inui K. Targeted disruption of the multidrug and toxin extrusion 1 (mate1) gene in mice reduces renal secretion of metformin. Mol. Pharmacol. 2009, 75 (6), 1280–1286. [DOI] [PubMed] [Google Scholar]
- Neves F. F.; Sousa R. B.; Pazin-Filho A.; Cupo P.; Elias Junior J.; Nogueira-Barbosa M. H. Severe paraquat poisoning: clinical and radiological findings in a survivor. J. Bras. Pneumol. 2010, 36 (4), 513–516. [DOI] [PubMed] [Google Scholar]
- Ecker J. L.; Hook J. B.; Gibson J. E. Nephrotoxicity of paraquat in mice. Toxicol. Appl. Pharmacol. 1975, 34 (1), 178–186. [DOI] [PubMed] [Google Scholar]
- Nakagawa I.; Suzuki M.; Imura N.; Naganuma A. Enhancement of paraquat toxicity by glutathione depletion in mice in vivo and in vitro. J. Toxicol. Sci. 1995, 20 (5), 557–564. [DOI] [PubMed] [Google Scholar]
- Wang E. J.; Snyder R. D.; Fielden M. R.; Smith R. J.; Gu Y. Z. Validation of putative genomic biomarkers of nephrotoxicity in rats. Toxicology 2008, 246 (2–3), 91–100. [DOI] [PubMed] [Google Scholar]
- Wasilewska A.; Zoch-Zwierz W.; Taranta-Janusz K.; Michaluk-Skutnik J. Neutrophil gelatinase-associated lipocalin (NGAL): a new marker of cyclosporine nephrotoxicity?. Pediatr. Nephrol. 2010, 25 (5), 889–897. [DOI] [PubMed] [Google Scholar]
- Nies A. T.; Koepsell H.; Damme K.; Schwab M. Organic cation transporters (OCTs, MATEs), in vitro and in vivo evidence for the importance in drug therapy. Handb. Exp. Pharmacol. 2011, 201, 105–167. [DOI] [PubMed] [Google Scholar]
- Chan B. S.; Lazzaro V. A.; Seale J. P.; Duggin G. G. Transport of paraquat by a renal epithelial cell line, MDCK. Renal Failure 1997, 19 (6), 745–751. [DOI] [PubMed] [Google Scholar]
- Li Y.; Yuan H.; Yang K.; Xu W.; Tang W.; Li X. The structure and functions of P-glycoprotein. Curr. Med. Chem. 2010, 17 (8), 786–800. [DOI] [PubMed] [Google Scholar]
- Dinis-Oliveira R. J.; Remiao F.; Duarte J. A.; Ferreira R.; Sanchez Navarro A.; Bastos M. L.; et al. P-glycoprotein induction: an antidotal pathway for paraquat-induced lung toxicity. Free Radical Biol. Med. 2006, 41 (8), 1213–1224. [DOI] [PubMed] [Google Scholar]
- Stein W. D. Kinetics of the multidrug transporter (P-glycoprotein) and its reversal. Physiol. Rev. 1997, 77 (2), 545–590. [DOI] [PubMed] [Google Scholar]
- Ko G. J.; Grigoryev D. N.; Linfert D.; Jang H. R.; Watkins T.; Cheadle C.; et al. Transcriptional analysis of kidneys during repair from AKI reveals possible roles for NGAL and KIM-1 as biomarkers of AKI-to-CKD transition. Am. J. Physiol. 2010, 298 (6), F1472–F1483. [DOI] [PubMed] [Google Scholar]
- Ferguson M. A.; Vaidya V. S.; Bonventre J. V. Biomarkers of nephrotoxic acute kidney injury. Toxicology 2008, 245 (3), 182–193. [DOI] [PMC free article] [PubMed] [Google Scholar]
- Liou H. H.; Tsai M. C.; Chen C. J.; Jeng J. S.; Chang Y. C.; Chen S. Y.; et al. Environmental risk factors and Parkinson’s disease: a case-control study in Taiwan. Neurology 1997, 48 (6), 1583–1588. [DOI] [PubMed] [Google Scholar]
- Nistico R.; Mehdawy B.; Piccirilli S.; Mercuri N. Paraquat- and rotenone-induced models of Parkinson’s disease. Int. J. Immunopathol. Pharmacol. 2011, 24 (2), 313–322. [DOI] [PubMed] [Google Scholar]
- Wang A.; Costello S.; Cockburn M.; Zhang X.; Bronstein J.; Ritz B. Parkinson’s disease risk from ambient exposure to pesticides. Eur. J. Epidemiol. 2011, 26 (7), 547–555. [DOI] [PMC free article] [PubMed] [Google Scholar]
- Chen Y.; Teranishi K.; Li S.; Yee S. W.; Hesselson S.; Stryke D.; et al. Genetic variants in multidrug and toxic compound extrusion-1, hMATE1, alter transport function. Pharmacogenomics J. 2009, 9 (2), 127–136. [DOI] [PMC free article] [PubMed] [Google Scholar]
- Becker M. L.; Visser L. E.; van Schaik R. H.; Hofman A.; Uitterlinden A. G.; Stricker B. H. Genetic variation in the multidrug and toxin extrusion 1 transporter protein influences the glucose-lowering effect of metformin in patients with diabetes: a preliminary study. Diabetes 2009, 58 (3), 745–749. [DOI] [PMC free article] [PubMed] [Google Scholar]