

Abstract
Hypocretin (Hcrt) cell loss is responsible for narcolepsy, but Hcrt's role in normal behavior is unclear. We found that Hcrt knock-out mice were unable to work for food or water reward during the light phase. However, they were unimpaired relative to wild-type (WT) mice when working for reward during the dark phase or when working to avoid shock in the light or dark phase. In WT mice, expression of Fos in Hcrt neurons occurs only in the light phase when working for positive reinforcement. Expression was seen throughout the mediolateral extent of the Hcrt field. Fos was not expressed when expected or unexpected unearned rewards were presented, when working to avoid negative reinforcement, or when given or expecting shock, even though these conditions elicit maximal electroencephalogram (EEG) arousal. Fos was not expressed in the light phase when light was removed. This may explain the lack of light-induced arousal in narcoleptics and its presence in normal individuals. This is the first demonstration of such specificity of arousal system function and has implications for understanding the motivational and circadian consequences of arousal system dysfunction. The current results also indicate that comparable and complementary specificities must exist in other arousal systems.
Introduction
Dysfunction of the hypocretin (Hcrt; orexin) system in humans, mice, rats, and dogs produces narcolepsy (Chemelli et al., 1999; Lin et al., 1999; Peyron et al., 2000; Thannickal et al., 2000; Sinton, 2011). In normal animals, administration of Hcrt into a variety of brain sites (Nakamura et al., 2000; España et al., 2001; Korotkova et al., 2003; Mieda et al., 2004; Deadwyler et al., 2007) is arousing, and lesion of Hcrt cells (Gerashchenko et al., 2001) causes sleepiness. Hcrt neurons reach maximal activity during waking and are minimally active during sleep (Lee et al., 2005; Mileykovskiy et al., 2005). An agent that blocks both Hcrt receptors has been shown to be effective as a hypnotic (Brisbare-Roch et al., 2007). A considerable amount of work has suggested that Hcrt release is linked to food intake (Sakurai et al., 1998), but some recent work has raised doubts about the specificity of this relation (Wu et al., 2002; Siegel, 2004; Funato et al., 2009).
In general, prior studies of the behavioral role of Hcrt in rodents have examined Hcrt function only during either the light (normal sleep) or dark (normal waking) phase, not both, and often during only one task. In the current study, we examined both the behavioral capabilities of Hcrt knock-out (KO) mice and the activity of Hcrt neurons, as indicated by expression of Fos in their normal (WT) littermates. We compared these variables during the light and dark phases (i.e., the 12 h periods in which lights were on or off). We tested these animals on tasks motivated by food or water reinforcement, on tasks motivated by shock avoidance, as well as in response to reward or punishment not contingent on behavior.
Surprisingly, we find that Hcrt KO mice were only deficient at working for positive reward in the light phase. They learn at the same rate as their WT littermates, and they were completely unimpaired in working for the same reward in the dark phase.
Consistent with the data in the KOs, the activity of these cells in their WT littermates, as indicated by Fos expression, was maximal when working for positive reward during the light phase, but these cells were not activated when performing the same task in the dark phase. In addition, the activation of Hcrt cells was light dependent, so that these cells were not activated by the same task in the circadian light phase to which they were adapted, in the absence of illumination. Hcrt cells were not activated by reward alone. During the light phase, when the animals receive expected or unexpected rewards, not contingent on bar pressing (operant) behavior but dispensed in the same pattern and quantity as in the bar press sessions, no activation of Fos was observed in Hcrt cells. Hcrt cells were not activated during shock avoidance in either the light or dark phase, despite maximal levels of EEG arousal. We hypothesize that activity of Hcrt neurons is linked to the arousal required for working for rewards in the light phase.
Materials and Methods
Subjects
All the procedures were approved by the Institutional Animal Care and Use Committee of the University of California at Los Angeles and of the Veterans Administration Greater Los Angeles Health Care System. Prepro-hypocretin mutated C57BL/6J-129/SvEv mice were generated as reported previously (Chemelli et al., 1999). They were maintained as heterozygotes and crossed to obtain null mutants (KO) and WT littermates. The genotype of Hcrt KO mice was identified by PCR using the previously described method (Kayaba et al., 2003). Briefly, DNA extracted from a tail biopsy was amplified using the 5′ primer GAC CTA TCA GGA CAT AGC GTT GGC and the 3′ primer TCA CCC CCT TGG GAT AGC CCT TTC for the mutant allele, and the 5′ primer, GAC GAC GGC CTC AGA CTT CTT GGG with the same 3′ primer to identify the WT allele. Mice used in this study were 2–4 months old at the beginning of the procedures. Male Hcrt KO mice (n = 26) and male WT littermates (n = 70) were used. Genotyping was further confirmed by brain immunohistochemistry using rabbit anti-Hcrt B (H-003–32, Phoenix Pharmaceutical). Animals were kept inside sound-attenuating light-tight chambers with white noise produced by ventilating fans in a laboratory room in a one-story building with unoccupied adjacent rooms, and entry only by the experimenters running the study. The room was maintained at 22 ± 1°C on a 12 h light (45 lux)/dark (0.03 lux) cycle (lights on at 7:00 A.M. and off at 7:00 P.M.). All animals were obtained from the University of California at Los Angeles animal facility.
Apparatus
Experimental sessions were conducted in mouse operant conditioning cages [17.8 × 17.8 × 30.5 cm; model H10–11M-TC, Coulbourn Instruments (all equipment for behavioral tests was obtained from this company)]. These were located within ventilated sound-attenuating isolation cubicles (65.4 × 52.7 × 61.6 cm; model H10–24 TA, with Modular Floor, model H10–11M-TC-SF). Each cubicle was equipped with an infrared CCD camera (KPC-S50 NV, Sony) connected to a computer. Every experimental session was recorded for behavioral analysis. Each cage was equipped with one lever (1.9 × 0.9 cm) located 0.6 cm above the grid floor, triple LCD cue lights (model H11–02M), a speaker on the opposite side of the recording chamber and a house light on top of the cage. For the food reinforcement paradigm, pellets were delivered from a motor-driven feeder (model H14–23M) to either a pellet trough or, in animals implanted for the EEG studies, to a plastic tray (9.5 cm long × 4 cm wide × 2 cm high) located on the left side of the lever, so as to prevent the implant from impeding access to the food. For the water reinforcement paradigm, water was delivered by a motor-driven dipper (model H14–05M), which was accessible through a receptacle opening (2.3 × 2.5 cm) located on the left side of the lever. The dipper contained a 0.01-cc-volume cup machined into the end of the arm. For the negative reinforcement paradigm, electrical stimulation was delivered to the grid cage floor (1 s, 150–500 μA) (model H13–15). Light in the chamber during light-phase testing was 11.4 lux (white house light) and 0.07 lux (red cue light). During dark-phase testing, only the red cue light was on. The red cue light flickered, 0.1 s on then 0.1 s off, for 3 s when a reward was delivered. For the comparison of Fos activation with and without light, only the red cue light was activated. When the sessions ended, all interior lights were off (0.03 lux) and the subjects were returned to their home cages.
Quantification of food intake
For the food bar press condition, animals were maintained at 85–90% of their initial body weight by restricting food intake. Food (LabDiet, PMI Nutrition) was rationed based on each animal's daily weight. Once the animal's weight became stable, food intake was restricted and measured for 120 min between 11:00 A.M. and 1:00 P.M. each day for 2 weeks in the home cage. Water was available ad libitum.
Quantification of water intake
For the water bar press condition, animals were water restricted, allowing access twice daily for a total of 90 min. Drinking sessions were divided into two periods: 60 min (11:00 A.M. to 12:00 P.M.) and then 30 min (3:00 P.M. to 3:30 P.M.). Once the animals had adapted to the drinking schedule, water intake was measured for 60 min between 11:00 A.M. and 12:00 P.M. using a graduated cylinder each day for 2 weeks in the home cage. Food was available ad libitum.
Chamber control
Mice were food restricted to maintain 85–90% of their original body weight following the same procedure as for the food operant task. Once the animals' weight had stabilized, mice were placed in the operant conditioning chambers daily for 120 min, starting 2 h after the onset of the light phase (between 9:00 A.M. and 1:00 P.M.) or 2 h into the dark phase (between 9:00 P.M. and 1:00 A.M.). Both the house light and the cue light were on during the light sessions. All experimental sessions had a duration of 120 min and lasted for 5 weeks. No food, water, or footshock was given during the sessions.
Surgical procedures: EEG and EMG electrode implantation
Eight animals, 5 KO and 3 WT were implanted with cortical EEG and neck muscle electromyogram (EMG) electrodes under aseptic conditions. Anesthesia was induced with a mixture of ketamine/xylazine (100 mg/kg/15 mg/kg, i.p.) and then maintained with a gas mixture of isoflurane in oxygen (0.6–1.2%) after the animals were placed in the stereotaxic device. Body temperature was maintained with a water-circulated heating pad (Gaymar Industries). The head was positioned in the stereotaxic frame, and the skull was exposed. Four stainless steel screw electrodes, two in the frontal bones [anteroposterior (AP): +1 mm; lateral: ±1.5 mm, relative to bregma) and two in the parietal bones (AP: +1 mm; lateral: ±1.5 mm, relative to lambda), were implanted to record the EEG. Two other stranded stainless steel wire electrodes were placed in the neck muscles to record EMG activity. All six electrode leads were inserted into a plastic head plug (SL6C/SB, Plastics One) that was then fixed to the skull with dental cement. A postsurgical recovery period of 2 weeks was allowed before any training was conducted.
EEG and EMG recordings
Recordings were done of the mice both during performance in the operant chamber and during the spontaneous sleep/wake cycle in their home cages. Cortical EEG was filtered between 0.3 and 100 Hz and sampled at a rate of 128 Hz. The EMG was filtered between 30 Hz and 3 kHz and sampled at 1 kHz. EEG and EMG signals were digitized with the CED1401 Plus (Cambridge Electronic Design) interface and recorded on a computer using Spike2 software (Cambridge Electronic Design).
Behavioral training
Operant tasks
Positive reinforcement, food reward.
The training schedules for all behavioral and histological experiments are depicted in the diagrams of Figure 1(operant tasks) and Figure 2 (nonoperant tasks). Mice were food restricted to maintain 85–90% of their original body weight (food amount: approximately 3–3.5 g/d vs regular portion of 4–4.5 g/d) and were exposed daily to 20 mg of food pellets (Dustless Precision Pellets F0071, BioServe). All training sessions and most experiments were performed within this weight range. In selected experiments described above, animals were kept at 70–75% or 100% of their initial weight.
Figure 1.

Diagram of the training schedules for operant conditions for WT and KO animals. Operant conditions: 1a, food reinforcement training schedule for the light and dark phases at 85–90% body weight, the different levels of body weight (70–75% and 100%) in the light phase, 100% body weight in the dark phase; 1b, subjective day; 2, water reinforcement training schedule; 3, shock avoidance training schedule. FR, Fixed ratio; PR, progressive ratio.
Figure 2.

Diagram of the training schedules for nonoperant conditions for WT and KO animals. Nonoperant conditions: 1, expected and unexpected reward; 2, unavoidable footshock; 3, chamber control; VI-4, variable interval-4 min (food delivery with no contingency on lever pressing); FI-5 fixed interval-5 min.
Once the animals' weight had stabilized (14 d; average weight: WT mice, 28.5 ± 0.7 g; KO mice, 29.3 ± 0.9 g), training began with 1 week of acclimation (120 min/d) to the operant conditioning cages, followed by two 30 min sessions of magazine training, during which a food pellet was delivered on a variable interval, 1 min with no contingency on lever pressing (VI-1 min) (food pellet was delivered randomly between 20 and 100 s by the operating computer) and upon bar pressing. Shaping then commenced to train the animals to press the lever for food. Once shaping was completed, the animals were placed on a fixed ratio of 1 (FR1) schedule in which a food pellet was dispensed upon a single press of the lever. The session ended after 30 min or 20 pellets, whichever came first. Successful completion of the FR1 schedule was achieved when the animals received all 20 pellets within 10 min in three consecutive sessions. The ratio was then increased to FR3 and finally FR5, and the session duration increased to 60 min. Upon successful completion of FR5 (three consecutive sessions in which the animal finished the 20 pellets in 15 min), mice were trained on a progressive ratio of 1 (PR1) schedule of reinforcement, where the number of lever presses required to receive a reinforcement is increased by 1 after each reward (i.e., 1, then 2, then 3, then 4 presses, and so on) were needed to get successive pellets. Each session had a total duration of 120 min. The step size was increased from PR1 to PR3 and finally to PR5 with five consecutive sessions under each protocol. There was no limit to the number of food pellets that could be received in PR3 and PR5 sessions. However, in PR5 the apparatus was programmed to terminate the session if the animal did not press the lever for 15 min. The average weight of the WT was 29.1 ± 1.0 g, and that of the KO was 28.7 ± 1.0 g after the initial training.
For animals that completed the 120 min session, the final ratio of bar presses per pellet reached at the end of the session was used for analysis. For the animals that did not complete the 120 min PR5 session (early termination), the break point (BP) was operationally defined as the last ratio completed (resulting in the delivery of a food reward) before the session terminated. The BP or final ratio of the last three PR5 trials were averaged and used for statistical comparisons. Food supplements were given after each session to keep all animals at their respective body weights (70–75%, 85–90%, or 100% of their initial weight).
Operant sessions for food reward were run during both the light and the dark phases. For the light-phase sessions, animals were run starting 2 h after the onset of the light phase (between 9:00 A.M. and 1:00 P.M.). For the dark-phase sessions, animals were run 2 h after the onset of the dark phase (between 9:00 P.M. and 1:00 A.M.).
Positive reinforcement, water reward.
Mice were trained for water reward on a regime similar to that used for food reward. Mice were first water restricted for 14 d, having free access to water for 90 min per day. The animals were then acclimated to the operant conditioning cages for 60 min per day for a week. This was followed by 2 d of 1 h sessions of magazine training during which water was available to the animals for 4 s per delivery under a VI-1 min schedule and upon bar pressing. During the second phase of training, animals were first trained to press the lever for water (shaping) and then put on a FR1 schedule under which water was delivered upon a single press of the lever. The session ended after 60 min. After each training session, animals were allowed access to water twice a day for a total of 90 min. Drinking sessions were divided into two periods: 60 min and then 30 min with a 4 h interval between the sessions. Successful completion of the FR1 schedule was achieved when the animals pressed at least 100 times within 60 min in three consecutive sessions. The ratio was then increased to FR3, then FR5. Upon successful completion of the FR5 schedule (at least 500 presses within 60 min) animals were trained on a PR schedule following the same procedure as in the food operant condition, but session time remained at 60 min. The water access time for the mice was reduced to 3 s in PR schedules. Five consecutive sessions of each schedule (PR1 and PR3) were conducted. The BP and final ratio were defined using the same criteria as for the food paradigm, and the last three PR3 trials were averaged and used for statistical comparisons.
Negative reinforcement, shock avoidance.
Mice were given a period of 1 week (120 min per day) to acclimate to the operant conditioning chambers. We then determined the shock threshold for each mouse by varying levels of shock from 0.06 to 0.4 mA (at 0.05 mA increments) using the modified titration method of Turner et al. (1967). We performed first an ascending shock intensity series, then a descending series and finally a random sequence for each mouse. Each shock lasted for 1 s with an interstimulus interval of 15 s and a 30 s pause between the series. An observer blind to the magnitude of the stimulus quantified the reaction on a scale from 0 to 4 (0 = no response, 1 = flinch, 2 = hop/move forward or backward, 3 = run, and 4 = jump). An intensity was chosen for each animal that produced a scale response of 2.
Animals were first shaped to press the lever to avoid the shock. After shaping, animals were put under FR1 schedule with the following protocol: 30 s after the animal was placed in the cage, a green warning light and an 80 dB tone (2 kHz) came on for 10 s, indicating the beginning of the session. Fifteen seconds later, a warning signal that consisted of an 80 dB, 4 kHz tone and the red cue light came on for 10 s. When the lever was pressed once before the end of the 10 s warning period, a 20 s break was given before another warning signal was delivered. Otherwise, a footshock was given. When a shock occurred, 5 s thereafter another warning signal–shock cycle was presented. The session terminated whenever the animal failed to press the lever in 10 consecutive warning signal–shock cycles. The training sessions lasted 30 min. Training continued until there were three consecutive sessions in which the animal avoided at least 80% of the programmed shocks for the session. The number of presses required to postpone the shock was then increased to FR2, FR3, and finally FR5, and the session duration was increased to 60 min. Shock intensity was increased by 0.1 mA (to a maximum 0.4 mA) each time the animal failed to complete the avoidance ratio for five consecutive trials. Upon successful completion of the FR5 schedule, animals were transferred to the PR schedules and the session duration increased to 120 min. For PR schedules that required multiple lever presses to avoid being shocked, each press within the 10 s warning period postponed the shock by another 10 s, until the ratio was completed, and then a 20 s break was provided before another warning signal–shock cycle began. Presses during the 20 s break would postpone the shock for another 10 s, as in the warning period, and count toward completing the ratio. A modified PR schedule was adopted (Grasing et al., 2003) in which an exponential formula was used to generate a more gradual increase of bar press steps than the regular PR bar press schedule, to minimize shock administration while still requiring progressively higher rates of response. For example, in PR1–10 the first 10 shocks could be avoided by one lever press, the subsequent 9 shocks required two presses, the following 8 shocks required three presses, and so on. The same principle was applied for PR2–10 and PR3–10. The session was terminated if the animal failed to avoid 10 consecutive shocks. Once the animal completed the PR2–10 schedule, five trials were run under the PR3–10 schedule and the BP/final ratio scores of the last three trials were averaged for statistical analysis.
Operant sessions for shock avoidance were run during both the light and dark phases. For the light-phase sessions, animals were run starting 2 h after the onset of the light phase (between 9:00 A.M. and 1:00 P.M.). For the dark-phase sessions, animals were run starting 2 h after the onset of the dark phase (between 9:00 P.M. and 1:00 A.M.).
Nonoperant tasks
Expected and unexpected food reward.
Mice were given a week of acclimation (120 min per day) to the recording chambers with the house light on during the light phase, followed by daily exposure to 20 mg of food pellets. Food rationing was then started to maintain 85–90% of their original body weight. Once the animals' weight had stabilized for 14 d, the experimental sessions began and animals were divided into two groups. In the expected reward group animals were placed in the conditioning chamber daily and food pellets were delivered at VI-4 min. Sessions were conducted daily for 4 weeks. In the unexpected reward group, animals were placed in the conditioning chamber daily but pellets were delivered at VI-4 min only on the day the animals were killed. For this group, the pellets were delivered to a food tray on the cage floor rather than the usual food trough so the animals could see the pellets when they were delivered. In both cases, no bar press was required or performed to obtain the pellets. All experimental sessions had a duration of 120 min.
Unavoidable footshock.
Mice were given a period of 1 week (120 min/d) to acclimate to the operant chambers. We then determined the shock threshold for each mouse using the same procedure as described in the shock avoidance group. An intensity (range 0.25–0.4 mA) was chosen for each animal that produced a scale response of 2. Thereafter, animals were placed in the chamber daily (120 min) for 4 weeks. Only on the day of the killing of the animals, an unavoidable footshock (1 s) was delivered at a fixed interval of 5 min (FI-5 min) during the 120 min session.
Immunohistochemical procedures
Double immunohistochemistry for the detection of Fos protein and Hcrt was performed on animals after 120 min of operant tasks, nonoperant tasks, or chamber stay. Eleven different experimental groups were used; 8 during the light phase and 3 during the dark phase. For the food reinforcement task, a PR3 schedule was used.
For the light phase, the following conditions were used: (1) PR food (see Fig. 6aL1); (2) shock avoidance (see Fig. 6aL2); (3) chamber control (see Fig. 6aL3); (4) expected food; (5) unexpected food; (6) shock extinction (animals trained to avoid the footshock until they reached the PR3–10 schedule but with shock not delivered on the day of killing); (7) unavoidable shock; and (8) subjective day (PR food in light phase without the house light on the day of killing).
Figure 6.
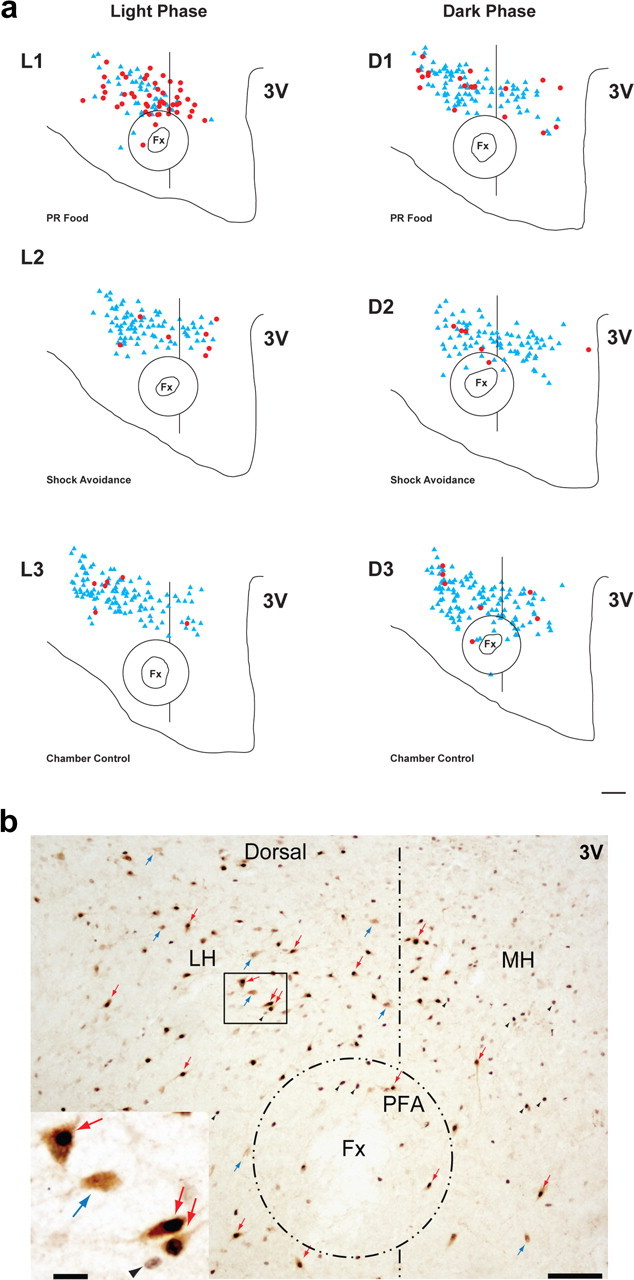
Distribution of Hcrt+ and cFos+/Hcrt+ neurons in the hypothalamus of WT mice under different behavioral conditions. Hcrt neurons express Fos during a food-motivated task in the light phase. Neither food nor shock avoidance tasks increase Fos expression in the dark phase. a, Diagrams of coronal sections of the hypothalamus stained for Hcrt and cFos of six animals each under one of six different experimental conditions during the light and the dark phase: L1, PR food, light phase; L2, shock avoidance, light phase; L3, chamber control, light phase; D1, PR food, dark phase; D2, shock avoidance, dark phase; D3, chamber control, dark phase. Red dots indicate double-labeled cFos+/Hcrt+ neurons; blue triangles correspond to Hcrt+ neurons. Fx, Fornix; 3V, third ventricle. Scale bar, 150 μm. b, Photomicrographs of the same hypothalamic region in a section processed for Hcrt and cFos. LH, Lateral hypothalamus; MH, medial hypothalamus. Scale bar, 150 μm. The rectangular region in the LH is magnified in the insert at the lower left. Scale bar, 20 μm. The double-labeled neurons (red arrows) show the characteristic black nucleus due to the presence of cFos protein and a brown precipitate in the cytoplasm, indicating their hypocretinergic nature. These cells are easily distinguishable from single-labeled hypocretin neurons (blue arrows) and single-labeled cFos cells (black arrowheads).
For the dark phase, the following conditions were used: (1) PR food (see Fig. 6aD1); (2) shock avoidance (Fig. 6aD2); and (3) chamber control (Fig. 6aD3).
Immediately after finishing the sessions, animals were deeply anesthetized with Nembutal (100 mg/kg, i.p.) and transcardially perfused with 0.03 L of heparinized (1000 U/L) PBS (0.1 m, pH 7.4) followed by 0.07 l of 4% paraformaldehyde in phosphate buffer (PB; 0.1 m, pH 7.4). The brain was removed and immersed for 15 min in 4% paraformaldehyde in PB. After postfixation, the tissue was transferred to a 20% and then a 30% sucrose solution for cryoprotection. Forty-eight hours later, the brain was frozen and cut into 35 μm sections using a cryostat (model 1800 Cryocut, Reichert Jung). Each section was placed in one well of a 6-well tray containing PBS. Immunohistochemical procedures were performed immediately.
Detection of Fos was performed by sequential incubation of free-floating sections. The sections were first incubated in rabbit anti-Fos serum (PC-38, Calbiochem), 1:10,000 in PBS, 0.3% Triton X-100 (PBST). They were then exposed to biotinylated goat anti-rabbit IgG (Jackson Immunoresearch) 1:600 in PBST, followed by incubation in standard ABC (Vector Laboratories), 1:400. The tissue was processed by the diaminobenzidine tetrahydrochloride (DAB) nickel-enhanced method, which consisted of tissue immersion in 0.6% nickel ammonium sulfate, 0.02% DAB, and 0.03% hydrogen peroxide in 10 ml of PBS, for 4–5 min. After Fos labeling, tissue was rinsed in PBST and incubated in rabbit anti-Hcrt B (H-003–32, Phoenix Pharmaceutical), 1:10,000, and PBST. Subsequently, the tissue was immersed in biotinylated goat anti-rabbit IgG 1:600 in PBST, followed by incubation in standard ABC 1:400. The tissue was then processed with the DAB method for 4–5 min.
The number and distribution of Hcrt+ and Fos+/Hcrt+ cells were determined in every third section throughout the hypothalamus. A Nikon Eclipse 80i microscope with three-axis motorized stage, video camera, Neurolucida interface, and Stereoinvestigator software (MicroBrightField) was used. Cell counting was performed using the 60× objective by a trained histologist, who was always blind to the treatments. The criteria used in the present work to define the anatomical parcellation of the hypothalamus were based on the Franklin and Paxinos (1997) atlas of the mouse brain. The perifornical area (PFA) was defined as the region surrounding the fornix (140 μm from the perimeter of the structure). The rest of the hypothalamus was further divided into a medial subdivision [medial hypothalamus (MH)], which comprised the area from the medial limit of the fornix to the third ventricle (3 V), and a lateral subdivision [lateral hypothalamus (LH)], which extended from the medial boundary of the fornix to the lateral edge of the hypothalamus (see Fig. 6b).
Data analysis
Data were subjected to either ANOVA followed by Newman–Keuls post hoc test comparisons or t test. All such tests were two tailed. Results were considered to be statistically significant if p < 0.05. EEG power spectra were computed for consecutive 4 s epochs by fast Fourier transform (Hanning window, 0.25 Hz bands) with Spike2 software. For comparing the power spectrum among behavior states, the power within each state was divided by the total power in REM and presented as the percentage of the REM power. Frequencies between 0.5 and 20 Hz were analyzed. Video analysis to quantify behavior was performed by an observer blind to the genotype and the experimental condition.
Results
Positive reinforcement, KO vs WT
Bar pressing for food reward
Hcrt KO mice learned to bar press for food as rapidly as their WT littermates. No differences were seen between KO and WT mice in the number of trials required to reach an FR5 ratio (9.0 ± 1.3, KO vs 9.1 ± 1.3, WT) or the time it took to acquire 20 pellets in FR5 (13.8 ± 2.2 min, KO vs 13.3 ± 1.9 min, WT) in the light phase. However, when food reward was made progressively more difficult to obtain under the PR schedule, during the light phase, Hcrt KO animals showed greatly decreased performance compared with their WT littermates. This is illustrated in the cumulative records of Figure 3a,b. There was a significant effect of genotype (F(1,14) = 9.97, p < 0.01), a significant effect of light-dark phase (F(1,14) = 6.93, p < 0.02), and a significant effect of the interaction of these two factors (F(1,14) = 17.30, p < 0.01) (Fig. 3c). The KO animals showed a significant reduction in the BP/final ratio reached in the PR5 schedule (52.3 ± 6.6 vs 141.3 ± 15.8 for the WT, p < 0.01, Newman–Keuls post hoc test) (Fig. 3c). All Hcrt KO animals displayed frequent pauses during the trials, and all eventually stopped pressing the lever for 15 min, meeting the criterion for termination of the 120 min experimental sessions (average KO session duration 45.6 ± 4.7 min). A detailed analysis of the data showed that during the first 10 min of the experimental sessions in the light phase, the KOs and WTs had a similar pattern of performance (Fig. 3d). Yet, as the sessions progressed, the KOs displayed a significant and steady decrease in the rate of lever pressing in contrast to WTs. There was a significant effect of genotype (F(1,16) = 8.13, p < 0.02) and a significant effect of time in session (F(3,48) = 4.36, p < 0.01) (Fig. 3d). Frequent pauses in the operant behavior were evident in the analysis of the interpress intervals; KO animals showed a greater number of long interpress intervals, especially those >2 s (all p < 0.05, Newman–Keuls post hoc test) (Fig. 3e).
Figure 3.
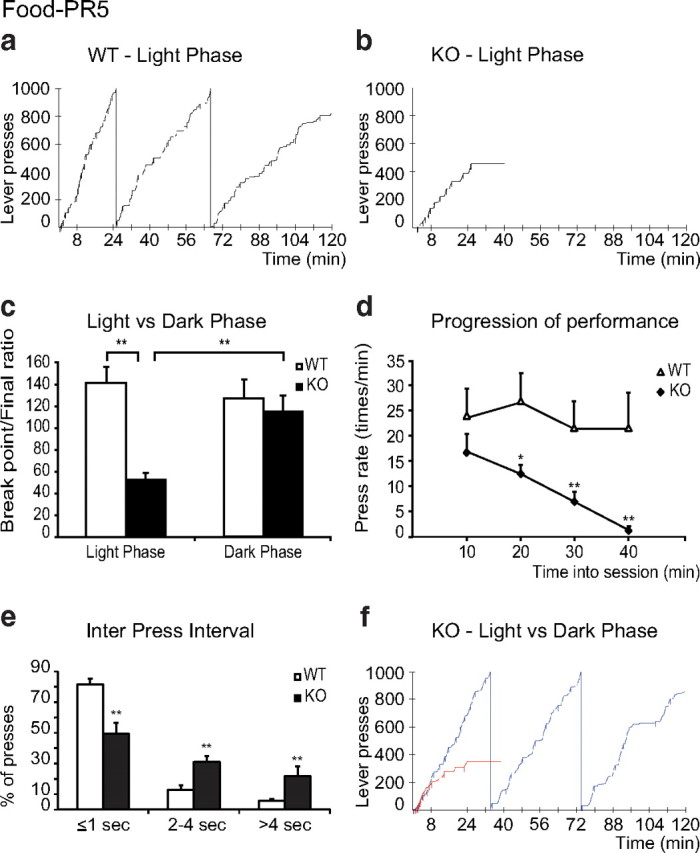
Operant performance of WT and KO mice on PR5 food reinforcement paradigm. Hcrt KO mice are unable to sustain bar pressing for food in the light phase, in contrast to WT mice. a, b, Representative cumulative records of the performance of a WT animal (a, 2817 total presses) and an Hcrt KO animal (b, 456 total presses). The downward pips on the cumulative record denote food deliveries. The KO mouse session was terminated because it ceased pressing the lever for 15 min. c, The final ratios reached by KO were significantly lower than those reached by the WT in the light phase (WT, n = 8; KO, n = 8; mean ± SEM in all figures). No significant difference in performance was found between groups in the dark phase (WT, n = 7; KO, n = 7). d, Performance of WT (open triangles, n = 8) and KO (filled diamonds, n = 8) were analyzed in 10 min intervals during the first 40 min of the light-phase sessions. Performance deteriorates in the KO. e, Comparison of interpress intervals in the light phase for WT (n = 8) and KO (n = 8) animals. Values represent the percentage of presses falling under each interval. KO mice show more long intervals between presses. f, Example of the cumulative records of the same KO animal performing the operant task during the light phase (red line, 351 total presses) and the dark phase (blue line, 2837 total presses). KOs are unimpaired on the same task in the dark phase. **p < 0.01, *p < 0.05, Newman–Keuls post hoc test.
The reduced response of the KOs after the initial period might suggest early satiation. However, the number of pellets received by the KOs during the PR5 schedule was minimal, on average 11 pellets, or 0.22 g, before they quit, compared with the 2.2 g these same animals consumed in a 2 h period of unrestricted feeding at the same time of day when bar press was not required. The latter amount of food was not significantly different from the amount of food consumed by WTs in the home cage in the same 2 h period at the same time of day (p = 0.3, t test) (see Fig. 5c). Therefore, early satiation cannot be the cause of early termination by the KOs.
Figure 5.
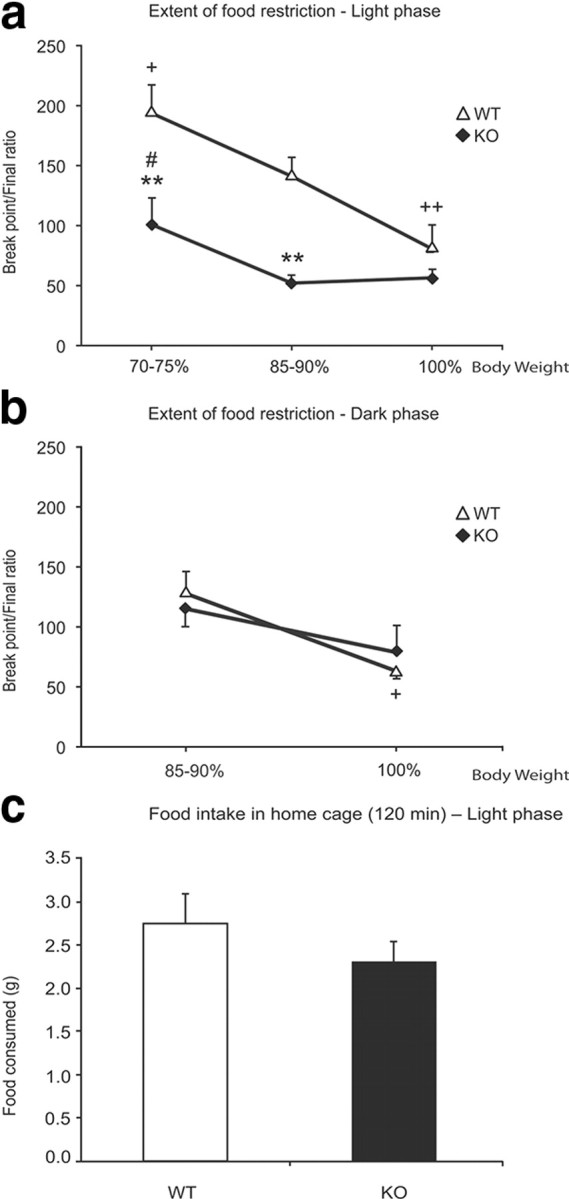
Effect of the extent of food restriction on food operant performance. a, WT and KO animals tested in the light phase at 100%, 85–90%, and 70–75% of their initial body weight. Performance of WT mice improves substantially and linearly with weight restriction, but performance of Hcrt KO mice improves to a much lesser extent, with no improvement after reduction to 85–90% of baseline weight but significant improvement only at 70–75% of baseline weight. Even at 70–75%, KO animals had a significantly lower BP/final ratio than WT animals (**p < 0.01, relative to WT; #p < 0.02 for KO relative to weight at 85–90%; +p < 0.05, ++p < 0.01 for WT relative to weight at 85–90%; Newman–Keuls post hoc test). b, Difference in performances of WT and KO animals in the dark phase under two weight conditions. WT increased their bar press performance at 85–90% ad libitum condition (+p < 0.05, Newman–Keuls post hoc test). At 100% of weight, the performance of KO was not significantly different from WT. The break point ratios of the WT at 85–90% and at 100% do not significantly differ between light and dark phases. We did not run mice at the 70–75% weight conditions in the dark phase because of the light-phase results. c, Average amount of food consumed by WT and KO in 120 min in the home cage when food is freely available (11:00 A.M. to 1:00 P.M.) during the light phase. There is no significant difference in the consumption of food by the two groups (p > 0.05, t test; n = 7 for each genotype).
When the animals were tested during the dark (active) phase, the KO strain showed a dramatic improvement in performance (to a final ratio of 115.0 ± 15.0) compared with their performance during the light (inactive) phase (p < 0.01, Newman–Keuls post hoc) (Fig. 3c), a performance similar to that seen in the WT mice (Fig. 3c). An example of the typical behavior of the same KO animal in both phases is shown in the cumulative records in Figure 3f. The performance during the dark phase is shown in blue, and that during the light phase in red. In a second group of animals, we determined that the difference between performance in the light and dark phases was not a function of the order in which mice were tested under each condition. Operant performance of the Hcrt KOs (n = 5) was equally poor during the light phase the week before (final ratio 43.0 ± 6.1) and the week after being tested in the dark phase (final ratio 50.5 ± 5.0). The performance in the dark phase (final ratio 110.0 ± 10.0) was significantly better than either test during the light phase (p < 0.01, Newman–Keuls post hoc test).
All the KO animals exhibited behavioral “pauses” during the food reward sessions. These were characterized by the mice assuming a crouched position that interrupted their lever pressing. The KO animals displayed these pauses during both light and dark phases, with the number of pauses being significantly higher during the light phase than during the dark phase (15.7 ± 3.1 vs 5.9 ± 1.4 times/h; n = 7 in each group; p = 0.02, t test). The duration of these pauses varied from a few seconds to a few minutes (Fig. 4a,b). During the short pauses (<20 s), the EEG displayed theta rhythm (4–8 Hz activity) with a low-amplitude EMG (i.e., muscle tone was reduced along with the change in the frequency spectrum of the EEG), a pattern indicative of waking drowsiness (Scammell et al., 2009) (Fig. 4a, 1, 2, and 3). The animals' eyes were open and muscle tone was present at greater levels than that seen in sleep. These short pauses were never accompanied by complete muscle atonia, unlike that during rapid eye movement (REM) sleep (Fig. 4b), and thus did not meet the criteria for murine cataplexy (Scammell et al., 2009), but rather resembled drowsiness. With longer pauses, the animals frequently transitioned into non-REM (NREM) sleep, which occasionally led to REM sleep with complete atonia (Fig. 4b). Overall, the spectrum of the EEG during these longer pauses represents a mixture of states that correlates more closely with NREM (r = 0.95) and waking (r = 0.86) than with REM sleep (r = 0.59) (Fig. 4c). The behavioral pauses occurred with the highest frequency on or around the lever (74%) and, less frequently, at one of the corners of the chamber (14%) or by the food tray (inside the tray or in its vicinity; 12%).
Figure 4.
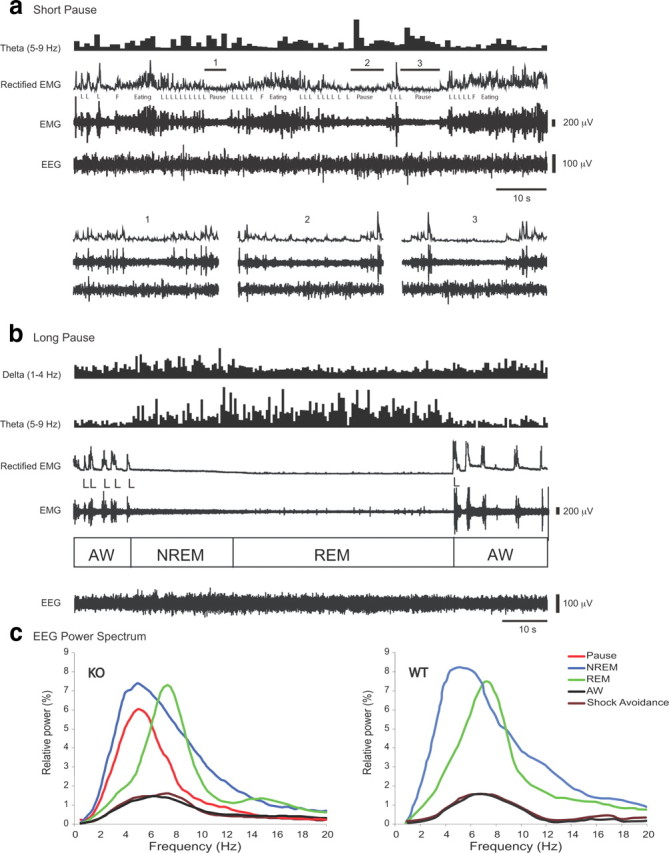
EEG, EEG power spectrum, and EMG of KO mice during operant tasks. There is EEG slowing during pauses in KO mice working for positive reinforcement, indicating that these are sleep attacks, not cataplexy. a, EEG, EMG, and spectral power of the theta rhythm of a KO exhibiting short pauses (1, 2, 3) during a PR5 food reward operant task in the light phase. There is an increase of theta power in the EEG during these short pauses, but no complete EMG atonia is seen, indicating that no cataplexy or REM sleep occurred. Magnified displays of the three short pauses are shown at the bottom. L, Lever press; F, food pellet delivery. b, The same KO animal exhibited a long pause that led to NREM sleep and REM sleep during the operant task. NREM sleep is evident with increase of delta power and reduced EMG, while REM sleep is characterized by increased theta power and EMG atonia. Active waking (AW) is characterized by lower power in all analyzed bands. c, EEG power spectrum, expressed in relative power of REM, of the Hcrt KO animal during the long behavioral pauses seen during positive reinforcement in a PR5 food operant condition in the KOs (pause), during NREM sleep, REM sleep, AW, and shock avoidance. EEG power <9 Hz is increased during pauses. Low voltage spectrum during AW and shock avoidance indicates that the animals had a high degree of EEG activation. WT mice do not have pauses during these tasks and show active waking EEG during both positive reinforcement and shock avoidance.
We assessed the effect of different degrees of food deprivation on operant performance. After the animals were tested in the PR5 schedule, one group of each genotype (n = 3 for each group) was further food restricted to attain 70–75% of their initial body weight, whereas a second group of each genotype was allowed free access to food to reach ad libitum weight (Fig. 1). As expected, during the light phase, the effect of body weight on the performance depended on the genotype (Fig. 5a). There was a significant effect of genotype (F(1,14) = 37.91, p < 0.0001), a significant effect of body weight (F(2,28) = 47.49, p < 0.0001), and a significant interaction of the two factors (F(2,28) = 11.12, p < 0.01). When body weight was reduced to 70–75%, a significant increase in the performance of the WT was observed (Fig. 5a) (p < 0.05, Newman–Keuls post hoc test). On the other hand, although the KOs showed an improvement (Fig. 5a) (p < 0.02, Newman–Keuls post hoc test) at the 70–75% weight, they still performed significantly worse than the WTs (Fig. 5a) (p < 0.01, Newman–Keuls post hoc test). The performance of the WTs at their ad libitum weight in both the light and dark phases was significantly worse than their performance at 85–90% of ad libitum weight (Fig. 5a,b) (p < 0.01 and p < 0.05, respectively, during the light and dark phases; Newman–Keuls post hoc test). In contrast, the performance of the KO animals was not affected by this weight gain, showing the same relatively low level of performance in the light phase at baseline weight as at the 85–90% level (Fig. 5a), indicating that Hcrt is necessary to produce the food deprivation-induced performance gain in the light phase. In contrast to the WT, weight gain from 85–90% to 100%, did not significantly impair performance in the KO mice at a time when it was already comparable to that in WT mice, again suggesting a selective role of Hcrt in producing a response to motivational changes in the light phase (Fig. 5b) (note that because the daytime difference was maximal between 85 and 100% body weight in the light phase, we did not subject the animals to the 70–75% deprivation in the dark phase).
Fos studies in WT mice, positive reinforcement
Bar pressing for food
The number and distribution of Hcrt-immunopositive (Hcrt+) and cFos/Hcrt double-immunostained (cFos+/Hcrt+) cells were assessed in WT littermates of the Hcrt KO mice. The double-labeled cFos+/Hcrt+ neurons were found within the hypothalamic Hcrt field, intermingled with single-labeled Hcrt+ neurons, as seen in Fig. 6a. The photomicrograph in Figure 6b shows an example of immunopositive cells in the LH, MH, and PFA under the food reinforcement paradigm during the light phase. Animals showed a significant increase in Fos expression in Hcrt cells (red dots) during the food reward task in the light phase. They did not express Fos beyond basal levels in shock avoidance or chamber control conditions and also not during the dark phase under any of these conditions (Fig. 7a). There was a significant effect of experimental condition (F(2,18) = 8.24, p < 0.01) and a significant interaction of light-dark phase and the experimental condition (F(2,18) = 7.75, p < 0.01). The increase in cFos expression during food reward was significant relative to control in the light phase (55.2 ± 9% vs 14.9 ± 2.4%, p < 0.01, Newman–Keuls post hoc test) (Fig. 7a). However, Fos expression in Hcrt cells did not increase during the dark phase (19.8 ± 6.7% vs control 15.6 ± 5.5%, p > 0.5, Newman–Keuls post hoc test) (Fig. 7a).
Figure 7.
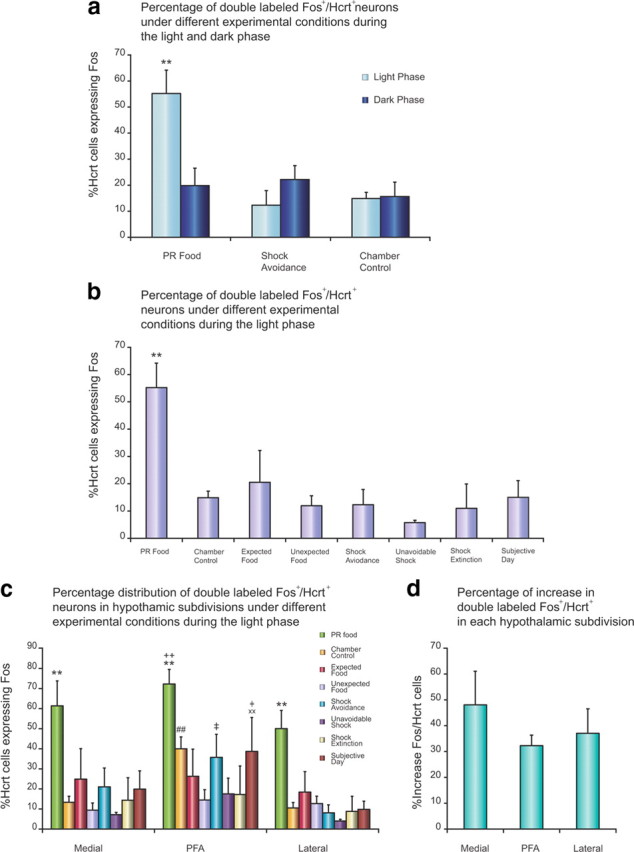
Percentage of Hcrt neurons expressing Fos in the hypothalamus of WT mice under different behavioral conditions. Activation of Hcrt neurons was maximal when bar pressing for food in the light phase, but not when given expected or unexpected food under the same conditions, not during shock avoidance, and not during bar pressing for food when light was absent in the subjective light phase. a, Comparison of the percentage of hypocretin neurons expressing Fos in the PR food, shock avoidance, and chamber control conditions during the light and dark phases (**p < 0.01, Newman–Keuls post hoc test comparing food task during the light phase with all other conditions; n = 4 in each condition). There is no significant difference between the light and dark phases in shock avoidance and chamber control conditions. b, Comparison of the percentage of hypocretin neurons expressing Fos under PR food condition with other behavioral conditions during the light phase (**p < 0.01, Newman–Keuls post hoc test compared with all other conditions; n = 4 in each condition). c, Percentage of the double-labeled cFos+/Hcrt+ cells in the LH, MH, and PFA in different behavioral conditions during the light phase (**p < 0.01, Newman–Keuls post hoc test comparing PR food with all other conditions within each subdivision; ++p < 0.01, Newman–Keuls post hoc test comparing PFA with lateral subdivision in PR food condition; ##p < 0.01 Newman–Keuls post hoc test comparing PFA with lateral and medial subdivisions in chamber control condition; xxp < 0.01 Newman–Keuls post hoc test comparing PFA with lateral and medial subdivisions in subjective day condition; †p < 0.05 Newman–Keuls post hoc test comparing with unexpected food condition within PFA; ‡p < 0.05, Newman–Keuls post hoc test comparing PFA with lateral subdivision in shock avoidance condition). d, Comparison of percentage increase of double-labeled cFos+/Hcrt+ cells among the three subdivisions in PR food condition relative to chamber control. There is no significant difference.
Thus, the Fos study strongly supports the conclusion drawn from the comparison of the performance of Hcrt KO and WT mice; Hcrt cells in WT mice are activated during positive reinforcement in the light phase and the KO animals lacking Hcrt are unable to perform the behavioral task at this time. Conversely, WT mice show minimal Hcrt cell activation during this task in the dark phase and KO mice have no performance deficit in the food bar press task at this time, indicating that non-Hcrt cells mediate this behavior in the dark.
Food reward not contingent on operant behavior
To better understand the determinants of increased Fos expression in the Hcrt neurons during bar pressing for food in the light phase, we subjected the WT mice at 85–90% of baseline weight to one of two conditions. In the first condition, they were trained to expect food to be delivered at variable intervals after they had been placed in the chamber. In the second condition, they had not previously received food in the chamber and were treated to random unexpected arrivals of food in the dispenser only on the day of the study. Both conditions were performed with lights on in the light phase. In both cases, no bar press was required or performed, and the food was eaten rapidly and completely. But, in contrast to the operant reinforcement condition, no significant Fos expression was seen in either the expected or unexpected reinforcement condition compared with control (20.5 ± 11.6% and 11.9 ± 3.7%, respectively; p > 0.5, Newman–Keuls post hoc test) (Fig. 7b). Thus, operant behavior for reward, not just reward, was necessary for Hcrt cell activation.
Bar pressing for water reward
When water was used as the reward in an operant paradigm similar to food reward, a performance deficit was also observed in the KO animals. WT and KO animals learned the task at the same rate, and no significant difference was found in the number of trials to reach the FR5 criteria between the two strains as with the food operant task (20.8 ± 2.6 KO vs 15.2 ± 2.7 WT; p > 0.2, t test). However, under a PR3 schedule during the light phase, the KO animals performed significantly worse than the WTs. This is illustrated in the cumulative records of Figure 8a,b. The KO animals showed a significant reduction in the BP/final ratio reached in the PR3 schedule (23.6 ± 2.9 vs 64.2 ± 9.4 for the KO and WT mice, respectively; p < 0.01, t test) (Fig. 8c). Under this paradigm, the animals displayed behavioral pauses with the same characteristics as the ones previously described in the food operant task. Eventually, all the KO animals stopped pressing the bar for 15 min, resulting in early termination of the session (average session duration 35.6 ± 8.5 min). In contrast, all WT animals performed throughout the sessions. There was no significant difference in water intake between genotypes measured over a 60 min free-access period during the light phase in their home cages (p > 0.15, t test) (Fig. 8d). This study suggests that Hcrt neurons are equally required for the performance of operant tasks reinforced by food or water.
Figure 8.

Operant performance on PR3 water reinforcement paradigm in the light phase. KOs are as deficient in bar pressing for water as they are in bar pressing for food. a, b, Typical examples of the cumulative records showing the difference in performance of a WT (a, 2494 total presses) and a KO (b, 164 total presses). The downward pips on the cumulative record denote water deliveries. c, KO mice showed a significant deficit in the final ratio completed compared with the WT (n = 5 for each genotype; ***p < 0.005, t test). d, There is no difference in the amount of water consumed by the WT and KO mice during the 60 min in the home cage when water is readily available (p > 0.15, t test).
Negative reinforcement, KO vs WT
Animals were trained to bar press to avoid footshock. There was no difference in the number of trials taken to reach the FR5 criteria between the KO (23.7 ± 1.5) and the WT (22.2 ± 2.4) animals. In contrast to the results observed in the two positive reinforcement paradigms, KO and WT animals performed equally well on the progressive ratio task when motivated to bar press to avoid footshocks in the light phase (Fig. 9a,b). There was no significant difference in the final ratio reached by the two groups (38.1 ± 3.4 vs 43.1 ± 3.8 for KO and WT, respectively; p > 0.3, t test) (Fig. 9c). During the negative reinforcement sessions, the KOs did not display any behavioral pauses, and all of the animals, of both genetic backgrounds, completed the 120 min experimental sessions.
Figure 9.
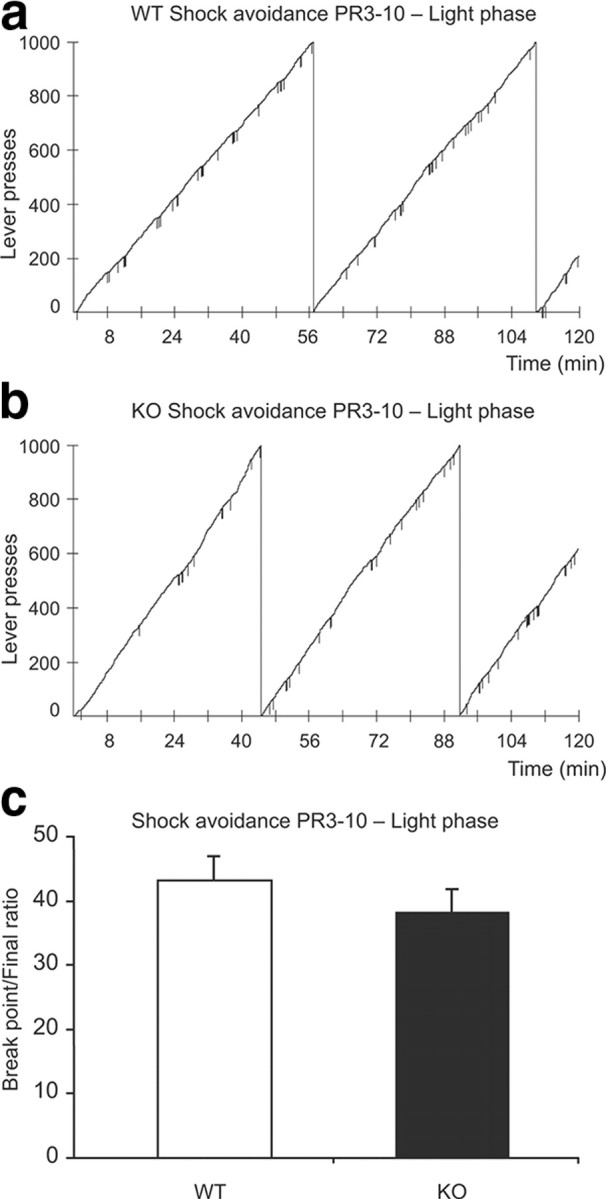
Operant performance on a PR3–10 negative reinforcement condition (shock avoidance) in the light phase. Hcrt KO mice do not differ from WT mice in their performance on the shock avoidance task. a, b, Examples of cumulative records for one experimental session for a WT (a, 2207 total presses) and a KO (b, 2617 total presses) in the shock avoidance task during light phase. The downward pips on the cumulative record denote shock deliveries. c, There is no significant difference in the final ratio reached between the groups (n = 8 for each genotype).
The EEG spectrum of the KOs during the shock avoidance tasks shows that the animals were highly aroused throughout the session, as in spontaneous active waking (r = 0.97) (Fig. 4c). Therefore, Hcrt is not required for the high levels of arousal or optimal performance of this operant task, motivated by avoidance of footshock. The EEG spectrum of a WT mouse performing the same tasks is shown for comparison.
Fos studies in WT, negative reinforcement
Following the footshock avoidance task, only 12.3 ± 5.6% of the Hcrt cells expressed Fos in the light phase and 22.2 ± 5.3% in the dark phase (Fig. 7a). The mice received from 11 to 86 footshocks with an average of 55.8 ± 16.0 shocks in the 120 min session. We also studied Fos expression in WT during unanticipated, unavoidable shocks. This also did not increase Fos expression in Hcrt cells (5.8 ± 0.8%) (Fig. 7b). The level of Fos expression in Hcrt cells during footshock extinction, when the animal continued to bar press but shock was withheld, did not differ from that during the shock avoidance condition (11 ± 8.9% vs 12.3 ± 5.6%) or from the chamber control condition (14.9 ± 2.4%; all p > 0.05, Newman–Keuls post hoc) (Fig. 7b). Fos expression in Hcrt cells under all conditions with footshock was significantly lower than under the food operant reinforcement condition (all p < 0.01, Newman–Keuls post hoc) (Fig. 7b). Thus, despite a high level of arousal, Hcrt neurons in WT mice are not activated by shock, by shock avoidance, or by anxiety conditioned to shock avoidance, consistent with a lack of performance deficit in the Hcrt KO mice under these conditions. The high levels of arousal and operant performance motivated by shock avoidance, or by anxiety in the extinction condition, do not require Hcrt cell activation.
Some prior studies have concluded that Hcrt cells increase their Fos expression in response to footshock or aversive conditions. For example, Winsky-Sommerer et al. (2004) exposed mice to two “mild” footshocks of 0.70 mA, 2 s in duration in a 5.5 min session, or placed them in 50 ml conical tubes that had an opening to allow air flow for 30 min. After either challenge, the mice were released back into their individual cages. They were killed 1 h after the challenge procedure. Thus, the experiment is confounded by combining relatively short-term stress with the presumably pleasurable release from stress into their home cage for the hour before animals were killed. Grooming and exploring, two behaviors linked to maximal activity of Hcrt neurons (Mileykovskiy et al., 2005), typically follow handling in mice and rats. Activities in the last hour before killing are major determinants of Fos expression (Basheer et al., 1997). In contrast, our protocol was designed so that WT mice were in the footshock or food reinforcement sessions performing continuously in all cases for a 2 h period immediately after which they were killed. In these conditions, we see no Fos activation in the operant footshock avoidance, unavoidable shock, or shock extinction conditions and profound activation in the operant food reinforcement condition. Kiss (2007) found no shock-induced activation of Hcrt neurons. Zhu et al. (2002) showed no Fos expression in Hcrt neurons with conditioned fear, although there was Fos expression with brief shock followed by return to the home cage (i.e., presumably, a mixture of pain and relief). Furlong et al. (2009) concluded that Fos expression in Hcrt neurons was maximal during exploration, consistent with our reported data on Hcrt unit activity in the rat (Mileykovskiy et al., 2005).
Role of light
To determine whether the activation of the Hcrt neurons in the food reward task during the light phase was linked to the presence of light in the home cage and operant chamber or to circadian phase, we ran WT mice in this behavioral paradigm with or without light. We found that the increase in Fos expression in Hcrt neurons was seen only when the animals were run in the presence of light (Fig. 7b, PR food). Although WT animals performed equally well in the presence or absence of light (final ratio 134.3 ± 9.1 vs 138.8 ± 13.8, respectively), there was no increase in Fos expression in Hcrt neurons when the light was off at the same circadian time (Fig. 7b, subjective day). This suggests a role for light in the activation of Hcrt neurons.
The effects of light on Hcrt neurons might be mediated directly by inputs from the retinohypothalamic tract (Canteras et al., 2011). Alternatively, it could be mediated indirectly by outputs from the suprachiasmatic nucleus (LeSauter et al., 2011) or by multisynaptic relays from other portions of the visual system. The lack of Fos expression in the shock avoidance conditions indicates that the light activation of Hcrt neurons is gated by inputs linked to the motivational valence of the task.
Lateral versus medial Hcrt cell activation, Fos study
To determine whether there was an anatomical segregation of Hcrt cells expressing Fos under various conditions, we subdivided the hypothalamus into medial, perifornical, and lateral subdivisions, and quantified the number of double-labeled cFos+/Hcrt+ and single-labeled Hcrt+ cells in each subdivision. There was a significant effect of experimental condition (F(7,24) = 3.92, p < 0.01) and a significant effect of anatomical subdivisions (F(2,48) = 26.75, p < 0.0001). There were significantly more cFos+/Hcrt+ cells in every subdivision after bar pressing for food reward in the light phase than after any other experimental condition (all p < 0.01, Newman–Keuls post hoc test) (Fig. 7c). We did not observe a significant difference in the distribution of cFos+/Hcrt+ cells between the lateral and medial subdivisions with bar pressing for food reward. However, the PFA subdivision showed a significantly higher percentage of double-labeled cells compared with the lateral subdivision (p < 0.01, Newman–Keuls post hoc test) (Fig. 7c). Also, the PFA subdivision displayed a significantly higher percentage of double-labeled cells compared with the lateral and medial subdivisions in chamber control animals (all p < 0.01, Newman–Keuls post hoc test) (Fig. 7c). However, there was no significant difference in the percentage increase of cFos+/Hcrt+ cells among subdivisions in the food operant condition relative to chamber control (p > 0.05, Newman–Keuls post hoc test) (Fig. 7d). In addition, all other conditions displayed a similar distribution of cFos+/Hcrt+ cells between the lateral and the medial subdivisions (all p > 0.05, Newman–Keuls post hoc test). Under our conditions, we see no difference between the activation of medial and lateral Hcrt neurons.
A prior study using cFos labeling of Hcrt neurons concluded that Hcrt cells in the lateral hypothalamus regulate reward seeking for both food and abused drugs, whereas those in the perifornical and dorsomedial hypothalamus regulate arousal and response to stress (Harris et al., 2005). There are some subtle projection differences between lateral and medial Hcrt cells, although there is extensive overlap (España et al., 2005). In contrast to this prior work, we do not see a difference between medial and lateral Hcrt neurons in their activation to food reward or in their lack of recruitment in the footshock avoidance task. There are several possible explanations for this difference. Bar pressing for positive reinforcement may activate both populations of Hcrt neurons because of the requirements for operant motor activity and maintenance of waking, compared with the emotions induced by the place conditioning used in the prior study. There may also be species differences, since the aforementioned study was performed in the rat. Other differences in experimental procedure or analysis may also be contributing factors.
Discussion
Arousal systems
Since the pioneering work of Moruzzi and Magoun (1949), the field of sleep and cognitive arousal has been driven by the concept of the ascending activating system. Subsequently, it was discovered that this system is composed of a number of subsystems including cholinergic (Celesia and Jasper, 1966), monoaminergic (Dahlström and Fuxe, 1964), glutamatergic (Lai and Siegel, 1991; Luppi et al., 2006; Schwarz et al., 2008), and, most recently, hypocretinergic (De Lecea et al., 1998) neurons. It has been assumed that these systems work together and redundantly to produce arousal, allowing waking to be restored even after massive lesions (Adametz, 1959; Blanco-Centurion et al., 2007). Because of its projections to all of these systems (Peyron et al., 1998; España et al., 2005; Sakurai et al., 2005), it has been speculated that the hypocretin system might act as a master synchronizer of arousal. The current work suggests a different view.
Behavioral role of hypocretin
Whereas Hcrt is known to play an important role in arousal, and the lack of Hcrt to cause chronic sleepiness, we show that hypocretin neurons have minimal activity even during the intense arousal elicited by the expectation of footshocks or by the delivery of such footshocks. The EEG arousal that we see in the absence of Hcrt activation must be mediated by other arousal systems.
In addition, the current work identifies a specialized behavioral role of the hypocretin neurons. Mice and rats are nocturnal animals. This means that the net effect of light is to inhibit their arousal systems. Indeed, Hcrt neurons in rats in their home cage tend to be somewhat less active during the light phase than the dark phase under baseline conditions, as indicated by Fos expression (Estabrooke et al., 2001). In our mouse study, under chamber control conditions, there was no significant difference between light and dark-phase expression of Fos in Hcrt neurons. Two prior studies, both conducted in the light phase, reported an involvement of Hcrt neurons in positive reinforcement (Borgland et al., 2009; Sharf et al., 2010), as did our prior abstract (McGregor et al., 2007). Yet, in the first such comparison of Fos expression in light and dark phases, we find that Hcrt neurons are not activated by the identical task in the dark phase. These anatomical results in the WT animals are a striking complement to the light-phase behavioral deficits we observed in KO mice. We also find that Hcrt neurons are not activated during unearned reward.
Hypocretin and sleepiness
Hypocretin deficiency causes sleepiness (Peyron et al., 2000; Thannickal et al., 2000, 2009). However, although sleepiness is present, it is notable that the total amount of sleep is not greatly increased in hypocretin-deficient narcoleptics. Indeed, in some studies no increase is noted (Guilleminault and Anognos, 2000; Zhang et al., 2007). What is most characteristic of hypocretin deficiency is an inability to maintain waking for long periods, perhaps largely or entirely due to the inability to generate arousal for rewarding tasks.
In contrast to the sleepiness they exhibit in the waking phase, narcoleptic humans are less sleepy than normals during the normal sleep phase (Goel et al., 2010). Hcrt KO mice similarly have disrupted light-phase sleep (Scammell et al., 2009). Therefore, the failure of Hcrt KO mice to perform as well as WT mice in the light phase occurs despite the evidence that they are less sleepy than WT mice during this phase.
Relation to positively and negatively motivated motor activity
Our prior unit recording study showed that Hcrt neurons, recorded in the light phase, are most active when rats are seeking rewards by exploring. Another behavior linked to maximal activity is vigorous grooming (Mileykovskiy et al., 2005), a behavior that requires motor activity in the service of a presumably pleasurable activity. We find that Hcrt KO mice learn both the positive and negative reinforcement tasks as fast as WT mice, making it unlikely that the observed differences in performance between WT and KO mice are due to learning deficiencies.
Although differentiating between positively reinforced tasks (food or water in the present study) and negatively reinforced tasks (shock avoidance in the present study) is a traditional approach to determining the role of emotional valence, motivation is not a one-dimensional aspect of behavior. Further animal and human studies may identify other conditions associated with changes in Hcrt activity.
Hypocretin and depression
Hcrt KO animals are deficient in the performance of positively reinforced tasks in the light phase, presumably because they lack the activating effects of light-mediated Hcrt release. The inability of KO mice to sustain work for positive reinforcement despite their ability to work as well as normals to avoid negative reinforcement strikingly parallels the situation in depressed humans. In a task in which subjects were given no reward, were given money, or had money taken away, depressed patients did not work harder for obtaining money, but worked as hard as controls to avoid losing the money (Henriques and Davidson, 2000). Our findings are consistent with the higher rates of depression seen in human narcoleptics compared with that in other chronic diseases (Szklo-Coxe et al., 2007; Funato et al., 2009). Parkinson's patients, who have a substantial loss of Hcrt cells, are also at increased risk for depression (Thannickal et al., 2007, 2008). Hcrt KO mice meet the forced swim test criterion for depression (Lutter et al., 2008), a test based on the assumption that the duration of motor activity invested in seeking a submerged platform is inversely correlated with the level of depression. Lutter et al. (2008) also found that Hcrt KO mice do not show the normal motivational increase with caloric restriction, an observation that we replicate here (Fig. 5a). Humans who have attempted suicide may have reduced levels of Hcrt in their CSF (Brundin et al., 2009).
Anecdotal data suggest that human narcoleptics are relatively resistant to drug abuse. Similarly, work on Hcrt KO mice suggests a resistance to morphine and alcohol addiction (Harris et al., 2005; Boutrel and de Lecea, 2008; Moorman and Aston-Jones, 2009), findings consistent with a role of Hcrt in reinforcement.
Hcrt antagonism may be a risk factor for depression. Conversely, these data suggest that Hcrt supplementation may have antidepressant effects.
Hcrt and light
We find that light causes Hcrt neurons to be activated in WT animals working for reward in the light phase. Hcrt neurons are not activated during bar pressing for reward in the light phase if daytime illumination is withdrawn. This modulation of Hcrt activity by light has not previously been reported. Our finding is consistent with the lack of an arousing effect of light in human narcoleptics. This was discovered in a study conducted long before it was known that human narcolepsy is caused by a loss of Hcrt neurons. In contrast, light greatly increases arousal in normal individuals as well as in individuals with non-narcoleptic hypersomnia and depression-induced hypersomnia (Hajek et al., 1989). The weak circadian sleep rhythm of narcoleptics, characterized by daytime sleepiness and nighttime insomnia (Siegel, 2004), could be due to a loss of the effects of light activation of Hcrt neurons that we describe here. The rodent light period is the phase in which rodents have maximal sleep, whereas the light period is the phase in which humans have maximal waking. We hypothesize that it is the light condition rather than the sleep phase that determines the role of Hcrt in both species. This hypothesis can be tested by comparing light and dark cycle deficits in nocturnal and diurnal rodents. Further work could be done comparing night and day periods in human narcoleptics. Hcrt antagonists could be used in such studies in normal humans and WT animals.
Although the Hcrt population is not activated in WT mice run in the dark during the circadian light phase, these mice still outperform the KO mice at this task, indicating that “downstream” changes in receptors and other linked changes produced by the loss of Hcrt may impair arousal in the Hcrt KOs beyond the immediate effects of Hcrt loss. It is likely that human narcoleptics have such deficits (Mishima et al., 2008). Recent work shows that the dysfunction of Hcrt neurons causes a reorganization of other brain systems that is, at least to some extent, maladaptive. Our recent findings (Wu et al., 2011) showed that the Hcrt mutant narcoleptic dog has an abnormal response to activation of cholinergic and adrenergic receptors. Sharf et al. (2010) found that the KOs had deficits not seen when Hcrt receptors were completely blocked acutely. These findings encourage interpretation of KO defects in the more general concept of lesion effects. When one compares a WT to a KO, one is not only subtracting the function knocked out in the KO. One is looking at the adaptive and maladaptive brain reorganization that results from the KO.
Conclusion
This work suggests a revision in traditional concepts of a unified arousal system with multiple components always acting synergistically. Rather, it suggests the existence of multiple arousal systems that can act independently or in concert, depending on the nature and emotional valence of the task.
Footnotes
This work was supported by Grants NS14610, MH64109, and NS069640 from the National Institutes of Health and the Medical Research Service of the Department of Veteran Affairs. We thank Masashi Yanagisawa for providing us with the orexin KO mice, and Lisa Boehmer and Krystal Abordo for genotyping the mice. A preliminary report of some of these data was previously presented in abstract form (McGregor et al., 2007).
The authors declare no competing financial interests.
References
- Adametz JH. Rate of recovery of functioning in cats with rostral reticular lesions; an experimental study. J Neurosurg. 1959;16:85–97. doi: 10.3171/jns.1959.16.1.0085. [DOI] [PubMed] [Google Scholar]
- Basheer R, Sherin JE, Saper CB, Morgan JI, McCarley RW, Shiromani PJ. Effects of sleep on wake-induced c-fos expression. J Neurosci. 1997;17:9746–9750. doi: 10.1523/JNEUROSCI.17-24-09746.1997. [DOI] [PMC free article] [PubMed] [Google Scholar]
- Blanco-Centurion C, Gerashchenko D, Shiromani PJ. Effects of saporin-induced lesions of three arousal populations on daily levels of sleep and wake. J Neurosci. 2007;27:14041–14048. doi: 10.1523/JNEUROSCI.3217-07.2007. [DOI] [PMC free article] [PubMed] [Google Scholar]
- Borgland SL, Chang SJ, Bowers MS, Thompson JL, Vittoz N, Floresco SB, Chou J, Chen BT, Bonci A. Orexin A/hypocretin-1 selectively promotes motivation for positive reinforcers. J Neurosci. 2009;29:11215–11225. doi: 10.1523/JNEUROSCI.6096-08.2009. [DOI] [PMC free article] [PubMed] [Google Scholar]
- Boutrel B, de Lecea L. Addiction and arousal: the hypocretin connection. Physiol Behav. 2008;93:947–951. doi: 10.1016/j.physbeh.2007.11.022. [DOI] [PMC free article] [PubMed] [Google Scholar]
- Brisbare-Roch C, Dingemanse J, Koberstein R, Hoever P, Aissaoui H, Flores S, Mueller C, Nayler O, van Gerven J, de Haas SL, Hess P, Qiu C, Buchmann S, Scherz M, Weller T, Fischli W, Clozel M, Jenck F. Promotion of sleep by targeting the orexin system in rats, dogs and humans. Nat Med. 2007;13:150–155. doi: 10.1038/nm1544. [DOI] [PubMed] [Google Scholar]
- Brundin L, Björkqvist M, Träskman-Bendz L, Petersén A. Increased orexin levels in the cerebrospinal fluid the first year after a suicide attempt. J Affect Disord. 2009;113:179–182. doi: 10.1016/j.jad.2008.04.011. [DOI] [PubMed] [Google Scholar]
- Canteras NS, Ribeiro-Barbosa ER, Goto M, Cipolla-Neto J, Swanson LW. The retinohypothalamic tract: comparison of axonal projection patterns from four major targets. Brain Res Rev. 2011;65:150–183. doi: 10.1016/j.brainresrev.2010.09.006. [DOI] [PubMed] [Google Scholar]
- Celesia GG, Jasper HH. Acetylcholine released from cerebral cortex in relation to state of activation. Neurology. 1966;16:1053–1063. doi: 10.1212/wnl.16.11.1053. [DOI] [PubMed] [Google Scholar]
- Chemelli RM, Willie JT, Sinton CM, Elmquist JK, Scammell T, Lee C, Richardson JA, Williams SC, Xiong Y, Kisanuki Y, Fitch TE, Nakazato M, Hammer RE, Saper CB, Yanagisawa M. Narcolepsy in orexin knockout mice: molecular genetics of sleep regulation. Cell. 1999;98:437–451. doi: 10.1016/s0092-8674(00)81973-x. [DOI] [PubMed] [Google Scholar]
- Dahlström A, Fuxe K. Localization of monoamines in the lower brain stem. Experientia. 1964;20:398–399. doi: 10.1007/BF02147990. [DOI] [PubMed] [Google Scholar]
- Deadwyler SA, Porrino L, Siegel JM, Hampson RE. Systemic and nasal delivery of orexin-A (hypocretin-1) reduces the effects of sleep deprivation on cognitive performance in nonhuman primates. J Neurosci. 2007;27:14239–14247. doi: 10.1523/JNEUROSCI.3878-07.2007. [DOI] [PMC free article] [PubMed] [Google Scholar]
- de Lecea L, Kilduff TS, Peyron C, Gao X, Foye PE, Danielson PE, Fukuhara C, Battenberg EL, Gautvik VT, Bartlett FS, 2nd, Frankel WN, van den Pol AN, Bloom FE, Gautvik KM, Sutcliffe JG. The hypocretins: hypothalamus-specific peptides with neuroexcitatory activity. Proc Natl Acad Sci U S A. 1998;95:322–327. doi: 10.1073/pnas.95.1.322. [DOI] [PMC free article] [PubMed] [Google Scholar]
- España RA, Baldo BA, Kelley AE, Berridge CW. Wake-promoting and sleep-suppressing actions of hypocretin (orexin): basal forebrain sites of action. Neuroscience. 2001;106:699–715. doi: 10.1016/s0306-4522(01)00319-0. [DOI] [PubMed] [Google Scholar]
- España RA, Reis KM, Valentino RJ, Berridge CW. Organization of hypocretin/orexin efferents to locus coeruleus and basal forebrain arousal-related structures. J Comp Neurol. 2005;481:160–178. doi: 10.1002/cne.20369. [DOI] [PubMed] [Google Scholar]
- Estabrooke IV, McCarthy MT, Ko E, Chou TC, Chemelli RM, Yanagisawa M, Saper CB, Scammell TE. Fos expression in orexin neurons varies with behavioral state. J Neurosci. 2001;21:1656–1662. doi: 10.1523/JNEUROSCI.21-05-01656.2001. [DOI] [PMC free article] [PubMed] [Google Scholar]
- Funato H, Tsai AL, Willie JT, Kisanuki Y, Williams SC, Sakurai T, Yanagisawa M. Enhanced orexin receptor-2 signaling prevents diet-induced obesity and improves leptin sensitivity. Cell Metab. 2009;9:64–76. doi: 10.1016/j.cmet.2008.10.010. [DOI] [PMC free article] [PubMed] [Google Scholar]
- Furlong TM, Vianna DM, Liu L, Carrive P. Hypocretin/orexin contributes to the expression of some but not all forms of stress and arousal. Eur J Neurosci. 2009;30:1603–1614. doi: 10.1111/j.1460-9568.2009.06952.x. [DOI] [PubMed] [Google Scholar]
- Franklin K, Paxinos G. The mouse brain in stereotaxic coordinates. San Diego: Academic; 1997. [Google Scholar]
- Gerashchenko D, Kohls MD, Greco M, Waleh NS, Salin-Pascual R, Kilduff TS, Lappi DA, Shiromani PJ. Hypocretin-2-saporin lesions of the lateral hypothalamus produce narcoleptic-like sleep behavior in the rat. J Neurosci. 2001;21:7273–7283. doi: 10.1523/JNEUROSCI.21-18-07273.2001. [DOI] [PMC free article] [PubMed] [Google Scholar]
- Goel N, Banks S, Mignot E, Dinges DF. DQB1*0602 predicts interindividual differences in physiologic sleep, sleepiness, and fatigue. Neurology. 2010;75:1509–1519. doi: 10.1212/WNL.0b013e3181f9615d. [DOI] [PMC free article] [PubMed] [Google Scholar]
- Grasing K, Li N, He S, Parrish C, Delich J, Glowa J. A new progressive ratio schedule for support of morphine self-administration in opiate dependent rats. Psychopharmacology (Berl) 2003;168:387–396. doi: 10.1007/s00213-003-1442-x. [DOI] [PubMed] [Google Scholar]
- Guilleminault C, Anognos A. Narcolepsy. In: Kryger MH, Roth T, Dement WC, editors. Principles and practice of sleep medicine. Philadelphia: W.B. Saunders; 2000. pp. 676–686. [Google Scholar]
- Hajek M, Meier-Ewert K, Wirz-Justice A, Tobler I, Arendt J, Dick H, Fink G. Bright white light does not improve narcoleptic symptoms. Eur Arch Psychiatry Neurol Sci. 1989;238:203–207. doi: 10.1007/BF00381466. [DOI] [PubMed] [Google Scholar]
- Harris GC, Wimmer M, Aston-Jones G. A role for lateral hypothalamic orexin neurons in reward seeking. Nature. 2005;437:556–559. doi: 10.1038/nature04071. [DOI] [PubMed] [Google Scholar]
- Henriques JB, Davidson RJ. Decreased responsiveness to reward in depression. Cogn Emot. 2000;14:711–724. [Google Scholar]
- Kayaba Y, Nakamura A, Kasuya Y, Ohuchi T, Yanagisawa M, Komuro I, Fukuda Y, Kuwaki T. Attenuated defense response and low basal blood pressure in orexin knockout mice. Am J Physiol Regul Integr Comp Physiol. 2003;285:R581–R593. doi: 10.1152/ajpregu.00671.2002. [DOI] [PubMed] [Google Scholar]
- Kiss A. Immobilization induced fos expression in the medial and lateral hypothalamic areas: a limited response of hypocretin neurons. Ideggyogy Sz. 2007;60:192–195. [PubMed] [Google Scholar]
- Korotkova TM, Sergeeva OA, Eriksson KS, Haas HL, Brown RE. Excitation of ventral tegmental area dopaminergic and nondopaminergic neurons by orexins/hypocretins. J Neurosci. 2003;23:7–11. doi: 10.1523/JNEUROSCI.23-01-00007.2003. [DOI] [PMC free article] [PubMed] [Google Scholar]
- Lai YY, Siegel JM. Pontomedullary glutamate receptors mediating locomotion and muscle tone suppression. J Neurosci. 1991;11:2931–2937. doi: 10.1523/JNEUROSCI.11-09-02931.1991. [DOI] [PMC free article] [PubMed] [Google Scholar]
- Lee MG, Hassani OK, Jones BE. Discharge of identified orexin/hypocretin neurons across the sleep-waking cycle. J Neurosci. 2005;25:6716–6720. doi: 10.1523/JNEUROSCI.1887-05.2005. [DOI] [PMC free article] [PubMed] [Google Scholar]
- Lesauter J, Silver R, Cloues R, Witkovsky P. Light exposure induces short- and long-term changes in the excitability of retinorecipient neurons in suprachiasmatic nucleus. J Neurophysiol. 2011;106:576–588. doi: 10.1152/jn.00060.2011. [DOI] [PMC free article] [PubMed] [Google Scholar]
- Lin L, Faraco J, Li R, Kadotani H, Rogers W, Lin X, Qiu X, de Jong PJ, Nishino S, Mignot E. The REM sleep disorder canine narcolepsy is caused by a mutation in the hypocretin (orexin) receptor gene. Cell. 1999;98:365–376. doi: 10.1016/s0092-8674(00)81965-0. [DOI] [PubMed] [Google Scholar]
- Luppi PH, Gervasoni D, Verret L, Goutagny R, Peyron C, Salvert D, Leger L, Fort P. Paradoxical (REM) sleep genesis: the switch from an aminergic-cholinergic to a GABAergic-glutamatergic hypothesis. J Physiol Paris. 2006;100:271–283. doi: 10.1016/j.jphysparis.2007.05.006. [DOI] [PubMed] [Google Scholar]
- Lutter M, Krishnan V, Russo SJ, Jung S, McClung CA, Nestler EJ. Orexin signaling mediates the antidepressant-like effect of calorie restriction. J Neurosci. 2008;28:3071–3075. doi: 10.1523/JNEUROSCI.5584-07.2008. [DOI] [PMC free article] [PubMed] [Google Scholar]
- McGregor R, Wu M-F, Boehmer LN, Abordo K, Siegel JM. Reduced motivated behavior in hypocretin knockout mice. Soc Neurosci Abstr. 2007;33:97–7. [Google Scholar]
- Mieda M, Willie JT, Hara J, Sinton CM, Sakurai T, Yanagisawa M. Orexin peptides prevent cataplexy and improve wakefulness in an orexin neuron-ablated model of narcolepsy in mice. Proc Natl Acad Sci U S A. 2004;101:4649–4654. doi: 10.1073/pnas.0400590101. [DOI] [PMC free article] [PubMed] [Google Scholar]
- Mileykovskiy BY, Kiyashchenko LI, Siegel JM. Behavioral correlates of activity in identified hypocretin/orexin neurons. Neuron. 2005;46:787–798. doi: 10.1016/j.neuron.2005.04.035. [DOI] [PMC free article] [PubMed] [Google Scholar]
- Mishima K, Fujiki N, Yoshida Y, Sakurai T, Honda M, Mignot E, Nishino S. Hypocretin receptor expression in canine and murine narcolepsy models and in hypocretin-ligand deficient human narcolepsy. Sleep. 2008;31:1119–1126. [PMC free article] [PubMed] [Google Scholar]
- Moorman DE, Aston-Jones G. Orexin-1 receptor antagonism decreases ethanol consumption and preference selectively in high-ethanol—preferring Sprague-Dawley rats. Alcohol. 2009;43:379–386. doi: 10.1016/j.alcohol.2009.07.002. [DOI] [PMC free article] [PubMed] [Google Scholar]
- Moruzzi G, Magoun HW. Brain stem reticular formation and activation of the EEG. Electroencephalogr Clin Neurophysiol. 1949;1:455–473. [PubMed] [Google Scholar]
- Nakamura T, Uramura K, Nambu T, Yada T, Goto K, Yanagisawa M, Sakurai T. Orexin-induced hyperlocomotion and stereotypy are mediated by the dopaminergic system. Brain Res. 2000;873:181–187. doi: 10.1016/s0006-8993(00)02555-5. [DOI] [PubMed] [Google Scholar]
- Peyron C, Tighe DK, van den Pol AN, de Lecea L, Heller HC, Sutcliffe JG, Kilduff TS. Neurons containing hypocretin (orexin) project to multiple neuronal systems. J Neurosci. 1998;18:9996–10015. doi: 10.1523/JNEUROSCI.18-23-09996.1998. [DOI] [PMC free article] [PubMed] [Google Scholar]
- Peyron C, Faraco J, Rogers W, Ripley B, Overeem S, Charnay Y, Nevsimalova S, Aldrich M, Reynolds D, Albin R, Li R, Hungs M, Pedrazzoli M, Padigaru M, Kucherlapati M, Fan J, Maki R, Lammers GJ, Bouras C, Kucherlapati R, et al. A mutation in a case of early onset narcolepsy and a generalized absence of hypocretin peptides in human narcoleptic brains. Nat Med. 2000;6:991–997. doi: 10.1038/79690. [DOI] [PubMed] [Google Scholar]
- Sakurai T, Amemiya A, Ishii M, Matsuzaki I, Chemelli RM, Tanaka H, Williams SC, Richardson JA, Kozlowski GP, Wilson S, Arch JR, Buckingham RE, Haynes AC, Carr SA, Annan RS, McNulty DE, Liu WS, Terrett JA, Elshourbagy NA, Bergsma DJ, et al. Orexins and orexin receptors: a family of hypothalamic neuropeptides and G protein-coupled receptors that regulate feeding behavior. Cell. 1998;92:573–585. doi: 10.1016/s0092-8674(00)80949-6. [DOI] [PubMed] [Google Scholar]
- Sakurai T, Nagata R, Yamanaka A, Kawamura H, Tsujino N, Muraki Y, Kageyama H, Kunita S, Takahashi S, Goto K, Koyama Y, Shioda S, Yanagisawa M. Input of orexin/hypocretin neurons revealed by a genetically encoded tracer in mice. Neuron. 2005;46:297–308. doi: 10.1016/j.neuron.2005.03.010. [DOI] [PubMed] [Google Scholar]
- Scammell TE, Willie JT, Guilleminault C, Siegel JM. A consensus definition of cataplexy in mouse models of narcolepsy. Sleep. 2009;32:111–116. [PMC free article] [PubMed] [Google Scholar]
- Schwarz PB, Yee N, Mir S, Peever JH. Noradrenaline triggers muscle tone by amplifying glutamate-driven excitation of somatic motoneurones in anaesthetized rats. J Physiol. 2008;586:5787–5802. doi: 10.1113/jphysiol.2008.159392. [DOI] [PMC free article] [PubMed] [Google Scholar]
- Sharf R, Sarhan M, Brayton CE, Guarnieri DJ, Taylor JR, DiLeone RJ. Orexin signaling via the orexin 1 receptor mediates operant responding for food reinforcement. Biol Psychiatry. 2010;67:753–760. doi: 10.1016/j.biopsych.2009.12.035. [DOI] [PMC free article] [PubMed] [Google Scholar]
- Siegel JM. Hypocretin (orexin): role in normal behavior and neuropathology. Annual Rev Psychol. 2004;55:125–148. doi: 10.1146/annurev.psych.55.090902.141545. [DOI] [PMC free article] [PubMed] [Google Scholar]
- Sinton CM. Orexin/hypocretin plays a role in the response to physiological disequilibrium. Sleep Med Rev. 2011;15:197–207. doi: 10.1016/j.smrv.2010.12.003. [DOI] [PubMed] [Google Scholar]
- Szklo-Coxe M, Young T, Finn L, Mignot E. Depression: relationships to sleep paralysis and other sleep disturbances in a community sample. J Sleep Res. 2007;16:297–312. doi: 10.1111/j.1365-2869.2007.00600.x. [DOI] [PMC free article] [PubMed] [Google Scholar]
- Thannickal TC, Moore RY, Nienhuis R, Ramanathan L, Gulyani S, Aldrich M, Cornford M, Siegel JM. Reduced number of hypocretin neurons in human narcolepsy. Neuron. 2000;27:469–474. doi: 10.1016/s0896-6273(00)00058-1. [DOI] [PMC free article] [PubMed] [Google Scholar]
- Thannickal TC, Lai YY, Siegel JM. Hypocretin (orexin) cell loss in Parkinson's disease. Brain. 2007;130:1586–1595. doi: 10.1093/brain/awm097. [DOI] [PMC free article] [PubMed] [Google Scholar]
- Thannickal TC, Lai YY, Siegel JM. Hypocretin (orexin) and melanin concentrating hormone loss and the symptoms of Parkinson's disease. Brain. 2008;131:e87. doi: 10.1093/brain/awm221. [DOI] [PMC free article] [PubMed] [Google Scholar]
- Thannickal TC, Nienhuis R, Siegel JM. Localized loss of hypocretin (orexin) cells in narcolepsy without cataplexy. Sleep. 2009;32:993–998. doi: 10.1093/sleep/32.8.993. [DOI] [PMC free article] [PubMed] [Google Scholar]
- Turner SG, Sechzer JA, Liebelt RA. Sensitivity to electric shock after ventromedial hypothalamic lesions. Exp Neurol. 1967;19:236–244. doi: 10.1016/0014-4886(67)90021-0. [DOI] [PubMed] [Google Scholar]
- Winsky-Sommerer R, Yamanaka A, Diano S, Borok E, Roberts AJ, Sakurai T, Kilduff TS, Horvath TL, de Lecea L. Interaction between the corticotropin-releasing factor system and hypocretins (orexins): a novel circuit mediating stress response. J Neurosci. 2004;24:11439–11448. doi: 10.1523/JNEUROSCI.3459-04.2004. [DOI] [PMC free article] [PubMed] [Google Scholar]
- Wu MF, John J, Maidment N, Lam HA, Siegel JM. Hypocretin release in normal and narcoleptic dogs after food and sleep deprivation, eating, and movement. Am J Physiol Regul Integr Comp Physiol. 2002;283:R1079–R1086. doi: 10.1152/ajpregu.00207.2002. [DOI] [PMC free article] [PubMed] [Google Scholar]
- Wu MF, Nienhuis R, Maidment N, Lam HA, Siegel JM. Role of the hypocretin (orexin) receptor 2 (Hcrt-r2) in the regulation of hypocretin level and cataplexy. J Neurosci. 2011;31:6305–6310. doi: 10.1523/JNEUROSCI.0365-11.2011. [DOI] [PMC free article] [PubMed] [Google Scholar]
- Zhang S, Lin L, Kaur S, Thankachan S, Blanco-Centurion C, Yanagisawa M, Mignot E, Shiromani PJ. The development of hypocretin (orexin) deficiency in hypocretin/ataxin-3 transgenic rats. Neuroscience. 2007;148:34–43. doi: 10.1016/j.neuroscience.2007.05.029. [DOI] [PMC free article] [PubMed] [Google Scholar]
- Zhu L, Onaka T, Sakurai T, Yada T. Activation of orexin neurones after noxious but not conditioned fear stimuli in rats. Neuroreport. 2002;13:1351–1353. doi: 10.1097/00001756-200207190-00027. [DOI] [PubMed] [Google Scholar]