Abstract
Two approaches to motor redundancy, optimization and the principle of abundance, seem incompatible. The former predicts a single, optimal solution for each task, while the latter assumes that families of equivalent solutions are used. We explored the two approaches using a four-finger pressing task with the requirement to produce certain combination of total normal force and a linear combination of normal forces that approximated the total moment of force in static conditions. In the first set of trials, many force-moment combinations were used. Principal component (PC) analysis showed that over 90% of finger force variance was accounted for by the first two PCs. The Analytical Inverse Optimization (ANIO) approach was applied to these data resulting in quadratic cost functions with linear terms. Optimal solutions formed a hyperplane (“optimal plane”) in the four-dimensional finger force space. In the second set of trials, only four force-moment combinations were used with multiple repetitions. Finger force variance within each force-moment combination in the second set was analyzed within the uncontrolled manifold (UCM) hypothesis. Most finger force variance was confined to a hyperplane (the UCM) compatible with the required force-moment values. We conclude that there is no absolute optimal behavior, and the ANIO yields the best fit to a family of optimal solutions that differ across trials. The difference in the force producing capabilities of the fingers and in their moment arms may lead to deviations of the “optimal plane” from the sub-space orthogonal to the UCM. We suggest that the ANIO and UCM approaches may be complementary in analysis of motor variability in redundant systems.
Keywords: hand, force, moment of force, uncontrolled manifold hypothesis, inverse optimization, ANIO approach
Introduction
One of the central problems of motor control is the problem of motor redundancy (Bernstein 1967). The problem implies that the number of variables produced by elements of the system (elemental variables) at any level of analysis is higher than the number of constraints imposed by typical tasks. Therefore, an infinite number of solutions are possible. Two approaches have dominated the attempts at solving this problem.
One of the approaches implies that the central nervous system (CNS) defines and implements a solution that optimizes a certain cost function (Seif-Naraghi and Winters 1990; Tsirakos et al. 1997; Rosenbaum et al. 2001; Raikova and Prilutsky 2001; Prilutsky and Zatsiorsky 2002; Ait-Haddou et al. 2004). A variety of cost functions have been offered based on mechanical (e.g., energy, jerk, torque-change etc.), psychological (e.g., effort), mathematical (e.g., norm), and physiological (e.g., fatigue) variables as well as on complex functions representing combinations of several of the above. In most studies, optimized functions have been selected rather arbitrarily based on intuition and theoretical views of particular researchers and then tested using experimental data.
Recently, our group developed a method of identifying a cost function objectively based on experimental observations and certain assumptions (Terekhov et al. 2010; see also similar approaches developed by others, Sieminski 2006; Bottasso et al. 2006). This approach, called analytical inverse optimization (ANIO), was successfully tested using static prehension tasks that involved holding objects with different combinations of mass and external torque.
The other approach to the problem of motor redundancy is based on the principle of abundance (Gelfand and Latash 1998). It refutes the idea of the CNS finding a single optimal solution and assumes that families of solutions are facilitated that are all equally able to solve the task. In each specific trial, a single solution is selected from such a family based on factors that may not be controlled in the study and/or by pure chance. A computational method has been developed to identify and quantify such families of solutions within the framework of the uncontrolled manifold (UCM) hypothesis (Scholz and Schöner 1999; reviewed in Latash et al. 2002). The UCM hypothesis assumes that the CNS acts in a space of elemental variables and organizes within that space a sub-space (UCM) corresponding to a desired value of a potentially important performance variables. Further, the CNS tries to limit variance across repetitive attempts at the task in directions orthogonal to the UCM (“bad variance”) while it allows relatively large variance within the UCM (“good variance”). A number of studies used the UCM hypothesis framework to analyze multi-finger coordination during force and moment-of-force production tasks (reviewed in Latash et al. 2007; Zatsiorsky and Latash 2008).
The two approaches to the problem of motor redundancy look incompatible. Indeed, the former assumes that a single optimal solution is found by the CNS while the latter assumes that families of equivalent solutions are generated. Assuming that a cost function produces a single solution to a redundancy problem and that this solution is unaffected by such factors as initial conditions and history effects, if the same magnitude of an important performance variable is produced with different sets of values of elemental variables, only one of such experimentally observed sets can be the optimal set while the other sets are not optimal.
In this study we pursued several goals. First, we wanted, for the first time, to apply both methods - ANIO and UCM analysis - to the same redundant task. The task we selected —pressing with four fingers in isometric conditions to satisfy two explicit constraints, the prescribed total normal force and a linear combination of the normal forces approximating total moment of the normal forces—has never been analyzed using these two methods. Our first hypothesis has been that the ANIO will be able to identify an optimal analytical function for this task, while the UCM method will show that variability across trials for a given force/moment combination is structured in such a way that it is mostly confined to the UCM computed for the two constraints.
Second, we explored the relative orientation of two sub-spaces in the four-dimensional space of the elemental variables (individual finger forces), the UCM and the plane of optimal solutions defined by the ANIO approach. The second hypothesis is based on the expectation—stemmed from our previous findings on normal force sharing in the prehension tasks (Terekhov et al. 2010)—that the optimal solutions lie on a plane, and not on a curved surface. We hypothesized that the two planes would be orthogonal. Indeed, the optimal plane corresponds to optimal combinations of elemental variables (finger forces) that produce different values of the two task variables, — the total force and total moment — while the UCM, by definition, contains values of elemental variables that keep both task variables unchanged. In other words, the orthogonal complement to UCM would be parallel to the plane of optimal solutions if the second hypothesis is true.
Methods
Subjects
Eight right-handed male volunteers (age: 30.88 ± 3.52 years, weight: 69.40 ± 6.63 kg, height: 175 ± 5.32 cm, hand length: 18.54 ± 1.40 cm, and hand width: 8.94 ± 0.29 cm; mean ± SD across subjects are presented) participated in the current experiment. The handedness was determined by the Edinburgh Handedness Inventory (Oldfield 1971). No subject had a previous history of neuropathies or traumas to their upper extremities. The hand length was measured using the distal crease of the wrist to the middle fingertip when a subject positioned the palm side of their right hand and the lower arm on a table with all finger joints extended. The hand width was measured from the radial side of the index finger metacarpal joint to the ulnar side of the little finger metacarpal joint. Before testing, the experimental procedures of the study were explained to the subjects and the subjects signed a consent form approved by the Pennsylvania State University.
Equipment
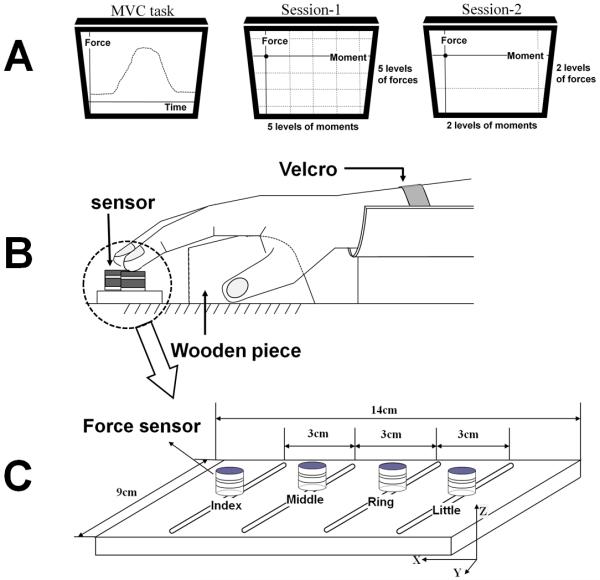
Four force sensors (Nano-17, ATI Industrial Automation, Garner, NC) were used to measure pressing forces (i.e., normal forces) being attached to a customized flat panel (140 × 90 × 5 mm) as shown in Fig. 1c. Only normal forces (along Z-axis) were measured. Each sensor was covered with a cotton pad in order to increase the friction. On the panel, there were four slots along the X-axis, which were used to attach the sensors, and the sensor positions were adjusted along the slots according to the individual hand and finger size of each subject. The distance between the slots was 3.0 cm in the medio-lateral direction. The panel was mechanically fixed to the immovable table.
Figure 1.
A: The feedback during the MVC task, session-1 (5 levels of forces × 5 levels of moments), and session-2 (2 levels of forces × 2 levels of moments). B: The experimental setup. A wooden piece was placed underneath the subject’s right palm to ensure a constant configuration of the hand and fingers. C: The finger pressing setup. The sensors, shown as white cylinders, were attached to a wooden frame. The frame was fixed to the immovable table.
A total of four analogue signals from the sensors related to the normal force components were digitized with a 12-bit analogue-digital converters (PCI-6031 and PCI-6033, National Instrument, Austin, TX) with the help of a customized LabVIEW program (LabVIEW 8.0, National Instrument, Austin, TX). Before each trial, all signals from the sensors were zeroed. Matlab (Matlab 7.4.0, Mathworks, Inc) programs were written for data processing as well as analysis. The sampling frequency was set at 200 Hz.
Experimental procedures
Before experiments, the subjects washed their hands to normalize the skin condition. The subjects sat in a chair facing the computer screen and positioned their right upper arm on a wrist-forearm brace that was fixed to the table. Each subject had an orientation session to become familiar with the experimental devices and to ensure that the subject was able to perform the experimental tasks. The forearm was held stationary with Velcro straps to prevent forearm and wrist movement, and the fingertips were placed on the centers of sensors (Fig. 1b). A wooden piece was placed underneath the subject’s right palm (Fig. 1b) in order to ensure a constant configuration of hand and fingers during finger force production.
There were one auxiliary force-production task and two main force-moment production tasks. The auxiliary force-production task included multi-finger maximal voluntary contraction (MVC) task by all four fingers (MVCIMRL) and index finger MVC task (MVCI). The subjects were asked to increase force gradually and produce maximal force by either all four fingers or the index finger only within 3 s. The maximal force during this time interval was measured and used to determine target force and moment magnitudes in the two main tasks. For the index-finger MVC (MVCI) task, the subjects were asked not to pay attention to possible force production by the other fingers as long as all the fingers stayed on the sensors.
The two main tasks required the subjects to produce various combinations of steady-state levels of total normal force (FTOT) and moment of normal force (MTOT) simultaneously as accurately as possible. Note that we use MTOT for a linear function of normal finger forces that only approximated the actual moment of force; in particular, we did not consider possible changes in the coordinates of finger force application and the contribution of shear forces. In other words, both FTOT and MTOT were not measured but computed from normal finger forces. So the subjects were given two constraints on normal force components only. Their sum had to be a number (FTOT) and their linear combination multiplied by some coefficients (nominal moment arms) had to be another number (MTOT). There was no fulcrum; so, the subjects were free to vary other force components and points of force application as they liked. The produced FTOT and MTOT in either pronation (PR) or supination (SU) were displayed on the computer screen with the cursor showing FTOT along the vertical axis and MTOT along the horizontal axis (Fig. 1a). During each trial, the subjects were given 4 s to reach the target values of FTOT and MTOT as accurately as possible and maintain these values for 2 s. Real-time FTOT and MTOT feedback was provided by a 19” monitor screen positioned 0.8 m in front of the subject.
In the first main session (session-1), the force target levels included 20, 30, 40, 50, and 60% of MVCIMRL measured earlier. The moment target levels included 2PR, 1PR, 0PR, 1SU, and 2SU. 1PR was defined as the product of 7% of MVCI by the lever arm of the index finger (di = −4.5 cm) into pronation with respect to the midpoint between the middle and ring fingers. 1PR (pronation) and 1SU (supination) were equal in magnitude, but opposite in direction. These particular target values were selected to cover a broad range of FTOT and MTOT but not to lead to fatigue. There were 25 experimental conditions (5 levels of forces × 5 levels of moments) in session-1. The subject performed three trials for each condition in a row. Thus, each subject performed a total of 75 trials (5 levels of forces × 5 levels of moments × 3 trials = 75 trials) during session-1.
For the second main session (session-2), the force levels included 20% and 40% of MVCIMRL, and the moment levels included 2PR and 2SU. Each subject performed 25 trials for each of the four conditions, therefore, a total of 100 trials (2 levels of forces × 2 levels of moments × 25 trials = 100 trials) were collected during session-2 for each subject. The purpose of collecting multiple trials in session-2 was to be able to apply the uncontrolled manifold analysis of the finger force variance.
If the deviation of final FTOT and MTOT from the prescribed values exceeded the pre-defined criteria (, ), the data collection stopped and the subject performed the trial again. This happened in 16 out of a total of 1400 trials. After each trial, a 30-s break was given to avoid finger fatigue. The order of FTOT, MTOT combinations was randomized.
Data Analysis
Initial data processing
The data processing was limited to analysis of the normal forces and moments of normal forces. The data were digitally low-pass filtered with a 4th order Butterworth filter at 5 Hz. Further, the data from the main tasks were averaged over 1.5 s in the middle of the time period where steady-state values of force and moment were observed. These averaged values were used for further analysis.
Task constraints
The main tasks required the subjects to satisfy two constraints.
1) The sum of the normal forces of all four fingers had to be equal to the prescribed values decided by the percent force of the subject’s MVCIMRL:
| (1) |
where the subscripts i, m, r, and l stand for the index, middle, ring and little finger respectively, and α indicates a given percentage (for session-1, α = 20%, 30%, 40%, 50%, and 60%; for session-2, α = 20% and 40%).
2) The resultant moment of normal forces had to be equal to the prescribed values computed as the product of 7% of MVCI of the subject by the lever arm of the index finger (di = 4.5cm):
| (2) |
where d and F stand for the lever arms and the normal force for corresponding finger, respectively. Note that we assumed no changes in the points of force application on the surface of sensor in the medio-lateral direction. Thus, the lever arms (di, dm, dr, and dl) were constant with respect to the mid-way between the middle and ring fingers: di = −4.5 cm, dm = −1.5 cm, dr = 1.5 cm, and dl = 4.5 cm in the medio-lateral direction. b = {−1, −2, 0, 1, and 2} for session-1, and b = {−2 and 2} for session-2. Again, 1PR was defined as the product of 7% of MVCI by the lever arm of the index finger (di = − 4.5 cm) into pronation with respect to the midpoint between the middle and ring fingers.
The ANIO approach
The ANIO requires knowledge of the surface on which the experimental results are mainly located (explained in Terekhov et al. 2010). Because the cited study of prehension tasks suggested that the surface was a plane, principal component analysis (PCA) was performed on the finger force data. The purpose of the PCA analysis was to check whether finger force data for session-1 were indeed confined to a plane. PCA was performed on 75 observations (5 levels of forces × 5 levels of moments × 3 trials = 75 trials) for each subject, which covered all force and moment combinations in session-1.
The Kaiser Criterion (Kaiser, 1960) was employed to extract the significant principal components (PCs), and the percent variance explained by the first two PCs was computed in order to test if experimental observations were confined to a two-dimensional hyper-plane in the four-dimensional force space.
The analytical inverse optimization (ANIO) is a mathematical tool, which has been previously applied to the finger force data in prehension tasks (Terekhov et al. 2010). The purpose of the ANIO is to determine an unknown objective function based on a set of observed finger forces. The ANIO approach was applied to the data obtained in session-1 which covered a broad range of task FTOT and MTOT.
Note that we assume non-sticking contact between the finger tips and force sensors throughout the experiment. Therefore, forces could only be positive. The optimization problem in the current study was defined as
| (3) |
The two linear constraints are expressed as
| (4) |
The task involved two constraints (FTOT and MTOT values) and four elemental variables (finger forces). Thus, the solutions of this undetermined system were expected to be confined to a two-dimensional hyperplane in the four-dimensional force space. The following computational procedure explains how the optimization cost-function was obtained.
First, we identified whether the optimization problem was splittable or not by observing the (4×4) matrix:
| (5) |
(for more details, see Appendix 1)
Second, we checked whether the experimental data actually lied on a hyperplane (and not for instance on a curved hypersurface) and then defined the observed hyperplane mathematically as
| (6) |
where A is a 2×4 matrix composed of the transposed vectors of the two lesser principal components obtained from the PCA from the finger force data in session-1. A large percentage of the total variance (>90%) explained by the two first principal components was considered an indicator that the data indeed were mostly confined to a hyperplane. However, the data points showed deviations from the hyperplane due to the variability of performance and instrumental noise. Also, the plane computed from Eq. 6 was affected by experimental errors.
Third, we compared the experimentally determined hyperplane to the theoretical plane derived from the Uniqueness Theorem (for more details, see Appendix 1). The experimental data must be fitted by the following equation:
| (7) |
where, , fi are arbitrary continuously differentiable functions. Since the data were shown to lie on a plane, the functions are linear:
| (8) |
where i = {index, middle, ring, and title}.
Therefore,
| (9) |
The values of the coefficients of the second-order terms ki can be determined by minimizing the dihedral angle between the two planes: the plane of optimal solutions and the plane of experimental observations ( A·FT = 0). The values of the coefficients of the first-order terms wi were found to correspond to a minimal vector length () bringing the theoretical and the experimental plane as close to each other as possible. Vector w satisfies the following equation:
| (10) |
where and .
Then, the functions gi in Eq. 3 are:
| (11) |
where r is a nonzero number, consti can be any real number, and qi is any real number satisfying the equation (Terekhov et al., 2010). note that multiplication of the cost function by a constant value or adding a constant value to it does change the cost function essentially. Hence we can arbitrary assume r = 1 and consti = 0. According to the Uniqueness Theorem, identification of the cost function can be performed only up to unknown linear terms, which are parameterized by the values qi. We assume qi = 0 in order to simplify gi(xi). It must be kept in mind, however, that the true cost function used by the CNS might have these terms.
Therefore, the desired objective function is:
| (12) |
where i = {index, middle, ring, and little}; kindex was set at 1 in order to normalize the coefficients.
If the coefficients of the second-order terms are positive, the function complies with the assumption of the objective function minimization. In the results, the coefficients of second-order and first-order terms for each subject will be presented with the dihedral angle between the plane of optimal solutions and the plane determined by the experimental observations.
Analysis of finger force co-variation (the UCM method)
Prior to the analysis of finger force co-variation, principal component analysis (PCA) was also performed on the finger force data in session-2. Because there were two task constraints (FTOT and MTOT) with four force variables, the finger force data across multiple trials with the same values of the two constraints were expected to lie on a two-dimensional plane. Hence, four separate PCAs were applied to 25 observations within each of {FTOT, MTOT} combinations.
Afterwards, the force data were analyzed within the framework of the uncontrolled manifold (UCM) hypothesis (Scholz, Schöner 1999; reviewed in Latash et al. 2002, 2007). The hypothesis offers a method to compute the extent to which the values of relevant performance variables (FTOT and MTOT) are stabilized by the co-variation of individual finger forces. Two components of finger force variance, VUCM and VORT, across the 25 trials for each condition were computed. The first component (VUCM) does not affect the averaged across trials values of FTOT and/or MTOT. The other component (VORT) affects those values. The two variances were computed with respect to FTOT, MTOT, and both {FTOT, MTOT} simultaneously. This was done to explore whether the central nervous system produces co-variation of finger forces to stabilize only FTOT, only MTOT, or both. Note that results compatible with stabilization of {FTOT, MTOT} may be due to stabilization of only one of those variables or of both variables. The computational details are shown in Appendix 2. Further, an index reflecting the relative amounts of VUCM and VORT was computed as:
| (13) |
where VTOT stands for the total finger force variance, and each variance index is computed per degree-of-freedom in the corresponding spaces (Krishnamoorthy et al. 2003; Robert et al. 2008). Prior to statistical analysis (see later), this index was transformed using a Fisher z-transformation (ΔVz) adapted to the boundaries of ΔV.
The ANIO approach requires a data set that covers a broad range of FTOT and MTOT values. The UCM analysis examines the variance in the finger force space for a fixed set of FTOT and MTOT. So, session-1 involved trials at different {FTOT; MTOT} values and session-2 involved repetitive trials at a few combinations of {FTOT; MTOT}. The application of the ANIO approach to the force data from session-1 resulted in the reconstruction of a hyperplane, which we will refer to as “the optimal plane”. The application of the UCM analysis to the data from session-2 resulted in the reconstruction of another hyperplane, the UCM. The angle between the UCM and optimal hyperplanes was calculated in the four-dimensional force space.
Statistics
To analyze the data in session-2, we explored how VUCM and VORT were affected by different {FTOT, MTOT} combination with three separate ANOVAs with repeated measures with the factors FORCE (two levels: 20% and 40% of MVCIMRL), MOMENT (two levels: 2SU and 2PR), and VARIANCE (two levels: VUCM and VORT) for each of three analyses: FTOT-related, MTOT-related, and {FTOT, MTOT}-related. We also performed an ANOVA with repeated measures on the z-transformed ΔV index with factors FORCE (two levels: 20% and 40% of MVCIMRL), MOMENT (two levels: 2SU and 2PR), and ANALYSIS (three levels: FTOT-related, MTOT-related, and {FTOT, MTOT}-related). The p-value of statistical significance was set at p < 0.01. Tukey’s honestly significant difference tests and pairwise contrasts were used to explore significant effects.
To test the hypothesis that the UCM and the plane of optimal solutions are orthogonal, the angle between these two planes was compared to 90° using a single sample t-test.
Results
The average maximal voluntary contraction forces by all four fingers and by the index finger, MVCIMRL and MVCI, across subjects were 71.13 ±14.00 N (mean ± standard deviation) and 41.00 ± 6.76 N, respectively. In the main tasks, the subjects reached the prescribed combinations of {FTOT, MTOT} with high accuracy. Figure 2 shows average FTOT and MTOT across subjects (large black dots) with standard deviation bars and forces and moments for individual subjects (small gray dots) during session-1.
Figure 2.
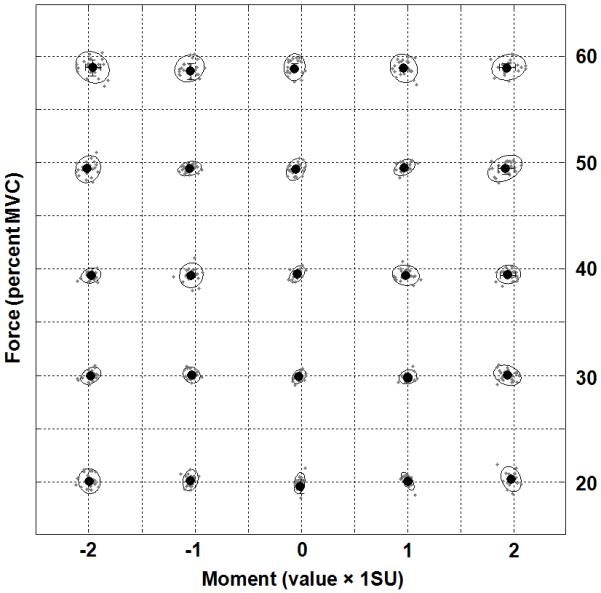
Normalized FTOT and MTOT data during session-1. Force values were normalized by MVCIMRL, and moment values were normalized by 1SU (see Methods). The large black dots indicate average values across subjects with standard deviations bars, while the small gray dots nested in the ellipses represent normalized force and moment values for individual subjects. The ellipses were fit to contain more than 90% of experimental observations for each condition.
Principal component (PC) analysis
The principal component analysis (PCA) was performed on the sets of 75 observations (5 force conditions × 5 moment conditions × 3 trials) in session-1, and on the four sets of 20 observations each in session-2 for each subject.
In general, the first two PCs accounted for more than 90% of the total variance in the finger force space (Table 1). On average, PC1 accounted for 67.33 ± 8.17% of variance, while PC2 accounted for 27.29 ± 7.91% of variance. In addition, the number of significant PCs (i.e., the Kaiser criterion, PCs with the eigenvalues over 1) was two for the analyses for both session-1 and session-2. These imply that that the experimental observations were confined to a two-dimensional hyperplane in the four-dimensional force space for each of the two sessions.
Table 1.
Percent of variance explained by PCs
| PC1 | PC2 | PC1 + PC2 | ||||||
|---|---|---|---|---|---|---|---|---|
| mean | Range [min, max] |
mean | Range [min, max] |
mean | Range [min, max] |
|||
| Session1 | 65.43 | [61.56, 71.72] | 25.15 | [18.63, 33.12] | 90.59 | [84.07, 94.68] | ||
|
| ||||||||
| Session2 |
20% MVC |
2PR | 68.04 | [54.19, 79.99] | 25.77 | [13.54, 36.99] | 93.80 | [91.18, 98.14] |
| 2SU | 66.48 | [57.35, 82.43] | 26.04 | [13.74, 33.43] | 92.52 | [91.18, 98.14] | ||
|
| ||||||||
|
40% MVC |
2PR | 69.20 | [58.53, 82.43] | 28.73 | [20.17, 39.77] | 97.93 | [95.81, 99.47] | |
| 2SU | 67.52 | [54.57, 89.77] | 30.76 | [8.81, 44.11] | 98.28 | [96.03, 99.37] | ||
The average and minimal-maximal percent variances (in parentheses) explained by PC1, PC2, and PC1+PC2 across subjects are shown.
For PCA performed on the data within session-1, all four finger forces had large loadings with the same sign (i.e., positive loadings) in PC1 (Fig. 3). In PC2, the loadings of the index and little finger forces were larger than those of the middle and ring finger forces (Fig. 3). The loadings of the index and middle fingers were of the same sign, while the sign of the loadings for the ring and little finger forces was opposite. These results may be interpreted as PC1 producing primarily FTOT changes and PC2 producing primarily MTOT changes.
Figure 3.
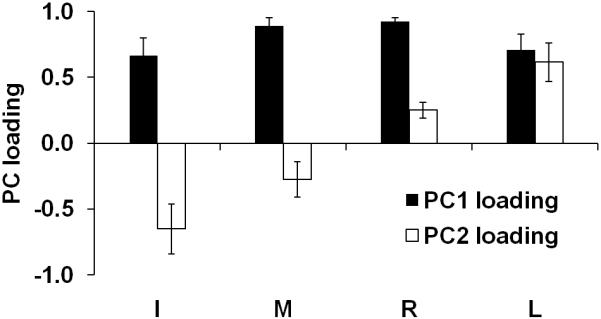
The loading factors of PC1 and PC2 from session-1. The average PC loadings of individual finger forces are presented with standard error bars. I, M, R, and L indicate index, middle, ring, and little finger, respectively.
For session-2, the loadings of the index and little finger forces in PC1 were larger for all four conditions as compared to the loadings of the middle and ring finger forces (Fig. 4a). The middle finger force had a large loading with the sign opposite to the signs of index and little finger during pronation effort, while the ring finger force had a large loading with the opposite sign to the loadings of index and little finger during supination (Fig. 4a). In PC2, the loadings of the index and ring finger forces had an opposite sign to the loadings of the middle and little finger forces (Fig. 4b).
Figure 4.
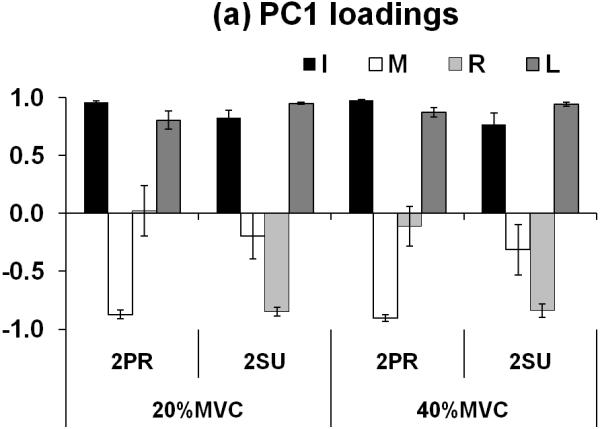
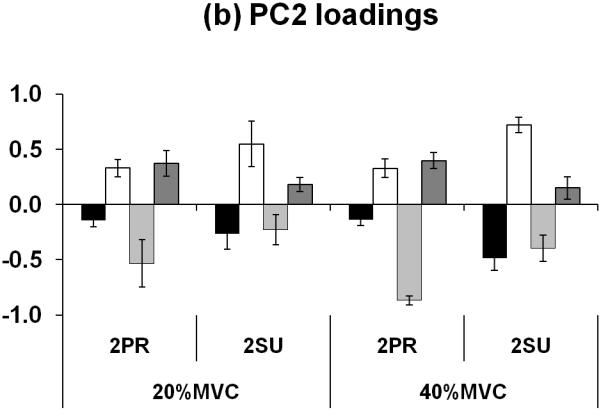
(a) Loading factors of PC1 and (b) of PC2 of individual finger forces for the four FTOT and MTOT combinations in session-2. The average PC loadings of individual fingers are presented with standard error bars. I, M, R, and L stand for index, middle, ring, and little finger, respectively
The ANIO approach
The PCA results show that the experimental data in session-1were mainly confined to a two-dimensional plane spanned by PC1 and PC2. This indicates that the optimization cost function is quadratic (this conclusion follows from ‘the Lagrange principle for the inverse optimization problem’ proved in Terekhov et al. 2010). Hence, the ANIO approach was reduced to the determination of the coefficients at the quadratic (ki) and the linear terms (wi). These coefficients were defined to fit the data best; they are presented in Table 2.
Table 2.
The estimation of parameters ki and wi from the ANIO approach
| kindex | kmiddle | kring | klittle | windex | wmiddle | wring | wlittle | Dihedral angle (°) |
|
|---|---|---|---|---|---|---|---|---|---|
| Sbj1 | 1.00 | 0.57 | 0.88 | 1.50 | −1.07 | 1.27 | 0.67 | −0.87 | 0.87 |
| Sbj2 | 1.00 | 0.29 | 0.20 | 0.34 | −1.19 | 1.49 | 0.59 | −0.89 | 1.60 |
| Sbj3 | 1.00 | 0.71 | 0.95 | 1.60 | −1.53 | 1.59 | 1.39 | −1.46 | 0.98 |
| Sbj4 | 1.00 | 0.67 | 0.35 | 0.66 | −0.92 | 0.89 | 0.97 | −0.94 | 1.71 |
| Sbj5 | 1.00 | 0.40 | 0.21 | 0.48 | −1.07 | 1.05 | 1.12 | −1.10 | 5.24 |
| Sbj6 | 1.00 | 0.53 | 0.93 | 1.83 | −1.54 | 1.85 | 0.91 | −1.23 | 1.36 |
| Sbj7 | 1.00 | 2.26 | 3.29 | 6.78 | −1.85 | 2.34 | 0.88 | −1.37 | 0.62 |
| Sbj8 | 1.00 | 1.10 | 1.02 | 1.08 | −0.10 | 0.02 | 0.27 | −0.18 | 4.00 |
ki and wi are the second- and first-order coefficients, respectively.
The cost-function for each subject in the current task could be represented as: where F stands for finger force, i = {index, middle, ring, and little} (see Eq. 12 in Methods). The coefficients at the second-order terms were positive for all subjects (Table 2), which supports the assumption of the objective function minimization (see Appendix 1). The averages of the second-order term coefficients across subjects were 0.82 ± 0.22, 0.98 ± 0.35, and 1.79 ± 0.74 (mean ± standard error) for the middle, ring, and little finger force, respectively. The average dihedral angle across subjects was 2.05° ± 0.59° (mean ± standard error). The dihedral angles of subjects 5 and 8 were relatively large (≥ 4.00° but less than 5.5°).
The UCM analysis
Two components of finger force variance, VUCM and VORT, were quantified per degree-of-freedom with respect to FTOT, MTOT and their combination, {FTOT, MTOT}, using observations in session-2 (see Methods for more details). Overall, VUCM was always greater than VORT (Fig. 5). This means that most finger force variance was compatible with the selected performance variable for all analyses. VUCM increased with the magnitudes of prescribed force levels (20% and 40% of MVCIMRL), while it was not significantly different between task moment conditions (2SU and 2PR). These results were supported by an ANOVA on VUCM which showed significant main effects of FORCE (two levels: 20% MVC and 40% MVC) [F[1,7] = 22.60, p < 0.001 for the FTOT analysis; F[1,7] = 30.06, p < 0.001 for the MTOT analysis; F[1,7] = 29.81, p < 0.001 for the {FTOT, MTOT} analysis], VARIANCE (two levels: VUCM and VORT) [F[1,7] = 60.93, p < 0.0001; F[1,7] = 58.90, p < 0.0001; F[1,7] = 63.36, p < 0.0001 for the three analyses respectively], and a significant interaction [F[1,7] = 37.47, p < 0.0001; F[1,7] = 29.20, p < 0.001; F[1,7] = 35.44, p < 0.001 for the three analyses, respectively]. A significant interaction between FORCE and VARIANCE reflects the fact that VORT did not increase with the magnitudes of prescribed force levels (20% and 40% of MVCIMRL) while VUCM did. The pair-wise comparisons confirmed that VORT at 20%MVC condition was not significantly different from VORT at 40%MVC condition for the FTOT and {FTOT, MTOT} analyses. In MTOT analysis, however, VORT at 20%MVC with 2PR condition was significantly smaller than VORT at 40%MVC with both 2PR (p < 0.01) and 2SU (p < 0.01) conditions. VORT at 20%MVC with 2SU was not statistically different from VORT at 40%MVC with 2PR, but smaller than VORT at 40%MVC with 2SU (p < 0.01) in MTOT analysis.
Figure 5.
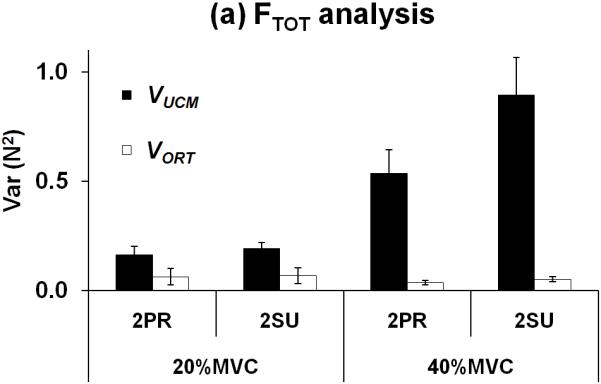
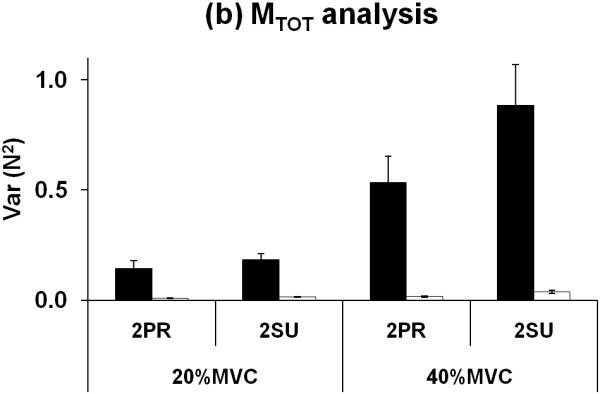
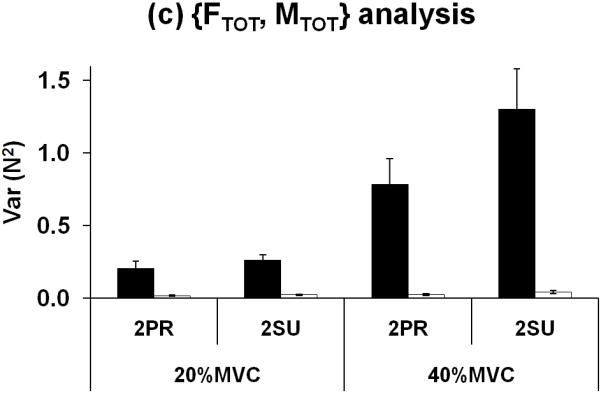
Two components of variance, VUCM and VORT, in the finger force space computed with respect to (a) FTOT, (b) MTOT, and (c) {FTOT, MTOT} as performance variables. Variances were normalized by degree-of-freedom of corresponding spaces. The average values (N2) across subjects are presented with standard error bars.
The index ΔV was computed as the normalized difference between VUCM and VORT (Fig 6). In general, ΔV increased with FTOT. In addition, ΔVM > ΔVF > ΔVFM for all experimental conditions. A three-way repeated measures ANOVA with the factors FORCE (two levels: 20% MVC and 40% MVC), MOMENT (two levels: 2PR and 2SU), and ANALYSIS (three levels: FTOT-related, MTOT-related, and FTOT+MTOT-related) was performed on z-transformed ΔV values. The main effects of FORCE and ANALYSIS were significant without a significant interaction [FORCE: F[1,7] = 36.02, p < 0.0001; ANALYSIS: F[2,14] = 27.86, p < 0.001]. The pair-wise comparisons within each combination of FORCE and MOMENT confirmed that ΔVM > ΔVF > ΔVFM. The effect of FORCE reflected higher ΔV values for the 40%MVC conditions.
Figure 6.
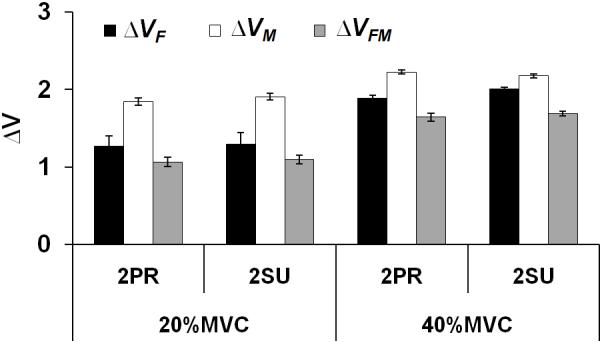
Z-transformed ΔV (dimensionless) for the FTOT-related (ΔVF), MTOT-related (ΔVM), and {FTOT, MTOT}-related (ΔVFM) analyses. Average ΔVZ across subjects are presented with standard error bars.
The angle between the UCM and optimal subspaces
The angle between two subspaces, UCM and optimal space (defined with the ANIO approach), was computed. The average angle between the two planes across subjects was 79.81 ± 4.6 degrees (mean ± standard deviation). Note that the UCMs computed for different {FTOT, MTOT} combinations were parallel to each other. In other words, the angle between the optimal space and the subspace orthogonal to UCM was about 10 degrees. The one-sample t-test with 90° as a test-value confirmed that the angle between the two planes was significantly different from 90 degrees (p < 0.01).
Discussion
The results of the study allow answering the main questions formulated in the Introduction. In support of our first hypothesis, the results show that the ANIO approach is able to identify an optimal analytical function for the redundant task of multi-finger production of a combination of total force and total moment of force. At the same time, the UCM method has shown that variance across trials in the finger force space when the subjects performed the same task several times was mostly confined to the UCM. The second hypothesis was falsified. The angle between the plane defined by the ANIO approach and the UCM method was significantly different from the predicted 90° (approximately 10° of difference). In the rest of the Discussion, we address issues of interactions between optimality and variability in human motor actions.
Variability of optimal behavior
The idea of defining a single optimal solution for a redundant task seems to leave little space for motor variability. This is true, however, only if several consecutive attempts at a task are performed in perfectly reproducible conditions, which is impossible to achieve. The ANIO is based on an assumption that one and the same analytical function is applicable as the cost function to a set of observations (Terekhov et al. 2010). According to this assumption, if the values of the two constraints (FTOT and MTOT) are perfectly reproduced for two trials, the observed combinations of finger forces should be exactly the same, for example defined by the principle of minimization of the secondary moments (Li et al. 1998; Zatsiorsky et al. 2000). This is certainly not true, and experimental data in session-2 show substantial variance in the finger force space that is organized to keep the important performance variables, such as FTOT and MTOT, relatively invariant (cf. Scholz and Schöner 1999; Scholz et al. 2000; Latash et al. 2001).
One interpretation of the across-trials variability may be that neuromotor noise (e.g., Harris and Wolpert 1998) due to unavoidable variability of intrisnic and extrinsic variables produces deviations from a single optimal solution. However, such noise is not expected to show task-specific covariation among its contributions to the outputs of elements. In particular, it is expected to lead to equal contributions to variance within the UCM and orthogonal to it. This is not what we found. The across-trials variance for the same constraints (same FTOT and MTOT values) was mostly within the UCM; so, we feel hesitant to attribute these observations to neuromotor noise.
It is also possible that the cost function defined by the ANIO method is not the “true” cost function, which may be related to optimization of some of the numerous physiological variables within the body. Our analysis at the level of mechanical variables naturally looks for a cost function expressed in the same variables. Across a broad range of {FTOT; MTOT} combinations, the method may fit the data well, that is the differences between the dicovered and “true” cost functions may be small. However, when the range of {FTOT; MTOT} is reduced, as in the repetitive trials in session-2, the differences between the computed cost function and the “true” cost function may be large enough to cause the seeming problem with the observation of data distributions elongated along the UCM.
Based on the observations of substantial variability across trials with the same values of the two constraints, it is possible to conclude that optimality of the observed finger force patterns is not absolute. It may depend on a particular state of the system when the task is performed, for example on excitability of relevant neuronal pools, as well on the tiny variations in the performance conditions. Hence, each trial is performed by the neuromotor system starting from a unique state, and optimal solutions may vary across such states. The ANIO allows determining the best fit to the family of such state-dependent optimal solutions, but it cannot predict perfectly the finger force combinations for any given set of values of the two task variables.
Optimality of variable behavior
Motor variability has been a rich source of information on the principles of control of natural movements (reviewed in Newell and Corcos 1993; Latash et al. 2002). Most researchers would agree that motor variability is not a result of a “neuromotor noise” (Schmidt et al. 1979; Newell and Carlton 1988). In particular, the patterns of variance quantified with the help of the UCM hypothesis show that, across a variety of tasks, substantial amounts of variability are present in the space of elemental variables that has no effect on important performance variables (“good variance”), while variability that affects such variables (“bad variance”) is kept low (Scholz and Schöner 1999 reviewed in Latash et al. 2007; Latash 2008, 2010). Several studies have documented an increase in “good variance” in conditions of uncertainty and possible perturbations (Yang et al. 2006; Freitas and Scholz 2009).
Figure 7a illustrates typical data point distributions across several attempts to produce the same total force level with two fingers (cf. Latash et al. 2001). These distributions are typically elongated along the UCM for the target force, i.e. the line corresponding to the equation F1+F2=FTOT (Latash et al. 2001; Scholz et al. 2002). The same figure shows curves for certain values of a hypothetical cost functions corresponding to each FTOT level. We use this illustration of a two-finger system and one constraint to illustrate the idea because drawing two-dimensional hyperplanes on a four-dimensional space is beyond our abilities.
Figure 7.
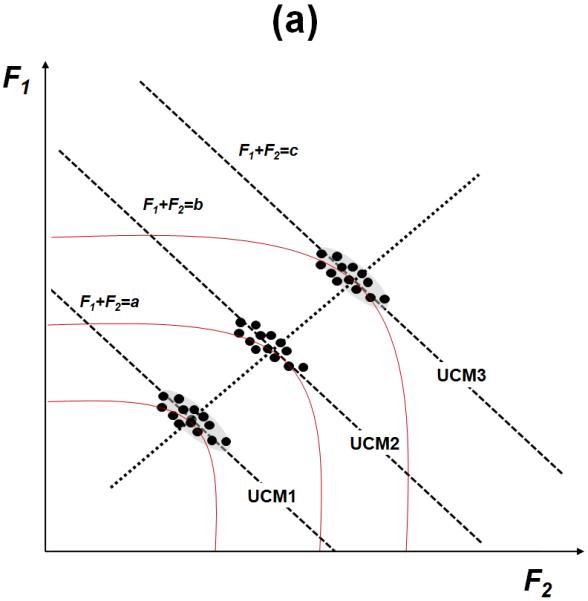
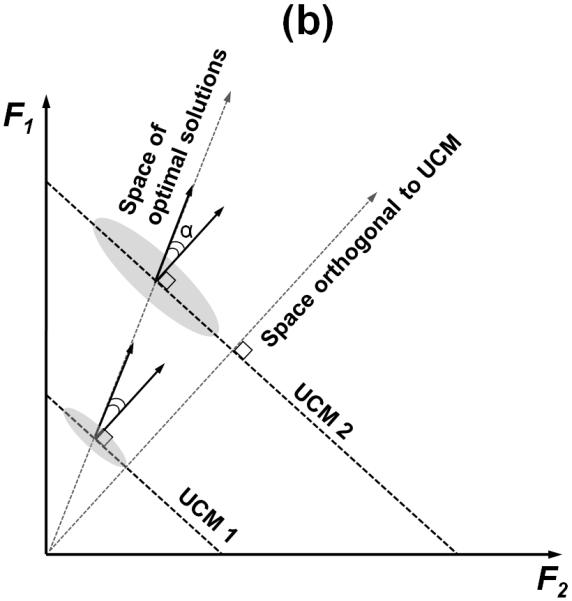
(a) Typical data distributions over repetitions of the task are shown for three values of the total force. The curves that touch each UCM in only one point, correspond to certain values of a hypothetical cost function. The dotted line indicates the optimal solution space. (b) An illustration of two uncontrolled manifolds (UCM1 and UCM2) for two values of the total force produced by two fingers. The two arrows indicate the space orthogonal to the UCM and the (hypothetical) space of optimal solutions. The gray ellipses show hypothetical data point distributions.
Note that each curve touches each UCM in only one point, at the optimal solution. However, data points show a scatter, primarily along the UCM, which suggests that solutions other than the optimal one were used. Note that the data in this mental experiment do not cover the entire length of the F1+F2=FTOT line. For instance, the values F1=0; F2=FTOT are never used. This is valid for real observations (Latash et al. 2001; Gorniak et al. 2009). Hence, there is a factor that limits the variability range. It seems reasonable to assume that this factor reflects an unknown optimization process.
We suggest that two potentially independent features of data distributions are defined by the two principles, optimality and structured variance. The centers of the observed data distributions correspond to average sharing patterns of the total force (and maybe other variables) between the fingers reflecting an optimality criterion. The shape of the distributions indicates desired stability properties of the system in producing the required value of FTOT reflecting the relative amounts of “good” and “bad” variance.
Sub-spaces of optimal solutions, UCM, and range motion
The UCM hypothesis allows considering the space of elemental variables as two sub-spaces, the UCM and its orthogonal complement. A change in the system’s coordinates within the UCM does not produce changes in the performance variable for which the UCM was computed. In contrast, a shift of the system orthogonally to the UCM produces the fastest change of that performance variable. This motion may correspond to one defined by the Moore-Penrose pseudo-inverse method (Whitney 1969; Mussa-Ivaldi et al. 1988). For example, for the two-finger force production, the Moore-Penrose method predicts equal contributions of the fingers to changes in the total force. In actual experiments, fingers rarely share force 50:50 because of the differences in their force generating capabilities (Zatsiorsky et al. 1998). So, trajectories in the space of finger forces during changes in FTOT have components both within the UCM (self-motion) and orthogonally to the UCM (range motion). These terms come from robotics where they imply, for a multi-joint movement, a component that keeps the endpoint of the limb motionless and the one that moves the endpoint (Murray et al. 1994).
The sub-space defined by the ANIO approach may be viewed as a space of such preferred trajectories, which reflect differences among the elements, for example, the differences across the fingers in their force generating capabilities and the differences in the moment arms. In our experiments, the plane defined by the ANIO approach and the plane orthogonal to the UCM were not parallel: The angle between the “optimal plane” and the UCM was close to 80° (Fig. 7b). We interpret the deviation of this angle from the predicted 90° by the fact that the fingers were not equal contributors to the task. For example, the little finger is known to be weaker than other fingers (Li et al. 1998), and the level arms of the little and index fingers were longer than those for the middle and ring fingers.
Potential Mechanisms
There have been several atempts to link observed patterns of data distribution in redundant systems to possible neural mechanisms. These included feedback-based models (Todorov and Jordan 2002; Latash et al. 2005), a feed-forward model (Goodman and Latash 2006), and a dynamic model incorporating the ideas of the equilibrium-point hypothesis (Martin et al. 2009). Recently, direct links between the equilibrium-point (referent configuration) hypothesis (Feldman 1986; Feldman and Levin 1995) and the idea of synergies stabilizing features of performance have been suggested (Latash et al. 2010). Within the latter approach, a hierarchical control system is implied that involves several steps of transformation from a referent configuration at the level of most salient performance variables (such as FTOT and MTOT in our study) to referent configurations at the level of elemental variables and actual values of those variables.
One of the mentioned models (Latash et al. 2005) is based on a system of back-coupling feedback loops resembling the well known system of Renshaw cells. Two types of control variables are assumed in that model. One of them (CV1) defines a desired trajectory of important variables (such as {FTOT, MTOT} in our study) and their average sharing among the elemental variables (finger forces in our study), while the other one (CV2) defines patterns of covariation of elemental variables that stabilize the {FTOT, MTOT} trajectory. Within this simplified scheme, optimization is relevant to defining patterns of CV1 while the relative amounts of VUCM and VORT variance components are defined by CV2. Within this scheme, the ideas of optimization and variability are complementary, not competing, and the seeming incompatibility of the two is resolved.
Acknowledgments
The study was in part supported by NIH grants AG-018751, NS-035032, and AR-048563. We are grateful to Dr. Alexander Terekhov for his help at the early phases of this project.
Appendix 1
Uniqueness Theorem (for the mathematical proof see Terekhov et al. 2010)
The core of the ANIO approach is the theorem of uniqueness that specifies conditions for unique (with some restrictions) estimation of the objective functions. The main idea of the theorem of uniqueness is to find necessary conditions for the uniqueness of solutions in an inverse optimization problem. An optimization problem (i.e., direct optimization problem) with an additive objective function and linear constraints are defined as:
| (A1) |
where , gi is an unknown scalar differentiable function with g’(·)>0. gi came from the Lagrange minimum principle, which has a unique solution. On the contrary, the functions of gi can be computed from the set of solutions X* (e.g., experimental data). This inverse procedure is called the inverse optimization problem. C is a k×n matrix and B is a k-dimension vector, k<n.
First, assume that the optimization problem (A1) with k≥2 is non-splittable. If the inverse optimization is splittable, the preliminary step is to split it until a non-splittable subproblem is acquired. If the functions gi(xi) in problem (A1) are twice continuously differentiable (i.e., twice continuously differentiable functions fi) and is not identically constant, complying for all ,
| (A2) |
| (A3) |
| (A4) |
for every , where and X* is the set of the solutions for all . The constants qi satisfy the equation where . Primes designate derivatives.
If the experimental data correspond to solutions of an inverse optimization problem with additive objective function (gi) and linear constraints, equation must be satisfied (i.e., the Lagrange principle). The Uniqueness Theorem provides sufficient condition (i.e., ) for solving the inverse optimization problem in a unique way up to linear terms.
Appendix 2
Uncontrolled manifold (UCM) analysis (see Latash et al. 2002, 2007 for details)
For FTOT, changes in the elemental variables (finger forces) sum up to produce a change in FTOT:
| (B1) |
The UCM was defined as an orthogonal set of the vectors ei in the space of the elemental forces that did not change the net normal force, i.e.:
| (B2) |
These directions were found by taking the null-space of the Jacobian of this transformation (). The mean-free forces were then projected onto these directions and summed to produce:
| (B3) |
where n=4 is the number of degrees-of-freedom of the elemental variables, and p=1 is the number of degrees-of-freedom of the performance variable (FTOT). The component of the de-meaned forces orthogonal to the null-space is given by:
| (B4) |
The amount of variance per degree of freedom parallel to the UCM is:
| (B5) |
The amount of variance per degree of freedom orthogonal to the UCM is:
| (B6) |
The normalized difference between these variances is quantified by a variable ΔV:
| (B7) |
where VTOT is the total variance, also quantified per degree of freedom. If ΔV is positive, VUCM > VORT, caused by negative co-variation of the finger forces, which we interpret as evidence for a force-stabilizing synergy. In contrast, ΔV=0 indicates independent variation of the finger forces, while ΔV < 0 indicates positive co-variation of the individual finger forces, which contributes to variance of FTOT.
A similar procedure was used to compute the two variance components related to stabilization of MTOT. The only difference was in using a different Jacobian corresponding to the lever arms of individual finger forces, .
We also analyzed the data with respect to stabilization of both FTOT and MTOT simultaneously. In that case, the Jacobian was . The dimensionality of VUCM for the analysis with respect to FTOT and MTOT separately is three (one constraint), while the dimensionality of VUCM with respect to FTOT and MTOT simultaneously is two (two constraints).
References
- Ait-Haddou R, Jinha A, Herzog W, Binding P. Analysis of the force-sharing problem using an optimization model. Math Biosci. 2004;191:111–122. doi: 10.1016/j.mbs.2004.05.003. [DOI] [PubMed] [Google Scholar]
- Bernstein NA. The co-ordination and regulation of movements. Pergamon Press; Oxford: 1967. [Google Scholar]
- Bottasso CL, Prilutsky BI, Croce A, Imberti E, Sartirana S. A numerical procedure for inferring from experimental data the optimization cost functions using a multibody model of the neuro-musculoskeletal system. Multibody Syst Dyn. 2006;16:123–154. [Google Scholar]
- Feldman AG. Once more on the equilibrium-point hypothesis (lambda model) for motor control. J Mot Behav. 1986;18:17–54. doi: 10.1080/00222895.1986.10735369. [DOI] [PubMed] [Google Scholar]
- Feldman AG, Levin MF. The origin and use of positional frames of reference in motor control. Behav Brain Sci. 1995;18:723–806. [Google Scholar]
- Freitas SM, Scholz JP. Does hand dominance affect the use of motor abundance when reaching to uncertain targets? Hum Mov Sci. 2009;28:169–190. doi: 10.1016/j.humov.2009.01.003. [DOI] [PMC free article] [PubMed] [Google Scholar]
- Gelfand IM, Latash ML. On the problem of adequate language in movement science. Motor Control. 1998;2:306–313. doi: 10.1123/mcj.2.4.306. [DOI] [PubMed] [Google Scholar]
- Goodman SR, Latash ML. Feed-forward control of a redundant motor system. Biol Cybern. 2006;95:271–280. doi: 10.1007/s00422-006-0086-4. [DOI] [PubMed] [Google Scholar]
- Gorniak SL, Zatsiorsky VM, Latash ML. Hierarchies of synergies: an example of two-hand, multi-finger tasks. Exp Brain Res. 2007;179:167–180. doi: 10.1007/s00221-006-0777-z. [DOI] [PMC free article] [PubMed] [Google Scholar]
- Harris CM, Wolpert DM. Signal-dependent noise determines motor planning. Nature. 1998;394:780–784. doi: 10.1038/29528. [DOI] [PubMed] [Google Scholar]
- Kaiser HF. The application of electronic computers to factor analysis. Psychol Meas. 1960;20:141–151. [Google Scholar]
- Krishnamoorthy V, Latash ML, Scholz JP, Zatsiorsky VM. Muscle synergies during shifts of the center of pressure by standing persons. Exp Brain Res. 2003;152:281–292. doi: 10.1007/s00221-003-1574-6. [DOI] [PubMed] [Google Scholar]
- Latash ML. Synergy. Oxford University Press; New York: 2008. [Google Scholar]
- Latash ML. Motor control: In search of physics of the living systems. J Hum Kinet. 2010;24:7–18. [Google Scholar]
- Latash ML, Friedman J, Kim SW, Feldman AG, Zatsiorsky VM. Prehension synergies and control with referent hand configurations. Exp Brain Res. 2010;202:213–229. doi: 10.1007/s00221-009-2128-3. [DOI] [PMC free article] [PubMed] [Google Scholar]
- Latash ML, Scholz JF, Danion F, Schöner G. Structure of motor variability in marginally redundant multifinger force production tasks. Exp Brain Res. 2001;141:153–165. doi: 10.1007/s002210100861. [DOI] [PubMed] [Google Scholar]
- Latash ML, Scholz JP, Schöner G. Motor control strategies revealed in the structure of motor variability. Exerc Sport Sci Rev. 2002;30:26–31. doi: 10.1097/00003677-200201000-00006. [DOI] [PubMed] [Google Scholar]
- Latash ML, Scholz JP, Schoner G. Toward a new theory of motor synergies. Motor Control. 2007;11:276–308. doi: 10.1123/mcj.11.3.276. [DOI] [PubMed] [Google Scholar]
- Latash ML, Shim JK, Smilga AV, Zatsiorsky VM. A central back-coupling hypothesis on the organization of motor synergies: a physical metaphor and a neural model. Biol Cybern. 2005;92:186–191. doi: 10.1007/s00422-005-0548-0. [DOI] [PMC free article] [PubMed] [Google Scholar]
- Li ZM, Latash ML, Zatsiorsky VM. Force sharing among fingers as a model of the redundancy problem. Exp Brain Res. 1998;119:276–286. doi: 10.1007/s002210050343. [DOI] [PubMed] [Google Scholar]
- Martin V, Scholz JP, Schöner G. Redundancy, self-motion and motor control. Neural Comput. 2009;21:1371–1414. doi: 10.1162/neco.2008.01-08-698. [DOI] [PMC free article] [PubMed] [Google Scholar]
- Murray RM, Li Z, Sastry S. A Mathematical Introduction to Robotic Manipulation. CRC Press; Roca Baton, FL: 1994. [Google Scholar]
- Mussa Ivaldi FA, Morasso P, Zaccaria R. Kinematic networks. A distributed model for representing and regularizing motor redundancy. Biol Cybern. 1988;60:1–16. doi: 10.1007/BF00205967. [DOI] [PubMed] [Google Scholar]
- Newell KM, Carlton LG. Force variability in isometric responses. J Exp Psychol Hum Percept Perform. 1988;14:37–44. [PubMed] [Google Scholar]
- Newell KM, Corcos DM. Variability and motor control. Human Kinetics Publishers Champaign; IL: 1993. [Google Scholar]
- Oldfield RC. The assessment and analysis of handedness: the Edinburgh inventory. Neuropsychologia. 1971;9:97–113. doi: 10.1016/0028-3932(71)90067-4. [DOI] [PubMed] [Google Scholar]
- Prilutsky BI, Zatsiorsky VM. Optimization-based models of muscle coordination. Exerc Sport Sci Rev. 2002;30:32–38. doi: 10.1097/00003677-200201000-00007. [DOI] [PMC free article] [PubMed] [Google Scholar]
- Raikova RT, Prilutsky BI. Sensitivity of predicted muscle forces to parameters of the optimization-based human leg model revealed by analytical and numerical analyses. J Biomech. 2001;34:1243–1255. doi: 10.1016/s0021-9290(01)00097-5. [DOI] [PubMed] [Google Scholar]
- Robert T, Zatsiorsky VM, Latash ML. Multi-muscle synergies in an unusual postural task: quick shear force production. Exp Brain Res. 2008;187:237–253. doi: 10.1007/s00221-008-1299-7. [DOI] [PMC free article] [PubMed] [Google Scholar]
- Rosenbaum DA, Meulenbroek RJ, Vaughan J, Jansen C. Posture-based motion planning: applications to grasping. Psychol Rev. 2001;108:709–734. doi: 10.1037/0033-295x.108.4.709. [DOI] [PubMed] [Google Scholar]
- Schmidt RA, Zelaznik H, Hawkins B, Frank JS, Quinn JT., Jr. Motor-output variability: a theory for the accuracy of rapid motor acts. Psychol Rev. 1979;47:415–451. [PubMed] [Google Scholar]
- Scholz JP, Danion F, Latash ML, Schöner G. Understanding finger coordination through analysis of the structure of force variability. Biol Cybern. 2002;86:29–39. doi: 10.1007/s004220100279. [DOI] [PubMed] [Google Scholar]
- Scholz JP, Schöner G. The uncontrolled manifold concept: identifying control variables for a functional task. Exp Brain Res. 1999;126:289–306. doi: 10.1007/s002210050738. [DOI] [PubMed] [Google Scholar]
- Scholz JP, Schöner G, Latash ML. Identifying the control structure of multijoint coordination during pistol shooting. Exp Brain Res. 2000;135:382–404. doi: 10.1007/s002210000540. [DOI] [PubMed] [Google Scholar]
- Seif-Naraghi AH, Winters JM, Winters JM, Woo SL-Y. Multiple Muscle Systems: Biomechanics and Movement Organization. Springer-Verlag; New York: 1990. Optimal Strategies for Scaling Goal-Directed Arm Movements; pp. 312–334. [Google Scholar]
- Siemienski A. Direct solution of the inverse optimization problem of load sharing between muscles. J Biomech. 2006;39(Suppl. 1):45. [Google Scholar]
- Terekhov AV, Pesin YB, Niu X, Latash ML, Zatsiorsky VM. An analytical approach to the problem of inverse optimization with additive objective functions: an application to human prehension. J Math Biol. 2010;61:423–453. doi: 10.1007/s00285-009-0306-3. [DOI] [PMC free article] [PubMed] [Google Scholar]
- Todorov E, Jordan MI. Optimal feedback control as a theory of motor coordination. Nat Neurosci. 2002;5:1226–1235. doi: 10.1038/nn963. [DOI] [PubMed] [Google Scholar]
- Tsirakos D, Baltzopoulos V, Bartlett R. Inverse optimization: functional and physiological considerations related to the force-sharing problem. Crit Rev Biomed Eng. 1997;25:371–407. doi: 10.1615/critrevbiomedeng.v25.i4-5.20. [DOI] [PubMed] [Google Scholar]
- Whitney DE. Resolved motion rate control of manipulators and human prostheses. IEEE Trans Man Machine Syst. 1969;10:47–53. [Google Scholar]
- Yang JF, Scholz JP, Latash ML. The role of kinematic redundancy in adaptation of reaching. Exp Brain Res. 2007;176:54–69. doi: 10.1007/s00221-006-0602-8. [DOI] [PMC free article] [PubMed] [Google Scholar]
- Zatsiorsky VM, Latash ML. Multifinger prehension: an overview. J Mot Behav. 2008;40:446–476. doi: 10.3200/JMBR.40.5.446-476. [DOI] [PMC free article] [PubMed] [Google Scholar]
- Zatsiorsky VM, Li ZM, Latash ML. Coordinated force production in multi-finger tasks: finger interaction and neural network modeling. Biol Cybern. 1998;79:139–150. doi: 10.1007/s004220050466. [DOI] [PubMed] [Google Scholar]
- Zatsiorsky VM, Li ZM, Latash ML. Enslaving effects in multi-finger force production. Exp Brain Res. 2000;131:187–195. doi: 10.1007/s002219900261. [DOI] [PubMed] [Google Scholar]


