

Abstract
Down syndrome (DS) is a developmental disorder caused by a third chromosome 21 in humans (Trisomy 21), leading to neurological deficits and cognitive impairment. Studies in mouse models of DS suggest that cognitive deficits in the adult are associated with deficits in synaptic learning and memory mechanisms, but it is unclear whether alterations in the early wiring and refinement of neuronal circuits contribute to these deficits. Here, we show that early developmental refinement of visual circuits is perturbed in mouse models of Down syndrome. Specifically, we find excessive eye-specific segregation of retinal axons in the dorsal lateral geniculate nucleus. Indeed, the degree of refinement scales with defects in the “Down syndrome critical region” (DSCR) in a dose-dependent manner. We further identify Dscam (Down syndrome cell adhesion molecule), a gene within the DSCR, as a regulator of eye-specific segregation of retinogeniculate projections. Although Dscam is not the sole gene in the DSCR contributing to enhanced refinement in trisomy, Dscam dosage clearly regulates cell spacing and dendritic fasciculation in a specific class of retinal ganglion cells. Thus, altered developmental refinement of visual circuits that occurs before sensory experience is likely to contribute to visual impairment in individuals with Down syndrome.
Introduction
Down syndrome (DS) is the most prevalent genetically defined cause of intellectual disabilities, affecting ∼1 of 700 live births in the industrialized world (Pulsifer, 1996). It has a complex etiology arising from the triplication of ∼300 genes on chromosome 21 (Gardiner et al., 2003). Individuals with DS exhibit a number of developmental abnormalities, including smaller brains and dysplasia of the cortex, hippocampus, and cerebellum (Coyle et al., 1986). These changes are associated with mild to moderate cognitive impairment and deficits in sensory function (Nadel, 2003). Early studies revealed significant stunting of dendritic arbors and spine dysgenesis in the cerebral cortex and hippocampus (Coyle et al., 1986; Schmidt-Sidor et al., 1990). These features are indicative of reduced synaptic function and learning potential in the brain (Marin-Padilla, 1976; Takashima et al., 1981).
Studies of mouse models of DS reveal that synapses in hippocampal circuits have a reduced capacity to encode new information (Siarey et al., 1997, 1999, 2005; Costa and Grybko, 2005; Kleschevnikov et al., 2004; Hanson et al., 2007). This loss has been attributed to increased inhibitory tone (Kleschevnikov et al., 2004; Fernandez et al., 2007), a condition that can be reversed by a short 3 week regimen of GABAA receptor antagonists, allowing mice to regain normal cognitive performance (Fernandez et al., 2007). At present, it remains unclear how much brain dysfunction in DS is caused by excitatory/inhibitory imbalances versus the alterations in the development of the neuronal circuits that occurs before the onset of sensory experience.
To explore whether trisomy adversely affects early circuit refinement, we searched for possible changes in the developing visual system. This is a classic system wherein retinal ganglion cell (RGC) axons from the two eyes progress from an initially intermingled to segregated arrangement in the lateral geniculate nucleus (LGN) (McLaughlin and O'Leary, 2005; Hooks and Chen, 2006; Huberman, 2007; Huberman et al., 2008). In both mice and humans (Hevner, 2000), eye-specific segregation in the LGN happens before eye opening and is regulated by spontaneous activity in the retina, as well as molecular guidance cues (Torborg and Feller, 2005; Huberman, 2007; Huberman et al., 2008). Understanding this system is of particular relevance to individuals with DS who in addition to having ocular abnormalities, including strabismus, astigmatism, anisometropia (da Cunha and Moreira, 1996; Wong and Ho, 1997; Haugen and Høvding, 2001), and inaccurate accommodation (Woodhouse et al., 1996; Cregg et al., 2001), also have lower visual acuity and contrast sensitivity (John et al., 2004; Suttle and Turner, 2004).
Surprisingly, we found that eye-specific segregation in the dorsal LGN (dLGN) is supranormal in Ts65Dn mice and that this precocious refinement requires triplication of the Down syndrome critical region (DSCR). We also identified the Down syndrome cell adhesion molecule (Dscam) as a novel regulator of retinogeniculate refinement, although other genes in the DSCR are necessary to enhance segregation in trisomy. Intriguingly, Dscam also regulates cell spacing and dendritic fasciculation of intrinsically photosensitive RGCs (ipRGCs) in a dosage-dependent manner. These findings suggest that the dosage changes of the DSCR, and Dscam in particular, may contribute to developmental deficits in the refinement of visual circuits in DS.
Materials and Methods
Mouse breeding and genotyping.
Segmental trisomy 16 (Ts65Dn) mice were obtained by mating female carriers of the 1716 chromosome (B6EiC3H-a/A Ts65Dn) with (C57BL/6JEi × C3H/HeSnJ) F1 hybrid males (Davisson et al., 1993). The Ts65Dn mice are thus maintained on the B6C3H background. Male Dscam+/− mice were crossed to female B6EiC3H-a/A Ts65Dn mice to generate wild-type (WT) mice with one or two copies of Dscam and trisomic mice with two or three copies of Dscam. In some cases, resulting Dscam+/− mice were also intercrossed to generate Dscam−/− mice. Mice with segmental trisomy (Ts1Rhr) and monosomy (Ms1Rhr) for the DSCR [B6.Dup(16Cbr1-ORF9)1Rhr and B6C3.Del(16Cbr1-ORF9)1Rhr, respectively] were obtained directly from Roger Reeves, and female or male carriers were maintained as an advanced intercross between C57BL/6JEi and C3H/HeSnJ on arrival. Ts1Rhr mice were also crossed to Dscam+/− mice to generate wild-type mice with one or two copies of Dscam and DSCR trisomic mice with two or three copies of Dscam. Ts65Dn mice were genotyped using quantitative real-time PCR (Liu et al., 2003) with minor modifications as described previously (Hanson et al., 2007). Ts1Rhr and Ms1Rhr mice were genotyped with the same protocol but using primers and TaqMan probes for the Mx1 instead of the App gene. All mice were genotyped for the presence of the Rd mutation, and only adult mice with wild-type or Rd/+ genotype were used in the study. For early developmental time points [postnatal day 4 (P4), P10/P12] animals of all Rd genotypes were used, since no correlation was found between Rd genotype and the described phenotypes. All procedures were in compliance with Administrative Panel on Laboratory Animal Care approved animal protocols from Stanford University.
Labeling of retinogeniculate afferents.
Mice were anesthetized with isoflurane and received intravitreal injections of cholera toxin-β subunit (CTβ) conjugated to Alexa Fluor 488 (green) or Alexa Fluor 594 (red) as described previously (Bjartmar et al., 2006) with slight modifications. In brief, CTβ (Invitrogen) conjugated to Alexa Fluor 488 (green label) was injected into one eye, and CTβ conjugated to Alexa Fluor 594 (red label) was injected into the other eye (2–3 μl; 0.5% in sterile saline); CTβ has no biological activity. At 24 h later, brain tissue was harvested and fixed overnight in 4% paraformaldehyde (PFA), cryoprotected in 30% sucrose, then sectioned coronally at 40 μm on a freezing microtome, mounted onto slides, and coverslipped with Vectashield (Vector Laboratories).
Epibatidine injections.
Mice received intravitreal injections of epibatidine (diluted in saline, volume of 1 μl per eye, 1 mm; Sigma) on P3, P5, and P7 as described previously (Penn et al., 1998; Rossi et al., 2001). At this concentration/injection regimen, epibatidine silences retinal calcium waves and has a severe impact on RGC firing that prevents eye-specific targeting in ferrets and wild-type mice (Penn et al., 1998; Rossi et al., 2001; Sun et al., 2008).
Quantification of LGN images.
Images were digitally acquired at 10× with a color CCD camera (SPOT). All images were collected and quantified blind to the genotype, and littermate controls were used. Universal gains and exposures were established for each label. Raw images of the LGN were imported to Photoshop (Adobe Systems), binary images were generated, and the threshold was adjusted using a multi-threshold protocol described previously (Muir-Robinson et al., 2002; Torborg and Feller, 2004). The degree of left and right eye axon overlap was determined for each threshold using the image calculation function to identify pixels present in both channels. This technique is designed to compare overlap across a range of signal-to-noise values in wild-type versus mutant mice. This approach allows for direct statistical comparison of overlap between various strains of mice at different ages. The size of the dLGN, ipsilateral (ipsi), contralateral (contra), and overlap area was determined by importing binary images into NIH ImageJ to measure areas for the different thresholds. Optic tract and ventral LGN were excluded from the analysis by outlining the dLGN with a freehand tool. Unless otherwise stated, two groups (mutant mice vs wild-type littermate controls) were directly compared, and an unpaired two-tailed t test was used to determine statistical significance. Results are graphed as means ± SEM. Left and right LGN were included in the analysis, and each LGN was considered an independent n. Results were typically obtained from at least six LGNs per genotype. The total n for each condition (number of LGNs per genotype and age) is indicated in the figure legends.
We also used a threshold-independent method to confirm some of the genotypes presented in this study (Torborg and Feller, 2004). In brief, background fluorescence was subtracted using a rolling-ball filter (NIH Image), and the grayscale was renormalized so that the range of grayscale values was from 0 to 256. IgorPro Software (Wavemetrics) was used to perform a segregation analysis. For each pixel, we computed the logarithm of the intensity ratio, r = log10(FI/FC), where FI is the ipsilateral channel fluorescence intensity, and FC is the contralateral channel fluorescence intensity. We then calculated the variance of the distribution of R values for each section, which was used to compare the width of the distributions across animals. A higher variance is indicative of a wider distribution of R values, which is in turn indicative of more contra- and ipsi-dominant pixels and therefore more segregation. Although this method is a threshold-independent measure of segregation, it is also less sensitive and does not take special correlations into account. Hence, the sharpness of the borders between the ipsi and contra regions will be more apparent using the multi-threshold approach.
Multielectrode array recording.
Ts1Rhr and littermate control mice were anesthetized using isoflurane, in accordance with the National Institutes of Health and institutional guidelines regarding animal use, and enucleated. The eyes were transferred to oxygenated artificial CSF (ACSF) containing the following (in mm): 119.0 NaCl, 26.2 NaHCO3, 11 glucose, 2.5 KCl, 1.0 K2HPO4, 2.5 CaCl2, and 1.3 MgCl2. The retina was dissected out and placed ganglion-cell-side down onto a 60 electrode array (Multi-Channel Systems). The array electrodes are 10 μm in diameter, arranged in an 8 × 8 grid (minus 4 corners) with 100 μm inter-electrode spacing. The retina was held in place on the array with a weighted piece of dialysis membrane and superfused continuously with oxygenated ACSF (∼3 ml/min, pH 7.4, gassed with 95% O2 and 5% CO2) maintained at 32°C.
The voltage trace on each electrode was sampled at 20 kHz and stored for offline analysis. The traces were then pass filtered between 120 and 2000 Hz. Spikes that crossed a threshold of three times the root mean square of the noise on each electrode were sorted according to the two principle components of their voltage waveforms. A valley seeking algorithm was then used to sort spikes clusters into individual units. To verify that each unit identified by this algorithm corresponded to a single cell, units were inspected manually. Furthermore, those that lacked a refractory period in their autocorrelation function were considered contaminated by other neurons and excluded from the analysis. The mean spike rate, r, was calculated by dividing the total number of spikes for each unit by the recording duration, and units whose mean spike rate was < of the mean firing rate of all cells were excluded from additional analysis to reduce contamination from low spiking cells. After this cut, 20–45 units were identified per retina for the P5–P7 age group and 60–100 units for the P11–P13 age group.
Bursts were then identified for each neuron using a modified Poisson surprise method. In this method, spike trains of minimum three spikes whose interspike interval (ISI) was less than half of the mean ISI of that unit were identified. The probability that such a spike train would occur given a Poisson spike distribution was then calculated from
 |
where t is the duration of the spike train (time between the first and last spike under investigation), C is the number of spikes in the train, and r is the mean spike rate of the unit. The spike train was accepted as a burst when its probability of occurrence was Pc < 10–4. On identification of bursts, the interburst interval (time between end of one burst and start of the next), burst duration (t), burst firing rate (C/t), and the percentage of time firing (sum of t for all bursts/total length of recording) were computed and averaged for each unit. The medians and quartiles of these parameters were found by grouping the cells according to age and genotype. Differences between medians of different genotypes within each age group were evaluated for statistical significance using a two-sided Wilcoxon's rank sum test, which rejected or confirmed the null hypothesis of equal medians at the 1% significance level.
The correlation index was calculated for all cell pairs in each retina using a method described previously (Wong et al., 1993; Torborg and Feller, 2005; Torborg et al., 2005). The correlation index (CI) is a measure of the likelihood relative to chance that a pair of neurons fire together within a given time window, Δt = 0.1 s. It is calculated from
 |
where NAB is the number of spike pairs for which cell B fires within a time ± Δt from cell A, NA and NB are the total number of spikes fired by cells A and B, respectively, during the entire recording T (normalization condition), and Δt is the correlation time window.
The distance between cells was approximated to be the distance between the electrodes on which the activity of the cells was recorded. The cell pairs were grouped according to their intercellular distance, and the median and quartile correlation indices were computed over all cell pairs in a given distance group, for each age and genotype. The median correlation index was then plotted as a function of increasing intercellular distance.
Immunohistochemistry.
For retina whole mounts, mice were perfused transcardially with PBS and 4% PFA. Eyes were enucleated and placed in a dish containing PBS. A small hole was made at the junction between the cilliary body and retina with a 30 gauge needle. The eye was hemisected, and the retina was gently teased away from the sclera. Retinas were fixed a second time in 4% PFA for 1 h, followed by a rinse in PBS. Retinas were incubated with primary antibodies in PBS, supplemented with 3% normal horse serum and 0.5% Triton X-100, for 3–5 d at 4°C with gentle rocking. Primary antibodies were washed off overnight in PBS, and the retinas were incubated with secondary antibodies in PBS, 3% normal horse serum, and 0.5% Triton X-100. Retinas were washed for 2–4 h in PBS and were flat mounted. The following antibodies were used in this study: goat anti-Brn3b (1:200; Santa Cruz Biotechnology), mouse anti-neurofilament (1:50; 2H3; Developmental Studies Hybridoma Bank), rabbit anti-melanopsin (1:10,000; generously provided by Ignacio Provencio, Uniformed Services University of the Health Sciences, Bethesda, MD). Cryostat sections of the retina were immunostained as described previously (Fuerst et al., 2008, 2009).
Quantification of cell numbers in the retina.
BRN3b-positive cells were counted in the retinal ganglion cell layer of sections of whole-eye cut midsection through the optic nerve. The number of BRN3b-positive RGCs were determined in Ts65Dn, wild-type (Dscam+/+), Dscam heterozygous (Dscam+/−) and homozygous (Dscam−/−) mutants, and Bax homozygous mutants (Bax−/−). Cell numbers were averaged from three sections from each of three retinas per genotype (two from the Bax−/− genotype). RGCs in the Dscam−/− retina were not infrequently located in the inner plexiform layer and were only counted if they were closer to the retinal ganglion cell layer than the inner nuclear layer.
The presence and frequency of fasciculation, defined as the bundling of melanopsin-positive RGC dendrites such that they run together, was recorded in whole retinas of wild-type mice (Dscam+/+) and trisomic mice carrying three (Ts65Dn) or two copies (Ts65Dn; Dscam+/−) of Dscam. Fasiculation events were rare or absent in retinas of these genotypes, and all fasciculation events observed in a single retina (zero to three) were recorded as a single number. A two-tailed paired t test was performed to compare the frequency of fasciculation events in Ts65Dn retinas compared with Dscam+/+ or Ts65Dn; Dscam+/− retinas. We also compared the total number of melanopsin-positive RGCs and the proportion of cells that had their soma or primary dendrites entangled in a fascicle in Dscam+/+, Dscam+/−, Dscam−/−, Ms1Rhr, Ts65Dn, and Ts65Dn; Dscam+/− retinas. Melanopsin-positive RGCs were counted in at least three representative fields containing fasciculated cells, which were imaged halfway between the optic disk and periphery of the retina.
Results
Trisomy enhances eye-specific segregation in the dLGN
To determine whether trisomy alters neuronal circuit refinement in the retino-dLGN pathway, we performed whole-eye anterograde labeling of retinogeniculate axons using intraocular injections of fluorescently labeled CTβ in P11 Ts65Dn mice and wild-type littermate controls and assessed the segregation of RGC axons at P12, which is ∼2 d before eye opening in the mouse. Contra and ipsi eye termination zones in the dLGN of Ts65Dn mice (Fig. 1d,e) had a more confined appearance and showed a more sharply segregated pattern (Fig. 1f) compared with wild-type littermate controls (Fig. 1a–c). Contra, ipsi, and overlap areas were measured and normalized to the total dLGN area to account for individual differences in animal growth. The relative contra, ipsi, and overlap area analyzed at several thresholds were all significantly smaller in Ts65Dn animals (Fig. 1g–i), as was the percentage ipsi area that overlapped with contra projections (Fig. 1j). Intriguingly, overlay images from ipsi and contra projections revealed a distinct border between contra and ipsi areas in Ts65Dn mice and a lack of intermingled axons from the two eyes, normally seen in wild-type mice (Fig. 1k,l). To further confirm our findings, we used a threshold-independent method to analyze sections from the same animals (Torborg and Feller, 2004). The segregation index was higher in Ts65Dn mice compared with wild-type littermate controls, and this difference was statistically significant (p = 0.001). Together, these data indicate that trisomy (which includes >100 genes) in Ts65Dn mice enhances eye-specific refinement in the dLGN, a surprising and, to date, unprecedented phenotype in mutant mice.
Figure 1.
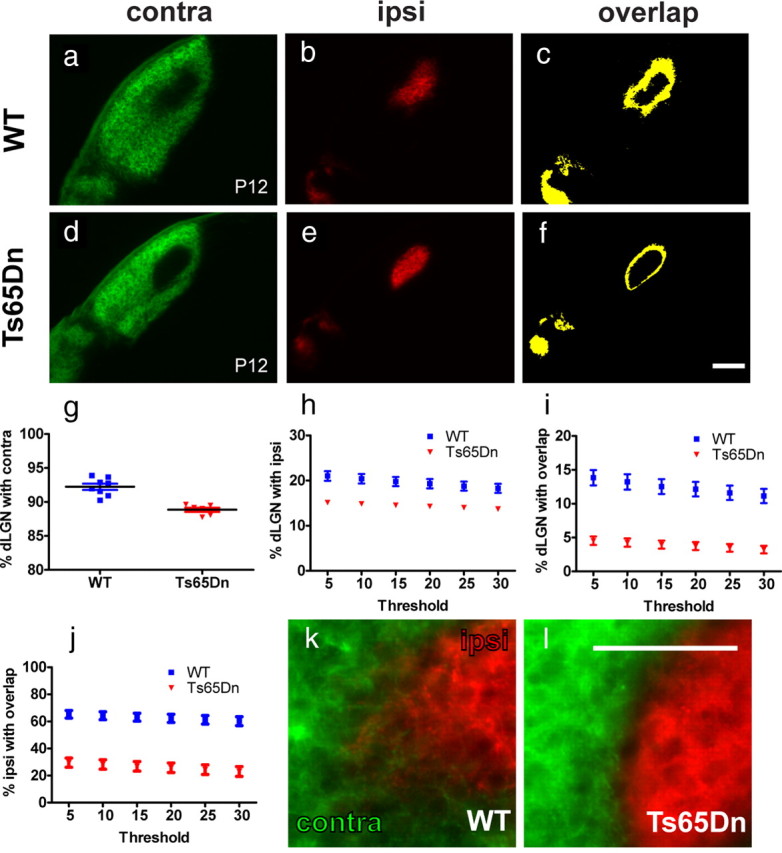
Trisomic mice have enhanced segregation of retinogeniculate projections before eye opening. a–f, Photomicrographs of coronal sections showing contra and ipsi retinal projections to the dLGN at P12. a–c, WT animals show a significant degree of overlap between ipsi and contra projections indicated in yellow in the overlap image. d–f, In Ts65Dn mice, ipsi and contra projections are abnormally strongly segregated, resulting in less overlap compared with WT controls. g, The area occupied by contra projections normalized to the total area of the dLGN is significantly smaller in Ts65Dn mice (p = 0.0001). h, The relative ipsi area in Ts65Dn mice is also smaller across a range of thresholds (p < 0.01). i, The relative overlap area is consistently smaller in Ts65Dn mice at several different thresholds (p < 0.0001). j, The percentage ipsi area overlapping with contra projections is significantly lower in Ts65Dn mice across all thresholds (p < 0.0001). k, l, Merged images show that ipsi and contra projections intermingle to a certain degree at the contra/ipsi border in WT but not Ts65Dn animals. Graphs show the mean ± SEM; n = 8 (WT) and n = 6 (Ts65Dn); two-tailed t test. Scale bar: f, 200 μm; l, 100 μm.
Enhanced eye-specific segregation emerges first during the period of synaptic refinement and persists into adulthood
Differences in segregation patterns could be attributable to defects in RGC axon targeting. To determine whether axon targeting occurs normally, we evaluated Ts65Dn mice and wild-type littermate controls at P4 (Fig. 2a–g), a time point when RGC axons have reached the dLGN but eye-specific segregation has not begun (Godement et al., 1984; Jaubert-Miazza et al., 2005). In both control and Ts65Dn P4 mice, contra projections covered the entire and ipsi projections a large portion of the dLGN and showed a high degree of overlap (Fig. 2a–f). Accordingly, the relative overlap area was not significantly different across genotypes (Fig. 2g). Using the threshold-independent method, we confirmed that the segregation index was not statistically different between P4 Ts65Dn and wild-type controls (p = 0.82). This result indicates that the initial targeting of RGC axons to the dLGN is normal in Ts65Dn mice and suggests that processes that ensue from P4–P10 underlie the enhanced segregation phenotype.
Figure 2.

Initial targeting of retinogeniculate projections to the dLGN is normal in trisomic animals, and enhanced eye-specific segregation persists into adulthood. Contra and ipsi projections are targeted to the appropriate areas in the dLGN in WT (a–c) and Ts65Dn (d–f) mice at P4. Contra projections fill the entire and ipsi projections a large portion of the dLGN, leading to substantial overlap shown in yellow (c, f). g, The relative overlap area shows no significant differences between genotypes at all thresholds analyzed. Compared with WT mice (h–j), adult Ts65Dn mice (k–m) show stronger segregation of contra and ipsi projections and less overlap (j, m). n, The relative overlap area is significantly different between genotypes at the three lowest thresholds (p < 0.05). o, The percentage ipsi area overlapping with contra is also consistently different across thresholds (p < 0.01). Graphs show the mean ± SEM; n = 7 (WT, P4) and n = 6 (Ts65Dn, P4); n = 8 (WT, P30) and n = 11 (Ts65Dn, P30); two-tailed t test. Scale bar, 200 μm.
After eye opening, the eye-specific pattern of retinogeniculate projections is maintained (Jaubert-Miazza et al., 2005; Hooks and Chen, 2006). To test whether the enhanced segregation phenotype is maintained into adulthood, we analyzed P30 Ts65Dn animals and wild-type controls (Fig. 2h–o). Similar to P12 animals, adult Ts65Dn animals showed more defined eye-specific territories than wild-type animals (Fig. 2, k,l and h,i, respectively) and a stronger segregation of ipsi and contra projections in the dLGN (Fig. 2j,m). The relative overlap area was significantly different from wild-type controls for the three lowest thresholds (Fig. 2n). For the percentage ipsi area overlapping with contra projections, means were significantly different from controls across all thresholds (Fig. 2o). The overlay images of ipsi and contra projections confirm less intermingling in Ts65Dn mice compared with wild-type controls (data not shown). The threshold-independent method confirmed a trend toward a higher segregation index in adult Ts65Dn animals compared with wild-type controls but did not reach statistical significance (p = 0.48). The overall density of contra and ipsi projections seemed reduced in the adult, consistent with a period of synapse elimination after the initial eye-specific segregation reducing the number of retinal inputs to LGN neurons from 10 during the first week of life to 2–3 by P15 (Jaubert-Miazza et al., 2005; Hooks and Chen, 2006; Ziburkus and Guido, 2006). Collectively, these results indicate that trisomy causes enhanced circuit refinement that persists into adulthood.
The DSCR regulates eye-specific segregation in a dose-dependent manner
Triplication of the DSCR in humans has been thought to be responsible for most of the DS-specific features such as craniofacial abnormalities and mental retardation (Korenberg et al., 1994). Reeves and colleagues generated segmental trisomy and monosomy mouse models to test this hypothesis. Ts1Rhr and Ms1Rhr mice carry three and one copy of the DSCR, respectively, whereas all other segments of mouse chromosome 16 triplicated in Ts65Dn mice are present in two copies (Olson et al., 2004). We thus used the segmental mouse models to test whether the DSCR is involved in eye-specific segregation during early postnatal development (Fig. 3). Compared with wild-type littermate controls, contra and ipsi areas appeared more refined in Ts1Rhr (Fig. 3a–h) and less refined in Ms1Rhr mice (Fig. 3i–p). Ts1Rhr showed less and Ms1Rhr mice more intermingling of ipsi and contra projections compared with their respective wild-type controls (Fig. 3, d,h and i,p). Accordingly, the relative overlap area was significantly smaller in Ts1Rhr and significantly larger in Ms1Rhr mice compared with controls (Fig. 3q). Likewise, the percentage ipsi area overlapping with contra was smaller in Ts1Rhr and larger in Ms1Rhr than in controls (Fig. 3r). The monosomy phenotype was also present in adult Ms1Rhr mice, indicating that the lack of segregation was not attributable to a developmental delay (see Fig. 8a–f,s). Consistent with a dosage effect of the DSCR, analysis with the threshold-independent method also showed a comparable trend toward a higher segregation index in P10 Ts1Rhr mice (p = 0.22) and a lower segregation index in P10 Ms1Rhr (p = 0.22) compared with their respective wild-type littermate controls. The latter trend reached statistical significance in adult Ms1Rhr mice (p = 0.02). Together, the data suggest that the DSCR drives eye-specific segregation in a dose-dependent manner.
Figure 3.
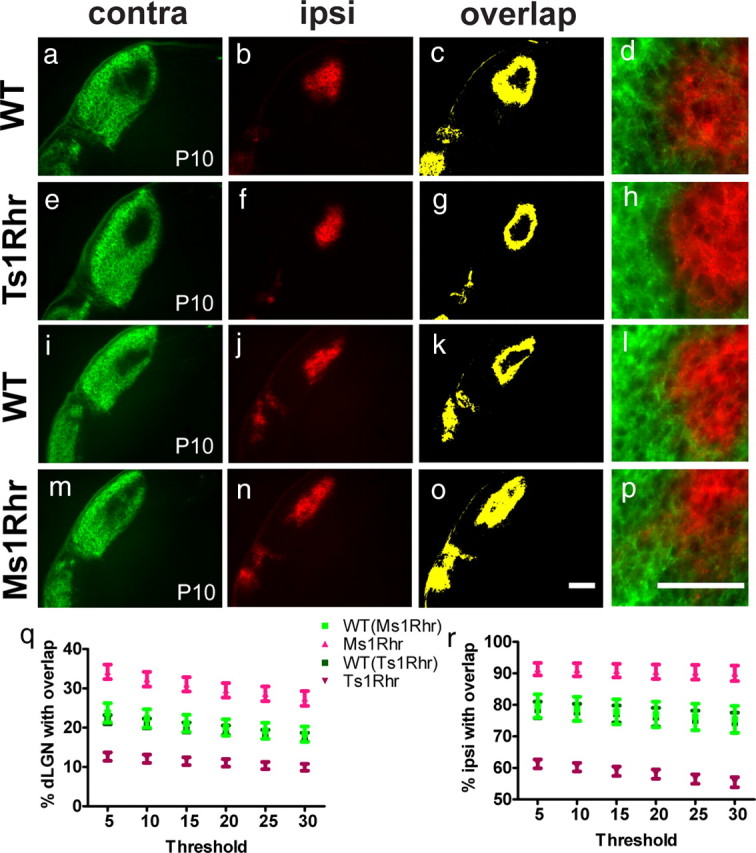
The DSCR regulates eye-specific segregation in a dosage-dependent manner. P10 LGN of WT mice (a–d, i–l) and animals carrying either three (Ts1Rhr; e–h) or one (Ms1Rhr; m–p) copy of the DSCR: compared with WT littermates, contra and ipsi projections show less overlap in Ts1Rhr (c, g), and more overlap in Ms1Rhr as seen in yellow (l, p). q, The relative overlap area is significantly decreases in Ts1Rhr (p < 0.001) and significantly increased in Ms1Rhr (p < 0.01) mice across all thresholds. r, The percentage ipsi area overlapping with contra is also reduced in Ts1Rhr animals (p < 0.001) and increased in Ms1Rhr mice (p < 0.05) when compared with WT controls at all thresholds. Graphs show the mean ± SEM; n = 6 (WT) and n = 6 (Ts1Rhr); n = 8 (WT) and n = 6 (Ms1Rhr); two-tailed t test. Scale bar (in o), 200 μm. d, h, l, p, Zoomed-in views of the contra/ipsi border in the dLGN of P10 trisomic and monosomic mice reveal that trisomy (Ts1Rhr) causes contra and ipsi projections to avoid each other's territory, whereas monosomy (Ms1Rhr) prevents segregation of eye-specific projections. Scale bar (in p), 100 μm.
Figure 8.
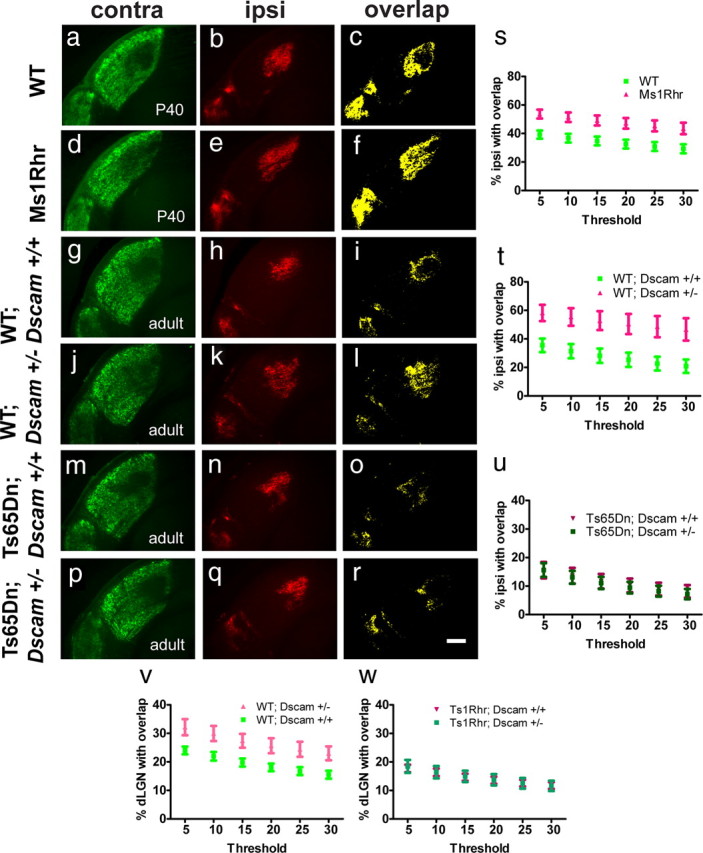
Circuit refinement in the dLGN is perturbed by a decrease in Dscam dosage. Compared with littermate controls (a–c) adult Ms1Rhr mice (d–f) still show a lack of eye-specific segregation and more overlap (c, f). Similarly, compared with WT controls with two copies of Dscam (WT; Dscam+/+; g–i) eye-specific segregation is impaired in WT mice carrying only one copy of Dscam (WT; Dscam+/−; j–l). Contra projections cover a majority of the dLGN in WT; Dscam+/− mice but have retracted from the ipsi territory in WT; Dscam+/+ animals. This leads to substantially more overlap in WT; Dscam+/− mice as seen in yellow (i, l). However, trisomic Ts65Dn animals with three copies of Dscam (Ts65Dn; Dscam+/+; m–o) are indistinguishable from trisomic Ts65Dn animals with two copies (Ts65Dn; Dscam+/−; p–r). Accordingly, the percentage ipsi area overlapping with contra is significantly higher in Ms1Rhr mice (p < 0.01; s) and WT; Dscam+/− animals (p < 0.05; t) than in WT controls but not significantly different in trisomic Ts65Dn animals with two or three copies of Dscam (u). Graphs show the mean ± SEM; n = 10 (WT) and n = 8 (Ms1Rhr); n = 6 (WT; Dscam+/+) and n = 10 (WT; Dscam+/−); n = 6 (Ts65Dn; Dscam+/+) and n = 12 (Ts65Dn; Dscam+/−); two-tailed t test. Scale bar, 200 μm. v, w, Reducing Dscam to one copy in the context of trisomy of the DSCR (TsRhr1) prevents eye-specific segregation in the dLGN at P10. v, The relative overlap area is significantly larger in WT; Dscam+/− animals compared with WT; Dscam+/+ controls (p < 0.05) across all thresholds. w, However, the relative overlap area is not significantly different in Ts1Rhr; Dscam+/+ animals and Ts1Rhr; Dscam+/− animals at any threshold. Graphs show the mean ± SEM; n = 6 (WT; Dscam+/+) and n = 4 (WT; Dscam+/−); n = 9 (Ts1Rhr; Dscam+/+) and n = 8 (Ts1Rhr; Dscam+/−); two-tailed t test.
Ts1Rhr mice have normal retinal wave properties that drive eye-specific segregation in the dLGN
During the first 2 postnatal weeks of development, correlated spontaneous retinal activity, which propagates across the retina in the form of waves, contributes to driving dLGN segregation (Katz and Shatz, 1996; Zhang and Poo, 2001). Retinal waves have distinct spatial and temporal properties that are critical for normal segregation. Therefore, it is possible that the enhanced segregation we observe in trisomic mice is attributable to an increase in RGC firing during waves. To determine whether Ts1Rhr mice have altered spontaneous firing patterns, we performed multielectrode array recordings on retinas isolated from Ts1Rhr mice and wild-type littermate controls. We focused on two different age ranges, P5–P7 (which is in the middle of the period when eye specific segregation occurs in mice) and P11–P13 (after eye-specific segregation is completed), and found that Ts1Rhr mice have similar spontaneous firing patterns from littermate controls for both age ranges (Fig. 4).
Figure 4.

Ts1Rhr mice have normal spontaneous retinal activity during development. a, Raster plots of 10 single-unit spike trains over a 10 min interval, recorded from retinas isolated from a P6 WT (top left) and Ts1Rhr (Ts, bottom left) littermate and a P12 WT (top right) and Ts (bottom right) littermate. (The 10 single units selected corresponded to those with the highest mean firing rate in each sample.) b, Pairwise correlation index as a function of intercellular distance for WT (black circles) and Ts (gray triangles) littermates at P5–P7 (left, averaged across 7 retinas per genotype) and P11–P13 (right, averaged across 4 retinas per genotype). The data points correspond to median values and the upper error bars are the 75th percentile. [The bottom error bars (25th percentile) stretched to a correlation index of <1 in all cases and have been omitted for clarity.] c, Summary of the temporal properties of spontaneous firing patterns for retinas isolated from WT (black) and Ts (gray) littermates at P5–P7 and P11–P13. Data are averaged over mean values for each cell of a given age and genotype (P5–P7, 7 retinas per genotype; P11–P13, 4 retinas per genotype). The boxes correspond to medians and quartiles and the whiskers to 5 and 95%. Asterisks imply a significant difference in medians at the 1% significance level as determined by a Wilcoxon's rank sum test; p values for all measurements are listed in Table 1.
Spikes produced by individual RGCs were identified as described in Materials and Methods (P5–P7, control, n = 207 cells from 7 retinas; Ts1Rhr, n = 231 cells from 7 retinas; P11–P13, control, n = 332 cells from 4 retinas; Ts1Rhr, n = 290 cells from 4 retinas; all retinas were from different mice). The global firing patterns of individual RGCs were similar between wild-type and Ts1Rhr mice (Fig. 4a).
To assay spatial wave characteristics, we computed a pairwise correlation index as a function of distance between two RGCs (Meister et al., 1991; Wong et al., 1993; Torborg and Feller, 2005). We found no significant differences between Ts1Rhr mice and littermate controls. In all retinas, over both age ranges, the correlation index was highest for nearest neighbors and fell off smoothly with increasing intercellular distance (Fig. 4b).
To assay the temporal firing characteristics, we computed the following properties: mean firing rate of isolated RGCs, percentage of time a cell was bursting, interburst interval, burst duration, and firing rate during a burst. These properties were similar in Ts1Rhr mice relative to littermate controls for both age ranges (Fig. 4c). Together, these recordings demonstrate that enhanced dLGN segregation in Ts1Rhr mice is not attributable to a variation in the spontaneous RGC firing patterns.
Perturbing spontaneous retinal waves prevents eye-specific segregation in trisomic animals
Because cholinergic retinal waves are known to drive eye-specific segregation in the dLGN (Penn et al., 1998; Rossi et al., 2001) (for review, see Huberman et al., 2008), we asked whether perturbing cholinergic wave activity with the pharmacologic agent epibatidine prevents segregation in trisomic animals similar to wild-type controls. Newborn pups received intravitreal injections of epibatidine at P3, P5, P7, and P8, and retinogeniculate projections were subsequently visualized by CTβ injections at P9. Epibatidine treatment prevented segregation in both wild-type and Ts1Rhr animals (Fig. 5). Contra projections covered the entire dLGN and did not retract from the ipsi territory in both genotypes (Fig. 5a,d). Ipsi projection in wild-type and Ts1Rhr dLGN also stayed diffusely distributed and did not accumulate in the ipsi patch (Fig. 5b,e). As a result of this, there was an almost complete overlap of ipsi with contra projections in both genotypes (Fig. 5c,f). The relative ipsi and overlap area as well as the percentage ipsi area overlapping with contra projections were not significantly different between wild-type and Ts1Rhr mice (Fig. 5g–i). Using the threshold-independent method, we confirmed that the segregation index is not statistically different between epibatidine-treated Ts1Rhr and wild-type littermate controls (p = 0.94). These results indicate that the enhanced eye-specific segregation of retinal RGC axons observed in trisomy cannot occur without correlated retinal activity during early refinement.
Figure 5.

Altering spontaneous retinal waves with epibatidine prevents eye-specific segregation in Ts1Rhr mice and wild-type littermate controls. WT (a–c) and Ts1Rhr (d–f) mice received intravitreal injections of epibatidine (epi) at P3, P5, P7, and P8 and a CTβ injection at P9. Contra projections (a, d) cover the entire dLGN in WT–epi and Ts1Rhr–epi mice at P10, and ipsi projections are not confined to the ipsi patch in both genotypes (b, e), leading to a complete overlap of the ipsi area with the contra projections (c, f). Accordingly, no significant differences were observed in the relative ipsi and overlap areas when comparing WT–epi and Ts1Rhr–epi animals (g–i). Graphs show the mean ± SEM; n = 4 (WT), n = 6 (Ts1Rhr); two-tailed t test. Scale bar, 200 μm.
Dscam mutant mice show altered eye-specific segregation in the dLGN
Eye-specific segregation relies of normal spontaneous RGC activity, but molecular cues have been implicated in this process as well (Huberman et al., 2008). One interesting molecule within the DSCR that could potentially mediate the enhanced circuit refinement we observed is the Down syndrome cell adhesion molecule (Dscam). First, in Drosophila, Dscams are found to function in dendritic (Hughes et al., 2007; Matthews et al., 2007; Soba et al., 2007) and axon (Millard et al., 2007) tiling, which reflect segregation of dendrites and axons. Second, in mice, Dscam maintains the regular spacing of cell bodies and prevents dendrite fasciculation among homotypic amacrine and ganglion cells (Fuerst et al., 2008, 2009). Finally, in chickens, Dscam can direct lamina-specific connections in the inner plexiform layer of the retina (Yamagata and Sanes, 2008), indicating a fundamental role for Dscam in distinguishing/defining target neurons and self. Dscam is expressed in nearly all RGCs in the mouse retina as well as in the LGN (Barlow et al., 2002; Fuerst et al., 2009) and, given the phenotypes seen in mice carrying three versus one copy of the DSCR, we asked whether Dscam also contributes to axon refinement in the dLGN in the context of DS.
We first assessed eye-specific segregation in adult Dscam heterozygous and homozygous mutant mice (Fuerst et al., 2008). Although Dscam wild-type controls (Dscam+/+) showed normal eye-specific segregation (Fig. 6a–c), heterozygous (Dscam+/−) and homozygous (Dscam−/−) Dscam mutant mice revealed distinct phenotypes in the dLGN. Dscam+/− showed a lack of segregation (Fig. 6d–f) similar to Ms1Rhr mice (Fig. 3m–p). Dscam−/− mice, conversely, exhibited an altered pattern of segregation (Fig. 6g–i), in which ipsi projections to the dLGN appeared to segregate into more than one ipsi patch similar to phenotypes observed in animals with altered ephrin signaling (Huberman et al., 2005; Pfeiffenberger et al., 2005). The relative contra area was significantly larger in Dscam+/− mutants compared with both Dscam+/+ controls and Dscam−/− mutants (Fig. 6j). The relative ipsi area was significantly different among all three genotypes (Fig. 6k). The relative ipsi area overlapping with contra projections was significantly larger in Dscam+/− mutants compared with both Dscam+/+ and Dscam−/− mice (Fig. 6l). In addition, using the threshold-independent method, we found that the segregation index was significantly lower in Dscam+/− (p < 0.001) and significantly higher in Dscam−/− mutant mice (p = 0.01) compared with Dscam+/+ controls, supporting the role of Dscam as a regulator of eye-specific segregation in the LGN.
Figure 6.

Dscam regulates eye-specific segregation in the dorsal LGN. Compared with WT Dscam+/+ controls (a–c), heterozygous Dscam+/− mice show a lack of segregation in the dLGN. Contra projections cover almost the entire dLGN, and ipsi projections fail to accumulate in the ipsi patch (d–f). Homozygous Dscam−/− mice exhibit an altered pattern of segregation with more than one ipsi patch (g–i). j, The relative contra area is significantly larger in Dscam+/− mice compared with WT controls (p < 0.0001) and Dscam−/− mice (p < 0.0001). k, Compared with WT controls, the relative ipsi area is significantly smaller in Dscam+/− (p < 0.05) for the four highest thresholds and significantly larger in Dscam−/− (p < 0.01) across all thresholds. l, The relative ipsi area overlapping with contra was significantly larger in Dscam+/− animals compared with WT controls (p < 0.0001) and compared with Dscam−/− animals (p < 0.001) at all thresholds. Graphs show the mean ± SEM; n = 14 (WT), n = 26 (Dscam+/−), and n = 8 (Dscam−/−); two-tailed t test. Scale bar, 200 μm.
Axons project to the optic disk normally in Ts65Dn, Dscam+/−, and Dscam−/− retinas compared with Dscam+/+ wild-type controls at postnatal day 15 (Fig. 7a–d). We did not observe statistically significant differences in BRN3b-positive RGC numbers in Ts65Dn, Dscam+/+, or Dscam+/− animals (Fig. 7e–h,j), suggesting that the observed LGN phenotypes are not attributable to an altered number of axons projecting from the retina to the LGN at this age (Fuerst et al., 2009). There is a statistically significant increase, however, in the number of BRN3b-positive RGCs in the Dscam−/− retina (Fig. 7i,j) possibly contributing to the LGN segregation difference between Dscam+/− and Dscam−/− mice (Fuerst et al., 2009). Together, the results reveal that, in addition to its roles in patterning cell spacing in the retina, Dscam is a key mediator of eye-specific patterning in the dLGN.
Figure 7.
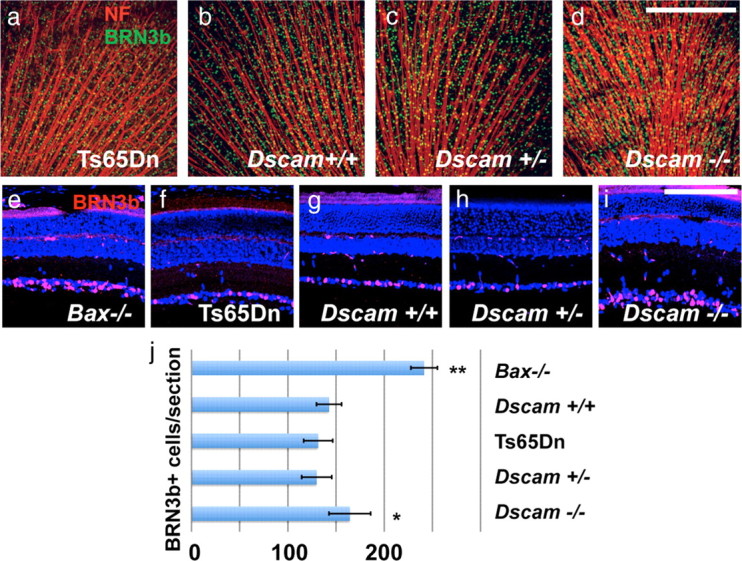
Effect of Dscam dosage changes on RGC number. a–d, Retinas stained with antibodies to neurofilament (NF) and BRN3b, a marker of most RGCs. Axons project toward the optic disk in Ts65Dn, Dscam+/+, Dscam+/−, and Dscam−/− retinas at postnatal day 15 (n > 3). Scale bar (in d), 387.5 μm. e–j, BRN3b-postive RGC number is increased in Dscam−/− retinas compared with Ts65Dn, Dscam+/+, or Dscam+/− retinas (p < 0.05; n > 3). Bax−/− mice, which are deficient in normal developmental cell death, had a statistically significant (p < 0.01) increase in the number of RGCs compared with all other genotypes. No significant difference was detected between the number of BRN3b-positive RGCs in Dscam+/+, Dscam+/−, and Ts65Dn retinas. Scale bar (in i), 46.6 μm.
Dscam dosage affects normal circuit refinement in the dLGN
An important question raised by the previous experiment is whether it is the triplication of Dscam that is solely responsible for the altered regulation of eye-specific segregation in trisomic mice. To explore this issue, we crossed heterozygous Dscam mutant mice to Ts65Dn mice to generate wild-type mice (WT; Dscam+/+), wild-type mice with only one copy of Dscam (WT;Dscam+/−), and trisomic mice with three (Ts65Dn; Dscam+/+) or two (Ts65Dn; Dscam+/−) copies of Dscam. We then assessed eye-specific segregation in adult animals (Fig. 8). Compared with WT; Dscam+/+ controls, WT; Dscam+/− mice showed a lack of eye-specific segregation. Contra projections were visible in most of the dLGN area in WT; Dscam+/− mice but had primarily retracted from the ipsi area in WT; Dscam+/+ (Fig. 8g–l). The same phenotype was observed in adult Ms1Rhr mice carrying only one copy of the entire DSCR compared with wild-type controls (Fig. 8a–f). Overlay images confirmed a larger degree of intermingling of projections at the contra/ipsi border in adult Ms1Rhr mice (data not shown). Accordingly, the relative ipsi area overlapping with contra was significantly larger in WT; Dscam+/− and Ms1Rhr mice compared with the respective wild-type controls (Fig. 8s,t). A significant increase in the relative contra area was observed in WT; Dscam+/− animals, consistent with the contra projections covering most if not all of the dLGN (data not shown). Consistent with our results in adult Ts65Dn mice (Fig. 2), trisomic mice with three copies of Dscam (Ts65Dn; Dscam+/+) showed more segregation than wild-type controls (Fig. 8m–o). Reducing Dscam to two copies in the context of the full trisomy (Ts65Dn; Dscam+/−), however, did not rescue the wild-type phenotype (Fig. 8p–r,u). These data suggest that other genes in the trisomic region are necessary in addition to Dscam to generate the enhanced segregation phenotype.
To eliminate the influence of a large number of triplicated genes in Ts65Dn mice and to focus on the effect of Dscam dosage in the context of the DSCR, we crossed Ts1Rhr mice with heterozygous Dscam mutants to generate wild-type mice (WT; Dscam+/+), wild-type mice with only one copy of Dscam (WT; Dscam+/−), and DSCR trisomic mice with three (Ts1Rhr; Dscam+/+) or two (Ts1Rhr; Dscam+/−) copies of Dscam. Eye-specific segregation in the dLGN was then assessed at P10. Similar to our results in the adult Ts65Dn-Dscam cross, we observed that reducing Dscam dosage to one copy in wild-type animals inhibited eye-specific segregation (Fig. 8v). However, reducing Dscam to two copies in the context of a triplicated DSCR did not prevent the over-segregation phenotype (Fig. 8w). Interestingly, analysis with the threshold-independent method showed a trend toward a lower segregation index in Ts1Rhr mice with corrected Dscam levels (Ts1Rhr; Dscam+/−) compared with trisomic animals with three copies of Dscam (Ts1Rhr; Dscam+/+), which did not reach statistical significance (p = 0.19), suggesting that Dscam contributes to the phenotypes seen in trisomy. Together, these results indicate that, although Dscam plays a critical role in normal circuit refinement in the dLGN, additional triplicated genes in the DSCR function together with Dscam to enhance circuit refinement in the LGN.
Dscam shows gene-dosage-dependent effects in a subpopulation of RGCs
To further investigate how Dscam regulates neuronal circuit refinement, we assayed Dscam-expressing cell populations within the retina for Dscam dosage-dependent phenotypes (Fig. 9). Although several cell types, including cholinergic amacrine cells and smi-32-positive RGCs, showed no change in lamination or spacing when comparing wild-type, Dscam+/−, and Ts65Dn retinas (Fig. 9a–c), dendrite arborization and soma spacing of melanopsin-positive ipRGCs were highly sensitive to Dscam dosage (Fig. 9d–l). ipRGCs are a heterogenous population of cells, and, in Dscam+/+ controls, ipRGC somata are distributed across the RGC layer of the retina with very little fasciculation of their dendrites (Fig. 9d). We observed fascicles in 4 of 12 retinas, with seven sets of fasciculated cells (Fig. 9g). Increased gene dosage of Dscam as present in (Ts65Dn) mice prevented dendrite fasciculation entirely (Fig. 9e,h). We observed no fascicles in 18 retinas examined, and this result was statistically different from wild-type mice. Importantly, reducing Dscam to wild-type levels in the context of trisomy of all the other genes in Ts65Dn; Dscam+/− mice brought the degree of fasciculation back to wild-type levels (Fig. 9f,i). We observed fascicles in 6 of 14 retinas, with 11 sets of fasciculated cells, which was statistically different from Ts65Dn mice.
Figure 9.
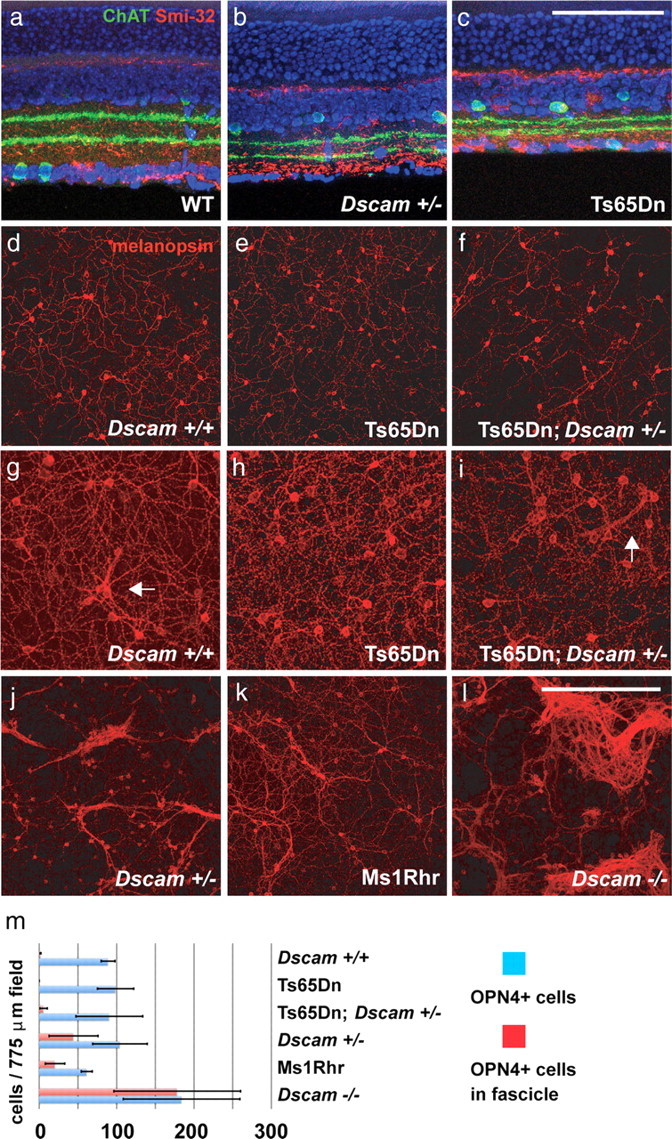
Fasciculation of intrinsically photoresponsive RGCs is sensitive to increase and decrease in Dscam dosage. a–c, Cholinergic amacrine cells and α-RGC lamination in WT, Dscam+/−, and Ts65Dn retinas. Sections of retina were stained with antibodies to ChAT to label cholinergic amacrine cells and Smi-32 to label α-RGCs. No significant difference was observed when comparing the lamination of neurites in the inner plexiform layer. Scale bar (in c), 146 μm. d–l, Whole retinas stained with an antibody to melanopsin to label ipRGCs. d–f, ipRGCs in Dscam+/+ (n > 3), Ts65Dn (n > 3), and retinas from Ts65Dn mice carrying a single mutant allele of Dscam (Ts65Dn; Dscam+/−; n > 3). Little or no fasciculation of ipRGCs was observed in these retinas. g, Occasionally, isolated instances of fasciculation were observed in the Dscam+/+ retina (n = 12). h, This limited fasciculation was never observed in the retinas of Ts65Dn littermates (n = 18). i, Ts65Dn; Dscam+/− mice (n = 14) have a degree of fasciculation similar to what is observed in Dscam+/+ littermate controls. j–l, Retinas from mice carrying one or two Dscam null alleles have a dramatic level of dendrite fasciculation. j, ipRGCs within the retina of a Dscam+/− mouse (n > 3). k, ipRGCs within the retina of a mouse carrying one copy of the DSCR (Ms1Rhr; n > 3). l, ipRGCs within the retina of a Dscam−/− mouse (n > 3). The total number of fasciculation events were counted in each retina and used to perform a two-tailed t tests (Dscam+/+ vs Ts65Dn, p = 0.018; Ts65Dn vs Ts65Dn; Dscam+/−, p = 0.003; and Dscam+/+ vs Ts65Dn; Dscam+/−, p = 0.62). Scale bar (in l): d–f, j–l, 387.5 μm; g–i, 193.75 μm. m, Number of ipRGCs and number of fasciculated ipRGCs counted in representative fields from each genotype in d–l (n = 3).
Conversely, reducing the gene dosage of Dscam to one copy in the heterozygous mutants (Dscam+/−) led to a dramatic increase in fasciculation of dendrites in every retina examined (Fig. 9j). Fasciculation was most prominent in the peripheral retina, and a significant fraction of ipRGC dendrites were incorporated into fascicles (Fig. 9j,m). Similar to the Dscam+/− heterozygous mutants, in Ms1Rhr mice, which carry one copy of the DSCR including Dscam, every retina examined showed extensive fasciculation of dendrites (Fig. 9k,m). In Dscam−/− null mutants, every retina showed almost complete fasciculation of dendrites, and extensive aggregation of cell bodies was observed (Fig. 9l,m). Together, the results suggest that wild-type levels of Dscam are necessary to prevent dendritic fasciculation of some RGCs, and this effect is sensitive to both increased and decreased Dscam gene dosage.
Discussion
In developmental intellectual disabilities such as DS, differences in neuronal circuit formation during development are likely to contribute to altered brain function later in life. Over the past decade, we have gained insight into mechanisms underlying deficits in the mature and aging nervous system by using the Ts65Dn mouse model of DS. Here, we report for the first time an effect of trisomy on developmental refinement of CNS circuits. Surprisingly, we observed that retinogeniculate refinement during development is markedly enhanced in the trisomic condition. Furthermore, it is regulated by the dosage of one or more genes in the so-called Down syndrome critical region, or DSCR (a genomic segment of ∼30 genes on human chromosome 21 and mouse chromosome 16), and these circuit changes persist into adulthood. The effects are not attributable to altered properties of spontaneous retinal waves arguing for a molecular cause. Our studies of Dscam indicate that it is a key regulator of circuit refinement in the LGN, yet it is not solely responsible for the altered segregation of retinal axons in mouse models of DS. In fact, our data indicate the DSCR must contain additional genes that contribute to visual system impairment in DS.
A critical role for the DSCR in developmental circuit refinement
In the past, triplication of the DSCR has been considered essential for the generation of the most salient features of DS, including craniofacial dysmorphology, congenital heart defects, and cognitive impairment (Korenberg et al., 1994; Barlow et al., 2001). A series of studies in mice by Roger Reeves and colleagues have elegantly shown that the triplication of the DSCR alone is not sufficient to generate craniofacial abnormalities (Olson et al., 2004), nor does it lead to reduced long-term potentiation in the CA1 area of the hippocampus or learning deficits in some behavioral tasks (Olson et al., 2007). Conversely, many of the anatomical and electrophysiological phenotypes observed in the dentate gyrus of Ts65Dn mice seem to be reproduced, although to a lesser degree, in Ts1Rhr mice (Belichenko et al., 2009). Our current study provides strong evidence that the copy number of several genes encoded by the DSCR contribute to normal circuit formation and maturation in the developing visual system, influencing the degree of segregation of axonal projections in the dLGN. This region also regulates the number of intestinal tumors in a gene-dosage-dependent manner (Sussan et al., 2008).
Dscam gene dosage and circuit refinement in the visual system
Circuit refinement in the developing visual system is regulated by both activity and activity-independent mechanisms (Huberman et al., 2008). The three families of molecules that have been identified as being involved in eye-specific refinement are immune system molecules: class I major histocompatibility complex genes (Huh et al., 2000), neuronal pentraxins (Bjartmar et al., 2006; Koch and Ullian, 2010), and components of the classical complement cascade (Stevens et al., 2007). Mutant mice lacking these immune molecules fail to undergo eye-specific segregation of retinal axons during development. In our study, the 1.5-fold overexpression of one or more genes on the DSCR (in Ts65Dn and Ts1Rhr mice) leads to a more pronounced segregation, whereas genetically reducing the DSCR to one copy (0.5-fold expression in Ms1Rhr mice) inhibits segregation. None of the abovementioned molecular players are located on chromosome 21 in humans or chromosome 16 in mice, suggesting that the DSCR contains new candidate genes responsible for the observed phenotype.
Table 1.
p values for temporal properties of spontaneous firing patterns for wild-type and Ts1Rhr retinas
| Mean firing rate | Percentage time bursting | Interburst interval | Burst duration | Firing rate during burst | |
|---|---|---|---|---|---|
| P5–P7 | 0.33 | 0.94 | 0.44 | 0.36 | 0.27 |
| P11–P13 | 0.03 | <0.01* | <0.01* | 0.11 | <0.01* |
*Significant difference.
Dscam, one of the 33 genes on the DSCR, is a neuronal cell adhesion molecule of the Ig superfamily shown to be involved in the formation of neuronal circuits in Drosophila (Hughes et al., 2007; Matthews et al., 2007; Millard et al., 2007; Soba et al., 2007), chickens (Yamagata and Sanes, 2008), and mice (Fuerst et al., 2008, 2009). Our study provides evidence that circuit refinement is sensitive to Dscam gene dosage. For example, the loss of one copy (Dscam+/− or Ms1Rhr) clearly leads to a defect in segregation of RGC axons in the LGN and to fasciculation of ipRGC dendrites in the retina, which account for 10% of RGCs during early postnatal development (Sekaran et al., 2005; Tu et al., 2005). The contribution of increased Dscam gene dosage to the trisomy phenotype is less definitive but is supported by the restoration of normal (wild-type) levels of ipRGC dendrite fasciculation in the trisomic retina with corrected Dscam copy number (Ts65Dn; Dscam+/−).
Possible mechanisms for enhanced eye-specific segregation in trisomic animals
The segregation of axons in the LGN requires normal waves of spontaneous activity in RGCs even before eye opening (Feller et al., 1996; Penn et al., 1998). This suggests that Ts65Dn and Ts1Rhr mice might have increased firing correlation in their RGCs, whereas Dscam+/− or Ms1Rhr mice have a decrease in correlated firing. Dscam could affect this activity-dependent pruning by influencing synaptic efficacy and trans-synaptic signaling, as suggested by recent results in Aplysia (Li et al., 2009). Our results reveal that the properties of cholinergic as well as glutamatergic spontaneous retinal waves are unaltered in Ts1Rhr mice, suggesting that circuit activity within the retina that normally drive circuit refinement in LGN is intact. This concept is supported by the results of altering waves with epibatidine, a condition which completely disrupts the segregation of retinogeniculate projections in Ts1Rhr mice. Together, these data make a strong case that, as during normal development, circuit activity in the trisomic visual system works in tandem with molecular cues, such as Dscam, in the segregation of retinal axons.
Although retinal waves appear normal in mouse models of DS, it is possible that more subtle changes in the anatomy (e.g., arborization retinal ganglion cells dendrites), cell number, or function of the retina could affect the refinement of axons in the LGN of trisomic mice. For example, in mice lacking CD3ζ, RGCs do not arborize normally and LGN segregation is impaired (Xu et al., 2010). Intriguingly, RGC dendrite arborization is Dscam dependent (Fuerst et al., 2008, 2009) and as shown here sensitive to Dscam dosage. This raises the possibility that Dscam-dependent retinal dendrite arborization could contribute to alteration in the refinement of retinal axons in the LGN.
In theory, changes in RGC number at early postnatal ages could also influence axon segregation by offsetting the normal balance of ipsi–contra competition. The Dscam loss-of-function allele does result in a decrease in developmental cell death in the retina (Fuerst et al., 2008, 2009; Huberman, 2009), and other genes in the DSCR such as Dyrk1A also affect cell number (Fotaki et al., 2002; Laguna et al., 2008). However, other mutations that more than double the number of RGCs do not alter eye-specific targeting (Yakura et al., 2002), making changes in RGC number unlikely to account for the phenotypes described here. Most importantly, we did not find evidence for significant changes in RGC numbers in P15 wild-type, Dscam heterozygous mutant mice, or trisomic mice in this study.
Dscam is also a netrin receptor and can function in axon guidance (Ly et al., 2008), suggesting another possible mechanism by which Dscam can facilitate LGN segregation, although no changes in RGC pathfinding out of the eye and to the dLGN were observed, despite the fact that netrin–DCC (deleted in colorectal cancer) signaling is critical for RGC axon pathfinding at the optic disk (Deiner et al., 1997). Given the known effects of Dscam on dendrite fasciculation in the retina (Fuerst et al., 2008, 2009), hypersegregated axons in trisomic mice could be attributable to enhanced fasciculation of RGC axons originating from the same eye.
Visual deficits in Down syndrome: a role for defective circuit refinement?
Ocular abnormalities (da Cunha and Moreira, 1996; Wong and Ho, 1997; Haugen and Høvding, 2001) and inaccurate accommodation (Woodhouse et al., 1996; Cregg et al., 2001) are more common in people with DS. Several studies, conversely, suggest that these ocular abnormalities do not entirely explain poor visual function. When using visual-evoked potentials and behavioral measures, visual acuity and contrast sensitivity were lower in children with DS even when children with ophthalmic anomalies were excluded (John et al., 2004; Suttle and Turner, 2004). Few reports address neuroanatomical abnormalities in the visual pathway in DS (Takashima et al., 1981). Becker et al. (1986) showed that dendritic arborization in the visual cortex of individuals with DS were greater than normal early in infancy but less than normal by the age of 2 years. This suggests that dendrites in the visual system of humans with DS might undergo developmental pruning stronger than seen in healthy individuals. In the Ts65Dn mouse model of DS, visual deficits were assessed by patterned visual-evoked potentials. Similar to humans with DS, deficits in spatial resolution, contrast threshold, and luminance threshold were reported (Scott-McKean et al., 2010). Together, our results imply that anatomical circuit changes may contribute to visual deficits seen in DS.
Footnotes
This work was supported by the Down Syndrome Research and Treatment Foundation (M.B. and C.C.G.), the Hillblom Foundation (M.B., C.C.G., and B.S.), the Coulter Foundation (C.C.G.), the Stanford SPARK program (C.C.G), the Stanford Center for Research and Treatment of Down Syndrome (M.B. and C.C.G.), National Eye Institute Grants EY018605 (R.W.B) and EY020857 (P.G.F.), the E. Matilda Ziegler Foundation for the Blind (A.D.H), and National Institutes of Health Grant DA15043 (B.A.B). We thank Dr. Roger Reeves (Johns Hopkins University, Baltimore, MD) for providing Ts1Rhr and Ms1Rhr mice and Dr. Ignacio Provencio (Uniformed Services University of the Health Sciences, Bethesda, MD) for the anti-melanopsin antibody.
The authors declare no competing financial interests.
References
- Barlow GM, Chen XN, Shi ZY, Lyons GE, Kurnit DM, Celle L, Spinner NB, Zackai E, Pettenati MJ, Van Riper AJ, Vekemans MJ, Mjaatvedt CH, Korenberg JR. Down syndrome congenital heart disease: a narrowed region and a candidate gene. Genet Med. 2001;3:91–101. doi: 10.1097/00125817-200103000-00002. [DOI] [PubMed] [Google Scholar]
- Barlow GM, Micales B, Chen XN, Lyons GE, Korenberg JR. Mammalian DSCAMs: roles in the development of the spinal cord, cortex, and cerebellum? Biochem Biophys Res Commun. 2002;293:881–891. doi: 10.1016/S0006-291X(02)00307-8. [DOI] [PubMed] [Google Scholar]
- Becker LE, Armstrong DL, Chan F. Dendritic atrophy in children with Down's syndrome. Ann Neurol. 1986;20:520–526. doi: 10.1002/ana.410200413. [DOI] [PubMed] [Google Scholar]
- Belichenko NP, Belichenko PV, Kleschevnikov AM, Salehi A, Reeves RH, Mobley WC. The “Down syndrome critical region” is sufficient in the mouse model to confer behavioral, neurophysiological, and synaptic phenotypes characteristic of Down syndrome. J Neurosci. 2009;29:5938–5948. doi: 10.1523/JNEUROSCI.1547-09.2009. [DOI] [PMC free article] [PubMed] [Google Scholar]
- Bjartmar L, Huberman AD, Ullian EM, Rentería RC, Liu X, Xu W, Prezioso J, Susman MW, Stellwagen D, Stokes CC, Cho R, Worley P, Malenka RC, Ball S, Peachey NS, Copenhagen D, Chapman B, Nakamoto M, Barres BA, Perin MS. Neuronal pentraxins mediate synaptic refinement in the developing visual system. J Neurosci. 2006;26:6269–6281. doi: 10.1523/JNEUROSCI.4212-05.2006. [DOI] [PMC free article] [PubMed] [Google Scholar]
- Costa AC, Grybko MJ. Deficits in hippocampal CA1 LTP induced by TBS but not HFS in the Ts65Dn mouse: a model of Down syndrome. Neurosci Lett. 2005;382:317–322. doi: 10.1016/j.neulet.2005.03.031. [DOI] [PubMed] [Google Scholar]
- Coyle JT, Oster-Granite ML, Gearhart JD. The neurobiologic consequences of Down syndrome. Brain Res Bull. 1986;16:773–787. doi: 10.1016/0361-9230(86)90074-2. [DOI] [PubMed] [Google Scholar]
- Cregg M, Woodhouse JM, Pakeman VH, Saunders KJ, Gunter HL, Parker M, Fraser WI, Sastry P. Accommodation and refractive error in children with Down syndrome: cross-sectional and longitudinal studies. Invest Ophthalmol Vis Sci. 2001;42:55–63. [PubMed] [Google Scholar]
- da Cunha RP, Moreira JB. Ocular findings in Down's syndrome. Am J Ophthalmol. 1996;122:236–244. doi: 10.1016/s0002-9394(14)72015-x. [DOI] [PubMed] [Google Scholar]
- Davisson MT, Schmidt C, Reeves RH, Irving NG, Akeson EC, Harris BS, Bronson RT. Segmental trisomy as a mouse model for Down syndrome. Prog Clin Biol Res. 1993;384:117–133. [PubMed] [Google Scholar]
- Deiner MS, Kennedy TE, Fazeli A, Serafini T, Tessier-Lavigne M, Sretavan DW. Netrin-1 and DCC mediate axon guidance locally at the optic disc: loss of function leads to optic nerve hypoplasia. Neuron. 1997;19:575–589. doi: 10.1016/s0896-6273(00)80373-6. [DOI] [PubMed] [Google Scholar]
- Feller MB, Wellis DP, Stellwagen D, Werblin FS, Shatz CJ. Requirement for cholinergic synaptic transmission in the propagation of spontaneous retinal waves. Science. 1996;272:1182–1187. doi: 10.1126/science.272.5265.1182. [DOI] [PubMed] [Google Scholar]
- Fernandez F, Morishita W, Zuniga E, Nguyen J, Blank M, Malenka RC, Garner CC. Pharmacotherapy for cognitive impairment in a mouse model of Down syndrome. Nat Neurosci. 2007;10:411–413. doi: 10.1038/nn1860. [DOI] [PubMed] [Google Scholar]
- Fotaki V, Dierssen M, Alcántara S, Martínez S, Martí E, Casas C, Visa J, Soriano E, Estivill X, Arbonés ML. Dyrk1A haploinsufficiency affects viability and causes developmental delay and abnormal brain morphology in mice. Mol Cell Biol. 2002;22:6636–6647. doi: 10.1128/MCB.22.18.6636-6647.2002. [DOI] [PMC free article] [PubMed] [Google Scholar]
- Fuerst PG, Koizumi A, Masland RH, Burgess RW. Neurite arborization and mosaic spacing in the mouse retina require DSCAM. Nature. 2008;451:470–474. doi: 10.1038/nature06514. [DOI] [PMC free article] [PubMed] [Google Scholar]
- Fuerst PG, Bruce F, Tian M, Wei W, Elstrott J, Feller MB, Erskine L, Singer JH, Burgess RW. DSCAM and DSCAML1 function in self-avoidance in multiple cell types in the developing mouse retina. Neuron. 2009;64:484–497. doi: 10.1016/j.neuron.2009.09.027. [DOI] [PMC free article] [PubMed] [Google Scholar]
- Gardiner K, Fortna A, Bechtel L, Davisson MT. Mouse models of Down syndrome: how useful can they be? Comparison of the gene content of human chromosome 21 with orthologous mouse genomic regions. Gene. 2003;318:137–147. doi: 10.1016/s0378-1119(03)00769-8. [DOI] [PubMed] [Google Scholar]
- Godement P, Salaün J, Imbert M. Prenatal and postnatal development of retinogeniculate and retinocollicular projections in the mouse. J Comp Neurol. 1984;230:552–575. doi: 10.1002/cne.902300406. [DOI] [PubMed] [Google Scholar]
- Hanson JE, Blank M, Valenzuela RA, Garner CC, Madison DV. The functional nature of synaptic circuitry is altered in area CA3 of the hippocampus in a mouse model of Down's syndrome. J Physiol. 2007;579:53–67. doi: 10.1113/jphysiol.2006.114868. [DOI] [PMC free article] [PubMed] [Google Scholar]
- Haugen OH, Høvding G. Strabismus and binocular function in children with Down syndrome. A population-based, longitudinal study. Acta Ophthalmol Scand. 2001;79:133–139. doi: 10.1034/j.1600-0420.2001.079002133.x. [DOI] [PubMed] [Google Scholar]
- Hevner RF. Development of connections in the human visual system during fetal mid-gestation: a DiI-tracing study. J Neuropathol Exp Neurol. 2000;59:385–392. doi: 10.1093/jnen/59.5.385. [DOI] [PubMed] [Google Scholar]
- Hooks BM, Chen C. Distinct roles for spontaneous and visual activity in remodeling of the retinogeniculate synapse. Neuron. 2006;52:281–291. doi: 10.1016/j.neuron.2006.07.007. [DOI] [PubMed] [Google Scholar]
- Huberman AD. Mechanisms of eye-specific visual circuit development. Curr Opin Neurobiol. 2007;17:73–80. doi: 10.1016/j.conb.2007.01.005. [DOI] [PubMed] [Google Scholar]
- Huberman AD. Mammalian DSCAMs: they won't help you find a partner, but they'll guarantee you some personal space. Neuron. 2009;64:441–443. doi: 10.1016/j.neuron.2009.11.011. [DOI] [PubMed] [Google Scholar]
- Huberman AD, Murray KD, Warland DK, Feldheim DA, Chapman B. Ephrin-As mediate targeting of eye-specific projections to the lateral geniculate nucleus. Nat Neurosci. 2005;8:1013–1021. doi: 10.1038/nn1505. [DOI] [PMC free article] [PubMed] [Google Scholar]
- Huberman AD, Feller MB, Chapman B. Mechanisms underlying development of visual maps and receptive fields. Annu Rev Neurosci. 2008;31:479–509. doi: 10.1146/annurev.neuro.31.060407.125533. [DOI] [PMC free article] [PubMed] [Google Scholar]
- Hughes ME, Bortnick R, Tsubouchi A, Bäumer P, Kondo M, Uemura T, Schmucker D. Homophilic Dscam interactions control complex dendrite morphogenesis. Neuron. 2007;54:417–427. doi: 10.1016/j.neuron.2007.04.013. [DOI] [PMC free article] [PubMed] [Google Scholar]
- Huh GS, Boulanger LM, Du H, Riquelme PA, Brotz TM, Shatz CJ. Functional requirement for class I MHC in CNS development and plasticity. Science. 2000;290:2155–2159. doi: 10.1126/science.290.5499.2155. [DOI] [PMC free article] [PubMed] [Google Scholar]
- Jaubert-Miazza L, Green E, Lo FS, Bui K, Mills J, Guido W. Structural and functional composition of the developing retinogeniculate pathway in the mouse. Vis Neurosci. 2005;22:661–676. doi: 10.1017/S0952523805225154. [DOI] [PubMed] [Google Scholar]
- John FM, Bromham NR, Woodhouse JM, Candy TR. Spatial vision deficits in infants and children with Down syndrome. Invest Ophthalmol Vis Sci. 2004;45:1566–1572. doi: 10.1167/iovs.03-0951. [DOI] [PubMed] [Google Scholar]
- Katz LC, Shatz CJ. Synaptic activity and the construction of cortical circuits. Science. 1996;274:1133–1138. doi: 10.1126/science.274.5290.1133. [DOI] [PubMed] [Google Scholar]
- Kleschevnikov AM, Belichenko PV, Villar AJ, Epstein CJ, Malenka RC, Mobley WC. Hippocampal long-term potentiation suppressed by increased inhibition in the Ts65Dn mouse, a genetic model of Down syndrome. J Neurosci. 2004;24:8153–8160. doi: 10.1523/JNEUROSCI.1766-04.2004. [DOI] [PMC free article] [PubMed] [Google Scholar]
- Koch SM, Ullian EM. Neuronal pentraxins mediate silent synapse conversion in the developing visual system. J Neurosci. 2010;30:5404–5414. doi: 10.1523/JNEUROSCI.4893-09.2010. [DOI] [PMC free article] [PubMed] [Google Scholar]
- Korenberg JR, Chen XN, Schipper R, Sun Z, Gonsky R, Gerwehr S, Carpenter N, Daumer C, Dignan P, Disteche C, Graham JM, Jr, Hugdins L, McGillivray B, Miyazaki K, Ogasawara N, Park JP, Pagon R, Pueschel S, Sack G, Say B, et al. Down syndrome phenotypes: the consequences of chromosomal imbalance. Proc Natl Acad Sci U S A. 1994;91:4997–5001. doi: 10.1073/pnas.91.11.4997. [DOI] [PMC free article] [PubMed] [Google Scholar]
- Laguna A, Aranda S, Barallobre MJ, Barhoum R, Fernández E, Fotaki V, Delabar JM, de la Luna S, de la Villa P, Arbonés ML. The protein kinase DYRK1A regulates caspase-9-mediated apoptosis during retina development. Dev Cell. 2008;15:841–853. doi: 10.1016/j.devcel.2008.10.014. [DOI] [PubMed] [Google Scholar]
- Li HL, Huang BS, Vishwasrao H, Sutedja N, Chen W, Jin I, Hawkins RD, Bailey CH, Kandel ER. Dscam mediates remodeling of glutamate receptors in Aplysia during de novo and learning-related synapse formation. Neuron. 2009;61:527–540. doi: 10.1016/j.neuron.2009.01.010. [DOI] [PMC free article] [PubMed] [Google Scholar]
- Liu DP, Schmidt C, Billings T, Davisson MT. Quantitative PCR genotyping assay for the Ts65Dn mouse model of Down syndrome. Biotechniques. 2003;35:1170–1174. 1176, 1178. doi: 10.2144/03356st02. passim. [DOI] [PubMed] [Google Scholar]
- Ly A, Nikolaev A, Suresh G, Zheng Y, Tessier-Lavigne M, Stein E. DSCAM is a netrin receptor that collaborates with DCC in mediating turning responses to netrin-1. Cell. 2008;133:1241–1254. doi: 10.1016/j.cell.2008.05.030. [DOI] [PMC free article] [PubMed] [Google Scholar]
- Marin-Padilla M. Pyramidal cell abnormalities in the motor cortex of a child with Down's syndrome. A Golgi study. J Comp Neurol. 1976;167:63–81. doi: 10.1002/cne.901670105. [DOI] [PubMed] [Google Scholar]
- Matthews BJ, Kim ME, Flanagan JJ, Hattori D, Clemens JC, Zipursky SL, Grueber WB. Dendrite self-avoidance is controlled by Dscam. Cell. 2007;129:593–604. doi: 10.1016/j.cell.2007.04.013. [DOI] [PubMed] [Google Scholar]
- McLaughlin T, O'Leary DD. Molecular gradients and development of retinotopic maps. Annu Rev Neurosci. 2005;28:327–355. doi: 10.1146/annurev.neuro.28.061604.135714. [DOI] [PubMed] [Google Scholar]
- Meister M, Wong RO, Baylor DA, Shatz CJ. Synchronous bursts of action potentials in ganglion cells of the developing mammalian retina. Science. 1991;252:939–943. doi: 10.1126/science.2035024. [DOI] [PubMed] [Google Scholar]
- Millard SS, Flanagan JJ, Pappu KS, Wu W, Zipursky SL. Dscam2 mediates axonal tiling in the Drosophila visual system. Nature. 2007;447:720–724. doi: 10.1038/nature05855. [DOI] [PMC free article] [PubMed] [Google Scholar]
- Muir-Robinson G, Hwang BJ, Feller MB. Retinogeniculate axons undergo eye-specific segregation in the absence of eye-specific layers. J Neurosci. 2002;22:5259–5264. doi: 10.1523/JNEUROSCI.22-13-05259.2002. [DOI] [PMC free article] [PubMed] [Google Scholar]
- Nadel L. Down's syndrome: a genetic disorder in biobehavioral perspective. Genes Brain Behav. 2003;2:156–166. doi: 10.1034/j.1601-183x.2003.00026.x. [DOI] [PubMed] [Google Scholar]
- Olson LE, Richtsmeier JT, Leszl J, Reeves RH. A chromosome 21 critical region does not cause specific Down syndrome phenotypes. Science. 2004;306:687–690. doi: 10.1126/science.1098992. [DOI] [PMC free article] [PubMed] [Google Scholar]
- Olson LE, Roper RJ, Sengstaken CL, Peterson EA, Aquino V, Galdzicki Z, Siarey R, Pletnikov M, Moran TH, Reeves RH. Trisomy for the Down syndrome “critical region” is necessary but not sufficient for brain phenotypes of trisomic mice. Hum Mol Genet. 2007;16:774–782. doi: 10.1093/hmg/ddm022. [DOI] [PubMed] [Google Scholar]
- Penn AA, Riquelme PA, Feller MB, Shatz CJ. Competition in retinogeniculate patterning driven by spontaneous activity. Science. 1998;279:2108–2112. doi: 10.1126/science.279.5359.2108. [DOI] [PubMed] [Google Scholar]
- Pfeiffenberger C, Cutforth T, Woods G, Yamada J, Rentería RC, Copenhagen DR, Flanagan JG, Feldheim DA. Ephrin-As and neural activity are required for eye-specific patterning during retinogeniculate mapping. Nat Neurosci. 2005;8:1022–1027. doi: 10.1038/nn1508. [DOI] [PMC free article] [PubMed] [Google Scholar]
- Pulsifer MB. The neuropsychology of mental retardation. J Int Neuropsychol Soc. 1996;2:159–176. doi: 10.1017/s1355617700001016. [DOI] [PubMed] [Google Scholar]
- Rossi FM, Pizzorusso T, Porciatti V, Marubio LM, Maffei L, Changeux JP. Requirement of the nicotinic acetylcholine receptor beta 2 subunit for the anatomical and functional development of the visual system. Proc Natl Acad Sci U S A. 2001;98:6453–6458. doi: 10.1073/pnas.101120998. [DOI] [PMC free article] [PubMed] [Google Scholar]
- Schmidt-Sidor B, Wisniewski KE, Shepard TH, Sersen EA. Brain growth in Down syndrome subjects 15 to 22 weeks of gestational age and birth to 60 months. Clin Neuropathol. 1990;9:181–190. [PubMed] [Google Scholar]
- Scott-McKean JJ, Chang B, Hurd RE, Nusinowitz S, Schmidt C, Davisson MT, Costa AC. The mouse model of Down syndrome Ts65Dn presents visual deficits as assessed by pattern visual evoked potentials. Invest Ophthalmol Vis Sci. 2010;51:3300–3308. doi: 10.1167/iovs.09-4465. [DOI] [PMC free article] [PubMed] [Google Scholar]
- Sekaran S, Lupi D, Jones SL, Sheely CJ, Hattar S, Yau KW, Lucas RJ, Foster RG, Hankins MW. Melanopsin-dependent photoreception provides earliest light detection in the mammalian retina. Curr Biol. 2005;15:1099–1107. doi: 10.1016/j.cub.2005.05.053. [DOI] [PMC free article] [PubMed] [Google Scholar]
- Siarey RJ, Stoll J, Rapoport SI, Galdzicki Z. Altered long-term potentiation in the young and old Ts65Dn mouse, a model for Down Syndrome. Neuropharmacology. 1997;36:1549–1554. doi: 10.1016/s0028-3908(97)00157-3. [DOI] [PubMed] [Google Scholar]
- Siarey RJ, Carlson EJ, Epstein CJ, Balbo A, Rapoport SI, Galdzicki Z. Increased synaptic depression in the Ts65Dn mouse, a model for mental retardation in Down syndrome. Neuropharmacology. 1999;38:1917–1920. doi: 10.1016/s0028-3908(99)00083-0. [DOI] [PubMed] [Google Scholar]
- Siarey RJ, Villar AJ, Epstein CJ, Galdzicki Z. Abnormal synaptic plasticity in the Ts1Cje segmental trisomy 16 mouse model of Down syndrome. Neuropharmacology. 2005;49:122–128. doi: 10.1016/j.neuropharm.2005.02.012. [DOI] [PubMed] [Google Scholar]
- Soba P, Zhu S, Emoto K, Younger S, Yang SJ, Yu HH, Lee T, Jan LY, Jan YN. Drosophila sensory neurons require Dscam for dendritic self-avoidance and proper dendritic field organization. Neuron. 2007;54:403–416. doi: 10.1016/j.neuron.2007.03.029. [DOI] [PMC free article] [PubMed] [Google Scholar]
- Stevens B, Allen NJ, Vazquez LE, Howell GR, Christopherson KS, Nouri N, Micheva KD, Mehalow AK, Huberman AD, Stafford B, Sher A, Litke AM, Lambris JD, Smith SJ, John SW, Barres BA. The classical complement cascade mediates CNS synapse elimination. Cell. 2007;131:1164–1178. doi: 10.1016/j.cell.2007.10.036. [DOI] [PubMed] [Google Scholar]
- Sun C, Speer CM, Wang GY, Chapman B, Chalupa LM. Epibatidine application in vitro blocks retinal waves without silencing all retinal ganglion cell action potentials in developing retina of the mouse and ferret. J Neurophysiol. 2008;100:3253–3263. doi: 10.1152/jn.90303.2008. [DOI] [PMC free article] [PubMed] [Google Scholar]
- Sussan TE, Yang A, Li F, Ostrowski MC, Reeves RH. Trisomy represses Apc(Min)-mediated tumours in mouse models of Down's syndrome. Nature. 2008;451:73–75. doi: 10.1038/nature06446. [DOI] [PubMed] [Google Scholar]
- Suttle CM, Turner AM. Transient pattern visual evoked potentials in children with Down's syndrome. Ophthalmic Physiol Opt. 2004;24:91–99. doi: 10.1046/j.1475-1313.2003.00174.x. [DOI] [PubMed] [Google Scholar]
- Takashima S, Becker LE, Armstrong DL, Chan F. Abnormal neuronal development in the visual cortex of the human fetus and infant with down's syndrome. A quantitative and qualitative Golgi study. Brain Res. 1981;225:1–21. doi: 10.1016/0006-8993(81)90314-0. [DOI] [PubMed] [Google Scholar]
- Torborg CL, Feller MB. Unbiased analysis of bulk axonal segregation patterns. J Neurosci Methods. 2004;135:17–26. doi: 10.1016/j.jneumeth.2003.11.019. [DOI] [PubMed] [Google Scholar]
- Torborg CL, Feller MB. Spontaneous patterned retinal activity and the refinement of retinal projections. Prog Neurobiol. 2005;76:213–235. doi: 10.1016/j.pneurobio.2005.09.002. [DOI] [PubMed] [Google Scholar]
- Torborg CL, Hansen KA, Feller MB. High frequency, synchronized bursting drives eye-specific segregation of retinogeniculate projections. Nat Neurosci. 2005;8:72–78. doi: 10.1038/nn1376. [DOI] [PMC free article] [PubMed] [Google Scholar]
- Tu DC, Zhang D, Demas J, Slutsky EB, Provencio I, Holy TE, Van Gelder RN. Physiologic diversity and development of intrinsically photosensitive retinal ganglion cells. Neuron. 2005;48:987–999. doi: 10.1016/j.neuron.2005.09.031. [DOI] [PubMed] [Google Scholar]
- Wong RO, Meister M, Shatz CJ. Transient period of correlated bursting activity during development of the mammalian retina. Neuron. 1993;11:923–938. doi: 10.1016/0896-6273(93)90122-8. [DOI] [PubMed] [Google Scholar]
- Wong V, Ho D. Ocular abnormalities in Down syndrome: an analysis of 140 Chinese children. Pediatr Neurol. 1997;16:311–314. doi: 10.1016/s0887-8994(97)00029-5. [DOI] [PubMed] [Google Scholar]
- Woodhouse JM, Pakeman VH, Saunders KJ, Parker M, Fraser WI, Lobo S, Sastry P. Visual acuity and accommodation in infants and young children with Down's syndrome. J Intellect Disabil Res. 1996;40:49–55. doi: 10.1111/j.1365-2788.1996.tb00602.x. [DOI] [PubMed] [Google Scholar]
- Xu HP, Chen H, Ding Q, Xie ZH, Chen L, Diao L, Wang P, Gan L, Crair MC, Tian N. The immune protein CD3zeta is required for normal development of neural circuits in the retina. Neuron. 2010;65:503–515. doi: 10.1016/j.neuron.2010.01.035. [DOI] [PMC free article] [PubMed] [Google Scholar]
- Yakura T, Fukuda Y, Sawai H. Effect of Bcl-2 overexpression on establishment of ipsilateral retinocollicular projection in mice. Neuroscience. 2002;110:667–673. doi: 10.1016/s0306-4522(01)00610-8. [DOI] [PubMed] [Google Scholar]
- Yamagata M, Sanes JR. Dscam and Sidekick proteins direct lamina-specific synaptic connections in vertebrate retina. Nature. 2008;451:465–469. doi: 10.1038/nature06469. [DOI] [PubMed] [Google Scholar]
- Zhang LI, Poo MM. Electrical activity and development of neural circuits. Nat Neurosci [Suppl] 2001;4:1207–1214. doi: 10.1038/nn753. [DOI] [PubMed] [Google Scholar]
- Ziburkus J, Guido W. Loss of binocular responses and reduced retinal convergence during the period of retinogeniculate axon segregation. J Neurophysiol. 2006;96:2775–2784. doi: 10.1152/jn.01321.2004. [DOI] [PubMed] [Google Scholar]