Abstract
Purpose: To evaluate the image quality of virtual monochromatic images synthesized from dual-source dual-energy computed tomography (CT) in comparison with conventional polychromatic single-energy CT for the same radiation dose.
Methods: In dual-energy CT, besides the material-specific information, one may also synthesize monochromatic images at different energies, which can be used for routine diagnosis similar to conventional polychromatic single-energy images. In this work, the authors assessed whether virtual monochromatic images generated from dual-source CT scanners had an image quality similar to that of polychromatic single-energy images for the same radiation dose. First, the authors provided a theoretical analysis of the optimal monochromatic energy for either the minimum noise level or the highest iodine contrast to noise ratio (CNR) for a given patient size and dose partitioning between the low- and high-energy scans. Second, the authors performed an experimental study on a dual-source CT scanner to evaluate the noise and iodine CNR in monochromatic images. A thoracic phantom with three sizes of attenuating rings was used to represent four adult sizes. For each phantom size, three dose partitionings between the low-energy (80 kV) and the high-energy (140 kV) scans were used in the dual-energy scan. Monochromatic images at eight energies (40 to 110 keV) were generated for each scan. Phantoms were also scanned at each of the four polychromatic single energy (80, 100, 120, and 140 kV) with the same radiation dose.
Results: The optimal virtual monochromatic energy depends on several factors: phantom size, partitioning of the radiation dose between low- and high-energy scans, and the image quality metrics to be optimized. With the increase of phantom size, the optimal monochromatic energy increased. With the increased percentage of radiation dose on the low energy scan, the optimal monochromatic energy decreased. When maximizing the iodine CNR in monochromatic images, the optimal energy was lower than that when minimizing noise level. When the total radiation dose was equally distributed between low and high energy in dual-energy scans, for minimum noise, the optimal energies were 68, 71, 74, and 77 keV for small, medium, large, and extra-large (xlarge) phantoms, respectively; for maximum iodine CNR, the optimal energies were 66, 68, 70, 72 keV. With the optimal monochromatic energy, the noise level was similar to and the CNR was better than that in a single-energy scan at 120 kV for the same radiation dose. Compared to an 80 kV scan, however, the iodine CNR in monochromatic images was lower for the small, medium, and large phantoms.
Conclusions: In dual-source dual-energy CT, optimal virtual monochromatic energy depends on patient size, dose partitioning, and the image quality metric optimized. With the optimal monochromatic energy, the noise level was similar to and the iodine CNR was better than that in 120 kV images for the same radiation dose. Compared to single-energy 80 kV images, the iodine CNR in virtual monochromatic images was lower for small to large phantom sizes.
Keywords: computed tomography, dual-energy CT, monochromatic CT, dual-source CT, image quality, radiation dose
INTRODUCTION
In dual-energy computed tomography (CT), besides obtaining material-specific information,1, 2, 3 it is necessary to generate a single set of images that can be used as the basis for routine diagnosis, similar to conventional polychromatic single-energy CT images.4, 5, 6, 7, 8 In order to fully utilize the radiation dose and optimize the image quality, such a single set of images should be a combination of the low- and high-energy data acquired in the dual-energy scan. One common approach to generating a single set of images for routine diagnosis is to linearly mix the low- and high-energy images after image reconstruction.6, 7, 8
Another approach to generating such a single set of images is to synthesize virtual monochromatic images using dual-energy projection data. This approach was described in the original work by Alvarez and Macovski,1 which involves a basis material decomposition in the projection domain and a linear combination of the density maps of the basis materials in the image domain. In principle, such a process can remove beam-hardening artifacts and provide quantitative information on the imaged anatomy.9 Reduced beam-hardening artifacts are considered one of the main benefits of monochromatic dual-energy CT images.1, 10
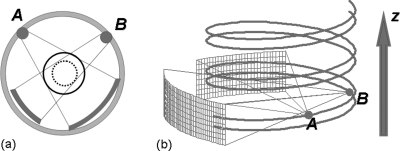
Dual-source CT scanners, with two source-detector systems, are currently used for many clinical dual-energy applications,3, 4, 11 including automatic bone removal,3 stone composition characterization,12, 13, 14 virtual noncontrast imaging,15 and diagnosis of gout.16 However, in helical mode, the projection data collected by the two source-detector systems are in a double-helix geometry in which the two helical trajectories have an approximately 90° phase difference and the projections from the low- and high-energy scans are not coincident with each other (Fig. 1). Because of this, it is challenging to perform dual-energy processing in the projection domain. Iterative methods have been proposed to solve this problem, though have not been implemented in practice.17 All current dual-energy processing methods available on dual-source CT scanners are based upon the low- and high-energy images after reconstruction.
Figure 1.
(a) Dual-source CT geometry. (b) A double helix trajectory formed by a helical scan in a dual-source geometry. Because the projection data from source A and source B are never coincident with each other during the helical scan, it is difficult to perform a dual-energy processing in projection data domain. This is one of the reasons why the monochromatic images are currently generated in image space for dual-source CT.
Using the dual-energy images after reconstruction, it is still possible to create virtual monochromatic images at different energies. Although single-energy based beam hardening correction techniques are usually applied to the low- and high-energy images prior to creating monochromatic images, those correction techniques are not perfect. Even with some advanced iterative beam hardening correction methods, residue artifacts may still exist after correction when the exact knowledge of the physical model (spectrum, detector, materials) is not available.18 Therefore, virtual monochromatic images created in the image domain may still contain beam hardening artifacts propagated from the low- and high-energy images when there is imperfect correction. The purpose of creating monochromatic images in the image domain is not primarily to eliminate beam-hardening artifacts but to generate a single optimized set of images for routine diagnosis. Either the contrast, noise, or contrast to noise ratio (CNR) can be optimized by careful selection of the virtual monochromatic energy, the choice of which depends on the required diagnostic task.
There are two important questions to answer for using monochromatic images in dual-source dual-energy CT. First, what is the optimal monochromatic energy for maximizing contrast, minimizing noise, or maximizing CNR? Second, how does the quality of virtual monochromatic images compare with conventional single-energy CT images acquired with polychromatic x-ray beams and the same radiation dose? If the image quality is the same or better, then monochromatic images can be used as the basis for routine diagnosis without requiring more radiation dose.
The purpose of this work is to provide a theoretical framework and phantom study to answer the above two questions. We first provide a link between linearly mixed images and the monochromatic images synthesized from dual-energy scans. This link demonstrates that the optimal monochromatic energy, corresponding to an optimal weighting factor for the low-energy image, exists for either minimizing noise or maximizing iodine CNR. We perform a phantom study on a dual-source CT scanner to show that the optimal monochromatic energy depends on patient size, radiation dose partitioning, and the image quality metric to be optimized, as predicted by theoretical analysis. Finally, we compare image quality from conventional polychromatic single-energy CT scans at different tube potentials to optimized virtual monochromatic images acquired using the same radiation dose level.
METHODS
Image-based monochromatic imaging
In principle, monochromatic images are created in the projection domain where x-ray spectra and detector response can be incorporated and the beam hardening effect can be inherently reduced. As explained in the Introduction, it is challenging to perform dual-energy processing in the projection domain for dual-source CT data acquired in a helical mode. Despite that, one can still approximately create virtual monochromatic images based on reconstructed low- and high-energy images. Assuming the effective mass attenuation coefficients of the two basis materials at low and high-energy scans are , j=L,H, i=1,2, the linear attenuation coefficients at low- and high-energy scans after image reconstruction can be expressed as a linear combination of the effective mass attenuation coefficients of the two basis materials9, 19
| (1) |
where “L” and “H” represent low- and high-energy, respectively and “1” and “2” represent the two basis materials. Solving the two linear equations, one obtains the mass density of the two basis materials
| (2a) |
| (2b) |
The monochromatic image at energy E is given by
| (3) |
Rewriting the linear attenuation coefficients in Eq. 3 in terms of CT number and assuming one of the basis material is water, one can show that the monochromatic image at energy E can be expressed as a weighted average of the images at low- and high-energy scans, which is given by
| (4) |
where the weighting factor is given by
| (5) |
Thus, the monochromatic image generated from image space data is simply a linear combination of the two CT images at low and high energies, where the sum of the two weighting factors equals 1.
Optimal monochromatic energy for CNR and noise
An optimal monochromatic energy exists that yields either the highest CNR or the lowest noise in the monochromatic image. We define the standard deviations of CT numbers in the background and signal regions for low- and high-energy images as σj,b, and σj,s, j=L,H. The contrast (the absolute difference of the CT numbers between the signal region and background region) for the low- and high-energy images is denoted by Cj (j=L,H). As shown in our previous work,6 the weighting factor for the lowest background noise level in the linearly mixed image is given by
| (6) |
and the weighting factor for the highest CNR in the linearly mixed image is given by
| (7) |
The optimal weighting factor for either the lowest noise [Eq. 6] or the highest CNR [Eq. 7] corresponds to an optimal monochromatic energy, which can be obtained by solving the equation of either
| (8) |
for the minimum noise, or
| (9) |
for the maximum CNR. Applying Eqs. 5, 6 in Eq. 8 and assuming the noise level in background and signal regions is the same: σj,s=σj,b=σj (j=L,H), the optimal monochromatic energy for the minimum noise satisfies
| (10) |
Applying Eqs. 5, 7 in Eq. 9, the optimal monochromatic energy for the maximum CNR satisfies
| (11) |
As can be seen from Eqs. 10, 11, the optimal monochromatic energy depends on the noise levels of the low- and high-energy images, which are subsequently determined by the patient size and the dose partitioning between low- and high-energy scans for a given total radiation dose. For maximizing CNR, the optimal energy also depends on the contrast ratio between high and low-energy images. Using the measured noise and contrast at low- and high-energy images, one can readily predict the optimal monochromatic energy for minimizing noise or maximizing CNR.
Experimental study
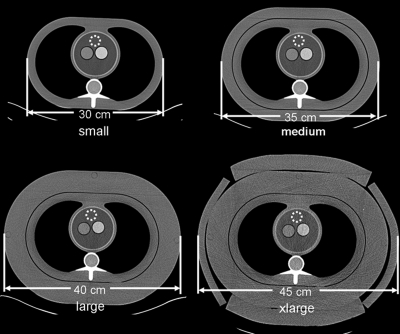
The experimental setup is similar to that described in our previous work.6 A semi-anthropomorphic thoracic phantom (Cardio CT, QRM, Moehrendorf, Germany) and three additional layers of attenuation were used to represent the thoracic region of small, medium, large, and xlarge adults (Fig. 2). Two of these layers were attenuating rings that fit securely around the thorax phantom. The final layer of attenuation was provided by tissue-equivalent bolus material (Superflab, Radiation Products Design, Albertville, MN). Two syringes, one with an iodine concentration of 3.5 mg/ml and the other with 7.0 mg/ml, were placed in the cardiac region of the thorax phantoms to allow measurements of iodine signal within a water background.
Figure 2.
A semi-anthropomorphic thoracic phantom and three additional attenuation layers were used to represent the thoracic region of small, medium, large, and extra-large adults. Two syringes with an iodine concentration of 3.5 mg/ml and 7.0 mg/ml were placed in the water-filled cardiac regions of the phantoms. The dotted circle on each phantom represents the ROI where the background noise level was measured.
Both the dual-energy and single-energy scans were performed with a dual-source CT scanner (Definition, Siemens Healthcare, Forchheim, Germany). For the single-energy images, scans were acquired using one x-ray tube [50 cm field-of-view (FOV)]. For each phantom, four single-energy scans at 80 kV, 100 kV, 120 kV, and 140 kV were performed, each having the same radiation output, expressed by CTDIvol, as in a typical clinical protocol performed at 120 kV. Note that all the terms, radiation dose or dose, used in this article refer to the radiation output from the scanner, quantified by CTDIvol with a standard 32 cm CTDI phantom. Automatic exposure control (CAREDose4D, Siemens Healthcare, Forchheim, Germany) was turned on to allow for automatic tube current modulation along the z axis and angularly about the phantoms during each scan. The CTDIvol were 8.4 mGy, 13.0 mGy, 22.6 mGy, and 29.7 mGy for small, medium, large, and xlarge phantoms, respectively. Limited by the maximum tube current, the CTDIvol of the 80 kV single-energy scan for the xlarge phantom (27.0 mGy) was slightly lower than scans at other energies (29.7 mGy). We adjusted the measured noise level (multiplied by ) to account for this slightly lower dose. For the dual-energy scan, the scanner was operated with one x-ray tube at 140 kV (50 cm FOV) and the other at 80 kV (26 cm FOV). For each phantom size, three dual-energy scans having the same CTDIvol as in the single-energy scans were acquired using different dose partitionings between 80 kV and 140 kV tubes. The fraction of dose applied to the 80 kV tube (as a percentage of the total CTDIvol) was 30%, 50%, and 70%. The rotation time was 1 s for all scans. The detector collimation was 24 × 1.2 mm for single-energy scans and 14 × 1.2 mm for dual-energy scans. Images were reconstructed with a B30 kernel for single-energy scans and a D30 kernel for dual-energy scans at 5 mm slice thickness and 2 mm intervals. The “D” kernel was a dedicated dual-energy kernel.
Data analysis
For each dual-energy image dataset (140 kV and 80 kV), the CT numbers of the iodine samples and the water background, and the noise in the background, were measured and averaged over six adjacent images. The location where the background noise was measured was labeled in Fig. 2. Monochromatic images at eight energies (40 to 110 keV) were generated (Syngo Dual Energy, DE application “monochromatic,” Siemens Healthcare). The software allows a wider range of monochromatic energies from 40 to 190 keV. A narrower range (40 to 110 keV) was investigated in this study because this range is already sufficiently large to show the main characteristics of monochromatic images in comparison with single-energy scans. For each monochromatic image dataset, the CT numbers of the iodine samples and water background, and the noise in the background, were measured in the same fashion as in the dual-energy image datasets. The iodine CNR for each dataset was calculated based on the contrast and noise measurements. This process was repeated for each dose partitioning. For comparison, the corresponding noise and iodine CNR in single-energy images at 80 kV, 100 kV, 120 kV, and 140 kV were also measured and calculated.
RESULTS
Contrast
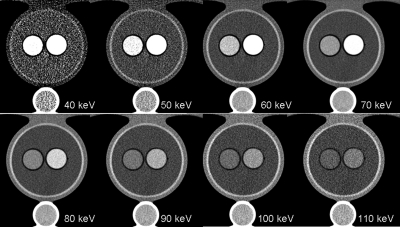
Example monochromatic images at energies from 40 to 110 keV are shown in Fig. 3. Iodine contrast as a function of monochromatic energy for each phantom is plotted in the left panel of Fig. 4. For comparison, iodine contrast as a function of polychromatic single energy for each phantom is displayed in the right panel of the same figure. As can be seen, iodine contrast increases with a decrease of monochromatic energy or polychromatic energy. Monochromatic images provided a relatively consistent iodine CT number across phantom sizes, while polychromatic single-energy images show larger differences across phantom sizes, with less contrast for larger phantoms, primarily due to the beam-hardening effect. The current beam-hardening correction method available on the scanner does not fully take into account the effect of iodine.20 In the presence of iodine, there is an under-correction. With the increase of the effective energy in larger phantom sizes, the inherent iodine contrast relative to water decreases and the beam-hardening correction does not completely correct for it. For monochromatic images, the increase of the effective energy for larger phantoms is taken into account during the calibration for generating the monochromatic images, which resulted in more consistent CT numbers at the same monochromatic energy across different phantom sizes.
Figure 3.
An example of monochromatic images from 40 keV to 110 keV created from a dual-energy scan. Display window level and width are 40 HU and 400 HU, respectively.
Figure 4.
Left panel: Iodine contrast as a function of monochromatic energy for the four phantom sizes. Right panel: iodine contrasts at different polychromatic single energies for the four phantom sizes.
Noise
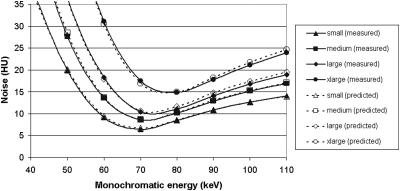
Noise as a function of monochromatic energy for each phantom is plotted in the left panel of Fig. 5. Plotted in the right panel of the same figure is the noise as a function of polychromatic energy for each phantom. For simplicity, only the results for equal dose partitioning are shown here. To obtain minimum noise, optimal monochromatic energies were 68, 71, 74, and 77 keV for small, medium, large, and x-large phantom sizes, respectively. At these monochromatic energies, the noise level was similar to that of a single-energy scan at 120 kV having the same radiation dose.
Figure 5.
Noise as a function of monochromatic energy for the four phantom sizes (left panel). For comparison, noise levels at different polychromatic single energies are also displayed in the right panel. Note that the radiation doses in terms of CTDIvol are matched for each phantom size. The radiation dose allocated to 80 kV in the dual-energy scan was 50%.
Iodine CNR
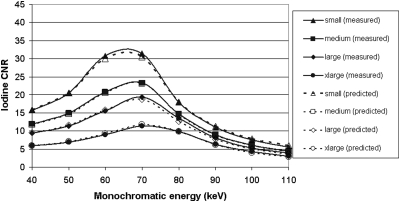
Iodine CNR as a function of monochromatic energy for each phantom is plotted in the left panel of Fig. 6. Plotted in the right panel of the same figure is the iodine CNR as a function of polychromatic single energy for each phantom. For simplicity, only the results for equal dose partitioning are shown. To obtain maximum iodine CNR, the optimal monochromatic energies were 66, 68, 70, 72 keV for small, medium, large, and x-large phantom sizes, respectively. At these energies, iodine CNR was better than that of a single-energy scan at 120 kV having the same radiation dose. Compared to an 80 kV scan, however, the CNR in monochromatic images was lower than in 80 kV polychromatic images for the small, medium, and large phantoms.
Figure 6.
Iodine CNR as a function of monochromatic energy for the four phantom sizes (left panel). For comparison, iodine CNR at different polychromatic single energies are also displayed in the right panel. Note that the radiation doses in terms of CTDIvol are matched for each phantom size. The radiation dose allocated to 80 kV in the dual-energy scan was 50%.
Monochromatic energy and linear weighting factor
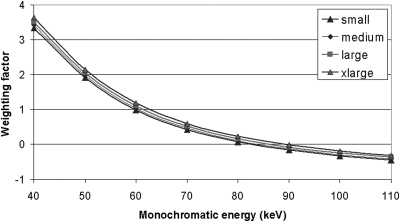
According to Eq. 4, the monochromatic image at energy E is a weighted average of the low- and high-energy images, with the weighting factors determined by energy E and the effective energies of the low- and high-energy scans. Figure 7 plots the weighting factor of the low-energy image as a function of monochromatic energy. The weighting factor was a monotonic function of the monochromatic energy for each phantom size. To create monochromatic energy images between the effective energies of the low- and high-energy beams, the weighting factor must be between 0 and 1; to create monochromatic energy images below the effective energy of the low-energy beam, the weighting factor must be greater than 1; to create monochromatic energy images above the effective energy of the high-energy beam, the weighting factor must be less than 0.
Figure 7.
Weighting factor for 80 kV image as a function of monochromatic energy for the four phantom sizes, where the effective energies of the low and high kV were different.
Using the weighting factors, we calculated monochromatic images at each energy for each phantom using Eq. 4 and then derived the noise and iodine CNR as functions of monochromatic energy. In order to synthesize the virtual monochromatic images, the effective energy has to be determined for each kV and phantom. We empirically adjusted the effective energy for each phantom size until both the CNR curve and the noise curve matched to those obtained from the scanner. The criterion of agreement was that the mean difference between predicted and measured CNR and noise for each phantom size was within 5%. When the effective energy of 80 kV was 59.8, 60.5, 61.4, 62.6 keV, and the effective energy of 140 kV were 81.5, 83.8, 86.1, 89.0 keV for small, medium, large, and xlarge phantoms, respectively, the calculated noise and iodine CNR as functions of monochromatic energy agreed with the measurement from the scanner, as shown in Figs. 89. The percent difference for CNR was 2.2% ± 1.7%, 1.6% ± 0.7%, 4.0% ± 2.0%, and 2.1% ± 1.3% for small, medium, large, and xlarge phantoms, respectively. The percent difference for noise was 1.6% ± 1.3%, 1.1% ± 0.8%, 3.2% ± 1.6%, and 1.9% ± 1.2% for small, medium, large, and xlarge phantoms, respectively.
Figure 8.
Comparison of calculated and measured noise in monochromatic images as a function of energy for the four phantom sizes. The radiation dose fraction allocated to 80 kV in the dual-energy scan was 50%.
Figure 9.
Comparison of calculated and measured iodine CNR in monochromatic images as a function of energy for the four phantom sizes. The radiation dose fraction allocated to 80 kV in the dual-energy scan was 50%.
Influence of dose partitioning between low and high energies
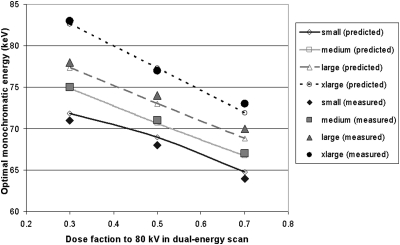
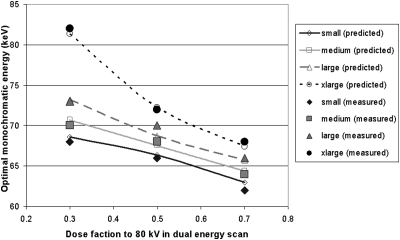
Dose partitioning between low and high energies in dual-energy scans has an impact on the optimal monochromatic energy, as shown in Eqs. 10, 11. We performed the same data analyses as above for dose fractions to the 80 kV scans at 30% and 70% of the total applied dose. The optimal monochromatic energies yielding the minimum noise and the maximum iodine CNR are shown in Figs. 1011, respectively. Based on Eqs. 8, 9, we calculated the optimal monochromatic energy as a function of dose fraction to 80 kV in dual-energy scans for the four phantom sizes. The calculated optimal monochromatic energies for minimizing noise and maximizing CNR were also displayed in Figs. 1011, respectively, which agreed with those obtained from the monochromatic images synthesized on the scanner.
Figure 10.
Optimal monochromatic energy yielding the minimum noise as a function of dose fraction to 80 kV in dual-energy scans for the four phantom sizes. Both results measured on the monochromatic images and calculated from Eq. 8 were shown.
Figure 11.
Optimal monochromatic energy yielding the maximum CNR as a function of dose fraction to 80 kV in dual-energy scans for the four phantom sizes. Both results measured on the monochromatic images and calculated from Eq. 9 were shown.
The differences between the calculated optimal monochromatic energies and those obtained from the monochromatic images synthesized on the scanner were very small. For maximum CNR, the mean absolute difference of the optimal monochromatic energy was 0.64 keV, 0.53 keV, 0.59 keV, and 0.51 keV for small, medium, large, and xlarge phantoms, respectively. For minimum noise, the mean absolute difference of the optimal monochromatic energy was 0.85 keV, 0.22 keV, 0.94 keV, and 0.62 keV for small, medium, large, and xlarge phantoms, respectively. These differences may be due to the imperfect match between the effective energy for each phantom size and the calibration performed on the scanner software, but within a very small range (less than 1 keV).
DISCUSSION
To date, no studies have systematically evaluated the image quality of virtual monochromatic images generated from dual-source, dual-energy scans and compared it with that from single-energy CT scans acquired at various tube potentials but using the same radiation dose. The noise properties of virtual monochromatic images were studied in a very early work by Alvarez and Seppi.21 They found that a minimum noise exists, corresponding to a certain monochromatic energy. They concluded that similar noise levels could be achieved by monochromatic images and conventional polychromatic images for the same radiation dose, which is consistent with the results of our study. However, they did not evaluate the use of CNR as the image quality metric. The effect of patient size was also not evaluated. Their experimental verification has limited applicability to modern dual-energy CT systems, particularly dual-source CT systems, due to the now obsolete CT technology used.
Matsumoto et al. evaluated the noise and iodine CNR in virtual monochromatic images on a single-source CT scanner using a fast-kV switching dual-energy technique.22 They compared monochromatic images to only 120 kV single-energy images and evaluated only one setting of dose partitioning and one phantom size. No theoretical analysis was included. In another article, Goodsitt et al. evaluated the CT number and effective atomic number measured in monochromatic images obtained with a fast-kV switching dual-energy technique.10 However, there was no evaluation performed on noise or CNR in comparison to single-energy scans at typical tube potentials.
Creating mixed images from low- and high-energy images using both linear and nonlinear weightings is used in dual-source, dual-energy CT to provide a single set of images for routine diagnosis.5, 6, 7, 8 We previously evaluated the image quality of linearly mixed images created from dual-source, dual-energy CT in comparison with single-energy CT.6 In this work, we demonstrate the relationship between a virtual monochromatic image and a linearly mixed image created from a dual-source, dual-energy scan. Using this relationship to extend our previous analysis, the linear combination of low- and high-energy images that minimizes noise or maximizes CNR is expressed in terms of an optimal monochromatic energy.
More importantly, the current work compared the noise and iodine CNR values at different monochromatic energies to values obtained using the same dose with conventional polychromatic single-energy CT scans at different tube potentials. The effect of several important technical factors, including patient size, dose partitioning, and image quality metric to be optimized, were considered in this evaluation. This systematic evaluation provides essential information for the selection of optimal scanning techniques.
In the past few years, use of lower tube potentials in single-energy CT (relative to 120 kV) has been suggested as a method for improving image quality or reducing radiation dose,23, 24, 25, 26, 27, 28 and a strategy to automatically select the optimal tube potential for radiation dose reduction has been proposed.29 Now, with dual-energy CT and monochromatic image synthesis, yet another type of image can be provided to the interpreting physician. The results of this study provide important information for physicists, technologists, and imaging physicians regarding how the image quality at an optimal virtual monochromatic energy compares with that at an optimal polychromatic tube potential for the same radiation dose as a function of patient size.
The results of our study demonstrate how the optimal monochromatic energy depends on several factors: phantom size, partitioning of the radiation dose between low- and high-energy scans, and the image quality metrics to be optimized. With the increase of phantom size, the optimal monochromatic energy increased, mainly due to additional beam hardening in larger phantoms. With the increased percentage of radiation dose being applied to the lower energy, the optimal monochromatic energy decreased. To maximize the iodine CNR in monochromatic images, the optimal energy was lower than that to minimize the noise level. This can be explained by the favorable increase in iodine contrast and unfavorable increase in noise at lower energy, which requires a higher weighting factor on lower energy images for maximizing iodine CNR than for minimizing noise.
The comparison between monochromatic images and conventional polychromatic single-energy images at different tube potentials for the same radiation dose has important practical implications. With optimal monochromatic energies, the noise level was similar to that of a single-energy scan at 120 kV for all phantom sizes included in this study (Fig. 5). With respect to iodine CNR, monochromatic images were similar to or better than single-energy images at 120 kV for the same radiation dose (Fig. 6). Therefore, if dual-energy CT is performed to obtain material-specific information, monochromatic images synthesized from the dual-energy scan can provide image quality equivalent or better than at 120 kV with no increase in radiation dose. However, comparing virtual monochromatic images from dual-energy CT to polychromatic single-energy CT at other tube potentials, the conclusions regarding optimal settings are very dependent on patient size. Iodine CNR in virtual monochromatic images from dual-energy CT was lower than for single-energy 80 kV images for the small, medium, and large phantom sizes. Therefore, if there is no desire to obtain material-specific information from the dual-energy scan, it is better to simply perform a conventional single-energy scan at the optimal tube potential, which for a given patient size and diagnostic task can reduce radiation dose and/or improve image quality.27, 29, 30
CONCLUSIONS
The image quality of monochromatic images synthesized from a dual-energy CT scan was evaluated and compared to that of single-energy CT scans at the same radiation dose. At optimal monochromatic energies, the noise level was similar to and the iodine CNR was better than that of 120 kV images having the same radiation dose. Compared to single-energy 80 kV images, the iodine CNR in virtual monochromatic images was lower for small to large phantom sizes.
ACKNOWLEDGMENTS
This work was supported by a research grant from Thrasher Research Foundation and a research grant (R01 EB007986) from the National Institutes of Health. The content is solely the responsibility of the authors and does not necessarily represent the official view of the National Institutes of Health. CHM and JGF receive research support from Siemens Healthcare. The authors would like to thank Dr. Christian Eusemann and Dr. Bernhard Schmidt from Siemens for their help on dual-energy monoenergetic applications, and Dr. Norbert Pelc for stimulating discussions. The authors would also like to thank Ms. Kristina Nunez for assistance with manuscript preparation.
References
- Alvarez R. E. and Macovski A., “Energy-selective reconstructions in x-ray computed tomography,” Phys. Med. Biol. 21, 733–744 (1976). 10.1088/0031-9155/21/5/002 [DOI] [PubMed] [Google Scholar]
- Kalender W. A., Perman W. H., Vetter J. R., and Klotz E., “Evaluation of a prototype dual-energy computed tomographic apparatus I. Phantom studies,” Med. Phys. 13, 334–339 (1986). 10.1118/1.595958 [DOI] [PubMed] [Google Scholar]
- Johnson T. R., Krauss B., Sedlmair M., Grasruck M., Bruder H., Morhard D., Fink C., Weckbach S., Lenhard M., Schmidt B., Flohr T., Reiser M. F., and Becker C. R., “Material differentiation by dual energy CT: Initial experience,” Eur. Radiol. 17, 1510–1517 (2007). 10.1007/s00330-006-0517-6 [DOI] [PubMed] [Google Scholar]
- Fletcher J. G., Takahashi N., Hartman R., Guimaraes L., Huprich J. E., Hough D. M., Yu L., and McCollough C. H., “Dual-energy and dual-source CT: Is there a role in the abdomen and pelvis?,” Radiol. Clin. North Am. 47, 41–57 (2009). 10.1016/j.rcl.2008.10.003 [DOI] [PubMed] [Google Scholar]
- D. R.Holmes, 3rd, Fletcher J. G., Apel A., Huprich J. E., Siddiki H., Hough D. M., Schmidt B., Flohr T. G., Robb R., McCollough C., Wittmer M., and Eusemann C., “Evaluation of non-linear blending in dual-energy computed tomography,” Eur. J. Radiol. 68, 409–413 (2008). 10.1016/j.ejrad.2008.09.017 [DOI] [PMC free article] [PubMed] [Google Scholar]
- Yu L., Primak A. N., Liu X., and McCollough C. H., “Image quality optimization and evaluation of linearly mixed images in dual-source, dual-energy CT,” Med. Phys. 36, 1019–1024 (2009). 10.1118/1.3077921 [DOI] [PMC free article] [PubMed] [Google Scholar]
- Behrendt F. F., Schmidt B., Plumhans C., Keil S., Woodruff S. G., Ackermann D., Mulenbruch G., Flohr T., Gunther R. W., and Mahnken A. H., “Image fusion in dual energy computed tomography effect on contrast enhancement, signal-to-noise ratio and image quality in computed tomography angiography,” Invest. Radiol. 44, 1–6 (2009). 10.1097/RLI.0b013e31818c3d4b [DOI] [PubMed] [Google Scholar]
- Kim K. S., Lee J. M., Kim S. H., Kim K. W., Kim S. J., Cho S. H., Han J. K., and Choi B. I., “Image fusion in dual energy computed tomography for detection of hypervascular liver hepatocellular carcinoma phantom and preliminary studies,” Invest. Radiol. 45, 149–157 (2010). 10.1097/RLI.0b013e3181d32119 [DOI] [PubMed] [Google Scholar]
- Lehmann L. A., Alvarez R. E., Macovski A., Brody W. R., Pelc N. J., Riederer S. J., and Hall A. L., “Generalized image combinations in dual KVP digital radiography,” Med. Phys. 8, 659–667 (1981). 10.1118/1.595025 [DOI] [PubMed] [Google Scholar]
- Goodsitt M. M., Christodoulou E. G., and Larson S. C., “Accuracies of the synthesized monochromatic CT numbers and effective atomic numbers obtained with a rapid kVp switching dual energy CT scanner,” Med. Phys. 38, 2222–2232 (2011). 10.1118/1.3567509 [DOI] [PubMed] [Google Scholar]
- Vrtiska T. J., Takahashi N., Fletcher J. G., Hartman R. P., Yu L., and Kawashima A., “Genitourinary applications of dual-energy CT,” AJR, Am. J. Roentgenol. 194, 1434–1442 (2010). 10.2214/AJR.10.4404 [DOI] [PMC free article] [PubMed] [Google Scholar]
- Primak A. N., Fletcher J. G., Vrtiska T. J., Dzyubak O. P., Lieske J. C., Jackson M. E., J. C.Williams, Jr., and McCollough C. H., “Noninvasive differentiation of uric acid versus non-uric acid kidney stones using dual-energy CT,” Acad. Radiol. 14, 1441–1447 (2007). 10.1016/j.acra.2007.09.016 [DOI] [PMC free article] [PubMed] [Google Scholar]
- Graser A., Johnson T. R., Bader M., Staehler M., Haseke N., Nikolaou K., Reiser M. F., Stief C. G., and Becker C. R., “Dual energy CT characterization of urinary calculi: initial in vitro and clinical experience,” Invest. Radiol. 43, 112–119 (2008). 10.1097/RLI.0b013e318157a144 [DOI] [PubMed] [Google Scholar]
- Boll D. T., Patil N. A., Paulson E. K., Merkle E. M., Simmons W. N., Pierre S. A., and Preminger G. M., “Renal stone assessment with dual-energy multidetector CT and advanced postprocessing techniques: Improved characterization of renal stone composition—Pilot study,” Radiology 250, 813–820 (2009). 10.1148/radiol.2503080545 [DOI] [PubMed] [Google Scholar]
- Takahashi N., Hartman R. P., Vrtiska T. J., Kawashima A., Primak A. N., Dzyubak O. P., Mandrekar J. N., Fletcher J. G., and McCollough C. H., “Dual-energy CT iodine-subtraction virtual unenhanced technique to detect urinary stones in an iodine-filled collecting system: A phantom study,” AJR, Am. J. Roentgenol. 190, 1169–1173 (2008). 10.2214/AJR.07.3154 [DOI] [PMC free article] [PubMed] [Google Scholar]
- Glazebrook K. N. et al. , “Identification of intraarticular and periarticular uric acid crystals with dual-energy CT: initial evaluation,” Radiology 261(2), 516–524 (2011). 10.2214/AJR.09.2428 [DOI] [PubMed] [Google Scholar]
- Maass C., Meyer E., and Kachelriess M., “Exact dual energy material decomposition from inconsistent rays (MDIR),” Med. Phys. 38, 691–700 (2011). 10.1118/1.3533686 [DOI] [PubMed] [Google Scholar]
- Kyriakou Y., Meyer E., Prell D., and Kachelriess M., “Empirical beam hardening correction (EBHC) for CT,” Med. Phys. 37, 5179–5187 (2010). 10.1118/1.3477088 [DOI] [PubMed] [Google Scholar]
- Kelcz F., Joseph P. M., and Hilal S. K., “Noise considerations in dual energy CT scanning,” Med. Phys. 6, 418–425 (1979). 10.1118/1.594520 [DOI] [PubMed] [Google Scholar]
- Stenner P., Schmidt B., Allmendinger T., Flohr T., and Kachelriess M., “Dynamic iterative beam hardening correction (DIBHC) in myocardial perfusion imaging using contrast-enhanced computed tomography,” Invest. Radiol. 45, 314–323 (2010). [DOI] [PubMed] [Google Scholar]
- Alvarez R. E. and Seppi E., “A comparison of noise and dose in conventional and energy selective computed tomography,” IEEE Trans. Nucl. Sci. NS-26, 2853–2856 (1979). 10.1109/TNS.1979.4330549 [DOI] [Google Scholar]
- Matsumoto K., Jinzaki M., Tanami Y., Ueno A., Yamada M., and Kuribayashi S., “Virtual monochromatic spectral imaging with fast kilovoltage switching: Improved image quality as compared with that obtained with conventional 120-kVp CT,” Radiology 259, 257–262 (2011). 10.1148/radiol.11100978 [DOI] [PubMed] [Google Scholar]
- Boone J. M., Geraghty E. M., Seibert J. A., and Wootton-Gorges S. L., “Dose reduction in pediatric CT: A rational approach,” Radiology 228, 352–360 (2003). 10.1148/radiol.2282020471 [DOI] [PubMed] [Google Scholar]
- Siegel M. J., Schmidt B., Bradley D., Suess C., and Hildebolt C., “Radiation dose and image quality in pediatric CT: Effect of technical factors and phantom size and shape,” Radiology 233, 515–522 (2004). 10.1148/radiol.2332032107 [DOI] [PubMed] [Google Scholar]
- Funama Y., Awai K., Nakayama Y., Kakei K., Nagasue N., Shimamura M., Sato N., Sultana S., Morishita S., and Yamashita Y., “Radiation dose reduction without degradation of low-contrast detectability at abdominal multisection CT with a low-tube voltage technique: Phantom study,” Radiology 237, 905–910 (2005). 10.1148/radiol.2373041643 [DOI] [PubMed] [Google Scholar]
- Frush D. P., “Pediatric abdominal CT angiography,” Pediatr, Radiol. 38(Suppl. 2), S259–S266 (2008). 10.1007/s00247-008-0795-z [DOI] [PubMed] [Google Scholar]
- Kalender W. A., Deak P., Kellermeier M., van Straten M., and Vollmar S. V., “Application- and patient size-dependent optimization of x-ray spectra for CT,” Med. Phys. 36, 993–1007 (2009). 10.1118/1.3075901 [DOI] [PubMed] [Google Scholar]
- Macari M., Spieler B., Kim D., Graser A., Megibow A. J., Babb J., and Chandarana H., “Dual-source dual-energy MDCT of pancreatic adenocarcinoma: Initial observations with data generated at 80 kVp and at simulated weighted-average 120 kVp,” Am. J. Roentgenol. 194, W27–W32 (2010). 10.2214/AJR.09.2737 [DOI] [PubMed] [Google Scholar]
- Yu L., Li H., Fletcher J. G., and McCollough C. H., “Automatic selection of tube potential for radiation dose reduction in CT: A general strategy,” Med. Phys. 37, 234–243 (2010). 10.1118/1.3264614 [DOI] [PubMed] [Google Scholar]
- Guimaraes L. S., Fletcher J. G., Harmsen W. S., Yu L., Siddiki H., Melton Z., Huprich J. E., Hough D., Hartman R., and McCollough C. H., “Appropriate patient selection at abdominal dual-energy CT using 80 kV: Relationship between patient size, image noise, and image quality,” Radiology 257, 732–742 (2010). 10.1148/radiol.10092016 [DOI] [PubMed] [Google Scholar]


