

Abstract
αβ T cell receptors recognize multiple antigenic peptides bound and presented by major histocompatibility complex molecules. TCR cross-reactivity has been attributed in part to flexibility of the complementarity-determining region loops, yet there have been limited direct studies of loop dynamics to determine the extent of its role. Here we studied the flexibility of the binding loops of the αβ TCR A6 utilizing crystallographic, spectroscopic, and computational methods. A significant role for flexibility in binding and cross-reactivity was indicated only for the CDR3α and CDR3β hypervariable loops. Examination of the energy landscapes of these two loops indicated that CDR3β possesses a broad, smooth landscape, leading to the rapid sampling in the free TCR of a range of conformations compatible with different ligands. The landscape for CDR3α is more rugged, resulting in limited conformational sampling that leads to specificity towards a reduced set of peptides as well as MHC. In addition to informing on the mechanisms of cross-reactivity and specificity, the energy landscapes of the two loops indicate a complex mechanism for TCR binding, incorporating elements of both conformational selection and induced-fit in a manner that blends features of popular models for TCR recognition.
Keywords: immune recognition, conformational selection, induced-fit, specificity, cross-reactivity
Introduction
Elimination of pathogens by the T cell arm of the immune system requires T cell recognition of an antigenic peptide bound and presented by class I or class II major histocompatibility complex (MHC) proteins. Recognition occurs via the T cell receptor (TCR), a clonotypic, heterodimeric cell-surface receptor. A defining characteristic of TCRs is their capacity to recognize multiple peptide/MHC ligands, necessary due to the fixed size of the T cell repertoire relative to the larger array of potential peptide antigens 1. In addition to ensuring reactivity against antigens derived from pathogens, TCR cross-reactivity is also necessary in the development and maintenance of the T cell repertoire and is believed to underlie several autoimmune pathologies and the rejection of transplanted tissues. Yet TCRs are not highly degenerate, showing specificity towards particular peptide subsets and, via the phenomenon of MHC restriction, usually recognizing peptides presented by a subset of MHC alleles.
Flexibility of the TCR antigen binding site is frequently discussed as an underlying contributor to cross-reactivity. Binding site flexibility has been inferred from crystallographic structures of bound and free TCRs, which frequently show differences in the conformation of complementarity determining region (CDR) loops (reviewed in ref. 2). Flexibility has also been inferred from multiple structures of the same TCR bound to different pMHC ligands, in which CDR loops often adopt different conformations (e.g., refs. 3; 4; 5). Significant attention has been paid to the hypervariable CDR3 loops, which usually form the most interactions with the peptide in TCR-pMHC crystal structures 6. Moreover, when bound and free TCRs are compared, the CDR3 loops show the largest overall changes in conformation 2.
Conformational changes upon binding such as those seen for TCR CDR3 loops are often attributed to induced-fit type motions occurring after initial contact. Induced-fit is embodied in the two-step mechanism for TCR cross-reactivity, which proposes that the TCR adjusts to the peptide after initial contact to MHC 7. An alternative (but not mutually exclusive) mechanism for conformational changes upon binding is the “selection” of a compatible conformation from a pre-existing structural equilibrium 8; 9. For TCRs, conformational selection is embodied in the “conformer” model, which proposes that distinct conformations of a TCR generated via a pre-existing equilibrium maintain specificity for different ligands 10.
Both conformational selection and induced-fit as general mechanisms for protein binding and selectivity have received considerable attention in recent years 8; 9; 11. Both reflect the underlying structural and energetic landscapes of the interacting molecules, with the actual binding mechanism dependent on the “roughness” of these landscapes, i.e., the energies of various conformational substates and the height of the barriers between them. Yet while both induced-fit and conformational selection have been postulated to play roles in TCR binding and cross-reactivity, there have been few studies evaluating the intrinsic flexibilities of TCR binding loops. An NMR study of the D10 TCR reported greater flexibility of the CDR3α and CDR3β loops in the picosecond time scale 12. Stopped-flow kinetic measurements have shown that the interaction of a cytomegalovirus peptide-specific TCR with its ligand is rate-limited by an induced-fit mechanism, but the location and magnitude of the associated structural changes that occur during binding is unknown 13. Thermodynamic studies have suggested that a number of TCRs must undergo conformational changes during binding (reviewed in ref. 14), but these are also unable to address specific changes and cannot discriminate between binding mechanisms. The resulting uncertainty about the intrinsic flexibility of CDR3 loops has led to characterizations ranging from unstructured loops that require folding upon binding 7 to ordered loops that undergo remodeling or rigid body shifts upon binding 15. That different CDR3 loop sequences will invariably possess different degrees of flexibility adds a further complication.
The αβ TCR A6 is among the most well characterized T cell receptors, with crystallographic structures available for the TCR bound to nine ligands. These include the Tax peptide (LLFGYPVYV) 16, the HuD peptide (LGYGFVNYI) 17, the Tel1p peptide (MLWGYLQYV) 18, and six single amino acid variants of the Tax peptide 19; 20; 21, all presented by the class I MHC HLA-A*0201 (HLA-A2). These structures comprise the largest structural database available for a single TCR. A distinctive feature of this database is the variability in the conformation of the CDR3β loop, which adjusts significantly in response to different ligands. In contrast, the positions of CDR3α and the remaining loops are independent of the peptide. This structural database together with available physical and biological data regarding A6 binding, specificity, and cross-reactivity provides a unique opportunity to study the structural and energetic landscapes of a TCR’s CDR loops and establish their roles in binding and cross-reactivity.
We began by determining the structure of the free A6 TCR, which revealed that both the CDR3α and CDR3β hypervariable loops must undergo conformational adjustments in order to bind. However, in the free TCR the CDR3α and CDR3β loops possess different degrees of flexibility, as shown by time-resolved fluorescence measurements. Together with molecular dynamics simulations and additional structural and thermodynamic data, our results indicate that CDR3β possesses a relatively smooth, broad energy landscape, allowing the free TCR to rapidly sample a range of conformations compatible with ligands that possess structural and chemical heterogeneity across the center of the peptide. The landscape of CDR3α is more rugged, leading to slower and more restrained motion that restricts the receptor to a more defined set of peptides, and likely only those presented by HLA-A2. Altogether, the data indicate that cross-reactivity and specificity are pre-programmed into the energy landscapes of the A6 TCR’s hypervariable loops, with the TCR interacting via a mechanism that blends elements of both conformational selection as well as induced-fit, thus reflecting aspects of both the conformer and two-step model for TCR recognition.
Results
Structure of the free A6 T cell receptor indicates structural heterogeneity for CDR3α and CDR3β
We first determined the structure of the free A6 TCR to 2.2 Å resolution. The protein crystallized in space group P21 with two molecules per asymmetric unit (Table 1). Both molecules adopted the characteristic TCR immunoglobulin fold. The two molecules in the asymmetric unit were nearly identical, with the backbones of the variable domains superimposing with an RMS deviation of only 0.9 Å (Fig. 1A). The conformations of the germline-encoded CDR1 and CDR2 loops of the α and β chains were identical in both copies of the molecule. Differences, however, were seen between the two copies of the CDR3α and CDR3β loops. For CDR3α, the electron density in the second molecule in the asymmetric unit was noticeably poorer than that for the first, with large intermittent gaps along the loop backbone (Fig. 1B). Despite the weaker density, the chain was fully traced, which together with the conformation in the first molecule in the asymmetric unit revealed two conformations for CDR3α.
Table 1.
X-ray data collection and refinement statistics
| Free A6 | A6-Tax-Y5F/HLA-A2 | |
|---|---|---|
| Data collection | ||
| Source | APS 19BM | APS 21ID-F |
| Space group | P21 | C2 |
| Cell dimensions | ||
| a, b, c (Å) | 91.2,51.7,96.3 | 224.0, 48.1, 93.0 |
| α, β, γ (°) | 90.0, 105.05, 90.0 | 90.0, 91.0, 90.0 |
| Resolution (Å) | 20-2.19 (2.24-2.19)* | 30-2.29 (2.34-2.29) |
| Unique reflections | 44707 | 44526 |
| Rmerge | 0.070 (0.578) | 0.066 (0.598) |
| I / σI | 16.6 (2.0) | 25.5 (2.7) |
| Completeness (%) | 99.6 (99.1) | 99.1 (98.5) |
| Redundancy | 3.5 (3.5) | 5.7 (5.8) |
| Refinement | ||
| Resolution (Å) | 20-2.19 | 20-2.29 |
| Reflections used | 44693 | 44464 |
| Rwork / Rfree (%) | 0.21 / 0.27 | 0.22 / 0.27 |
| No. atoms | ||
| Protein | 6864 | 6639 |
| Ligand/ion | 70 | 66 |
| Water | 256 | 193 |
| Average B-factors (Å2) | ||
| TCR | 44 | 49 |
| Peptide | 47 | |
| MHC | 49 | |
| Ligand/ion | 53 | 50 |
| Water | 39 | 52 |
| RMS deviations | ||
| Bond lengths (Å) | 0.019 | 0.012 |
| Bond angles (°) | 1.87 | 1.55 |
| Ramachandran statistics (%) | ||
| Most favored | 93.5 | 89.1 |
| Allowed | 5.3 | 10.4 |
| Generously allowed | 1.2 | 0.5 |
| PDB entry | 3QH3 | 3QFJ |
Values in parentheses are for highest-resolution shell.
Figure 1.

Structure of the unligated A6 TCR indicates conformational diversity in CDR3α and CDR3β. A) Superimposition of the two molecules in the asymmetric unit of the free A6 unit cell. B) 2Fo-Fc electron density contoured at 1σ for CDR3α in the first (left) and second (right) molecules in the asymmetric unit. Density around the backbone for the first molecule is nearly complete, whereas significant gaps were seen in the second. C) 2Fo-Fc electron density contoured at 1σ for CDR3β in the first (left) and second (right) molecules in the asymmetric unit. Density gaps around the backbone were seen for the first molecule, whereas in the second molecule density was absent for the Ala-Gly-Gly-Arg sequence beginning at residue 99.
Electron density was even weaker for CDR3β, with gaps for the first molecule in the asymmetric unit and missing density for the central Ala99-Gly100-Gly101-Arg102 sequence in the second molecule (Fig.1C). The structure thus indicates that both CDR3α and CDR3β possess static disorder within the crystal, with greater amounts of disorder for CDR3β than CDR3α. There were no crystallographic contacts to the backbones of the CDR3α/CDR3β loops in either molecule in the asymmetric unit.
Comparison of free and bound A6 reveals structural adaptations that occur upon binding are concentrated in CDR3α and CDR3β
To compare the structure of the free and bound TCR, we superimposed the variable domains from each A6-peptide/HLA-A2 complex whose structure has been solved onto those of the free receptor. For free A6, we utilized the coordinates for the first molecule in the asymmetric unit, for which the electron density for both CDR3 loops was clearer and for which both chains could be fully traced. Figure 2A shows the free and bound conformations of the CDR3α and CDR3β loops relative to the peptide and MHC positions. The structural diversity in CDR3β is apparent, as is the conserved positioning of CDR3α. The conformations of the two loops in the free TCR, however, differ from those adopted when bound.
Figure 2.

Conformational adjustments in both CDR3α and CDR3β are required for A6 recognition of peptide/HLA-A2 ligands. A) Stereo image showing how the conformations of CDR3α and CDR3β differ between bound and free, produced by superimposing the backbones of the variable domains of all crystallized forms of A6. The coordinates of the first molecule in the asymmetric unit were utilized for free A6. The peptide and HLA-A2 are shown to aid in orientation. The color scheme is on the right. The positions of various residues of interest are indicated. B) Steric clashes occur between atoms of CDR3α and HLA-A2 when free A6 is superimposed onto bound, as indicated by the red dashed lines. These clashes remain if free HLA-A2 is superimposed onto bound. C) Differences between free and bound are minimal for loops other than CDR3α and CDR3β. The view is through HLA-A2 onto the binding site of the TCR, with the peptide shown for clarity. The color scheme is the same as in panel A.
For CDR3α, the most significant difference between free and bound is in the backbone φ/ψ angles of Gly102, which between free and bound differ by an average of 151° and 116° for φ and ψ, respectively. The large backbone rotations at Gly102 together with smaller rotations (8° – 60°) for the remainder of the residues of CDR3α result in a shift of the free loop relative to the conformation it adopts in the A6-peptide/HLA-A2 ternary complexes. The result of the shift is a 90° twist at the loop’s apex. Not shown for simplicity in Fig. 2A is the conformation of CDR3α seen in the second molecule in the asymmetric unit, for which the electron density was poor. This conformation was closer to that seen in the bound state (Fig. S1), with the apex of the loop twisted into its bound conformation and the rest of the loop differing by ψ bond rotations at Trp101 and Lys103 near the C-terminal end of the loop.
In all structures of A6 bound to ligand, CDR3α interacts directly with the peptide, contacting the side chain at position 5 and hydrogen bonding to the glycine at peptide position 4. The comparison between free and bound indicates that formation of these interactions is facilitated by the need to avoid steric clashes with HLA-A2. As shown in Fig. 2B, multiple clashes occur between CDR3α and HLA-A2 when the variable domains of the free TCR are superimposed onto those of the bound. These clashes, involving Arg65, Lys66, and Ala69 on the HLA-A2 α1 helix, exist regardless of which A6-peptide/HLA-A2 complex is used for the superimposition, as well as if free peptide/HLA-A2 structures are used instead (the conformations of Arg65/Lys66/Ala69 do not change significantly upon TCR binding). Thus, the conformation of CDR3α and the interactions it forms with peptides is directly influenced by the MHC.
The comparison between free and bound is more complex for CDR3β, owing to the broader distribution seen in the various A6-peptide/HLA-A2 complexes. The conformation of the loop in the free structure differs from that in any of the complexes, consisting of a displacement at the N-terminal end and a tighter turn near the loop apex. Depending on the ligand recognized, significant angular changes between the free and bound loop conformations were seen for Gly97, Leu98, Gly100, and Gly101 (Fig. S4).
Other than CDR3α and CDR3β, the only other difference in CDR loop positioning between the free and various bound forms of A6 was seen for CDR1β, which differed by a small rigid body translation, best summarized by a 1.4 Å shift of the α carbon of Glu30 (Fig. 2C).
Time-resolved fluorescence anisotropy reveals CDR3β moves faster than CDR3α on the nanosecond timescale
To assess the backbone flexibility of the A6 CDR3α and CDR3β loops, we performed time-resolved fluorescence anisotropy (TRFA) experiments on the two loops. Single cysteine mutations were made within the two loops to allow for fluorescent labeling. Two separate mutations were made in the CDR3α loop (S100C and W101C) and four separate mutations within the CDR3β loop (A99C, G100C, G101C, and R102C). The positions span the apexes of both loops, and for CDR3β, include the positions for which electron density is missing in the second molecule in the asymmetric unit of the structure of the free TCR. As a positive control, we also examined position 195 in HLA-A2, a previously-characterized highly flexible site at the tip of the HLA-A2 α3 domain 18.
For each labeled site, backbone flexibility was assessed via TRFA utilizing time-correlated single-photon counting. With fluorescein-5-maleimide as a probe, in all cases, anisotropy decayed more rapidly for CDR3β than for CDR3α, although not as fast as the positive control (Fig. 3). These results indicate faster nanosecond dynamics for CDR3β and are consistent with the differences in electron density seen in the structure of the free TCR. To extract quantitative information, the data were fit to a biexponential decay function to determine fast and slow correlation times and their associated amplitudes. In TRFA with nanosecond-lifetime probes, the fast correlation time reports on local backbone motion whereas the slow correlation time reports on overall protein tumbling 22; 23; 24.
Figure 3.

Time-resolved fluorescence anisotropy indicates CDR3β moves more rapidly than CDR3α. Anisotropy decay curves are shown on the left, while labeling positions are shown on the right. In all cases, anisotropy decayed faster for CDR3β than for CDR3α. Neither loop moved as rapidly as the disordered tip of the HLA-A2 α3 domain. Solid lines show fits to a bi-exponential decay model. The LED prompt indicates the instrument pulse. Data for BODIPY-FL-labeled samples is in Fig. S2.
As shown in Table 2, the fast correlation times (θf) were as much as two-fold faster for CDR3β than for CDR3α. Moreover, the contributions of backbone flexibility to the overall anisotropy decay (ff) were roughly two-fold greater for CDR3β than for CDR3α. The apex of CDR3β thus moves faster and with greater amplitude than the apex of CDR3α, consistent with the electron density seen for the free TCR. Both timescale and amplitude are reflected in the ratios of ff to θf, which combine amplitude and time constants into a single empirical parameter to facilitate comparisons of overall flexibility 23; 24. Notably, the ff/θf ratios are at least two-fold higher for residues in CDR3β than CDR3α.
Table 2.
Correlation times and amplitudes from the time-resolved fluorescence anisotropy data.a
| Position | θf (ns) b | θs (ns) c | ff (×100%) d | ff/θfe |
|---|---|---|---|---|
| CDR3α | ||||
| S100 | 1.13 ± 0.51 | 18.3 ± 1.0 | 19.2 ± 4.5 | 0.23 ± 0.15 |
| W101 | 0.89 ± 0.34 | 17.5 ± 1.5 | 26.3 ± 3.2 | 0.35 ± 0.17 |
| W101 (BDPY)f | 1.40 ± 0.08 | 13.6 ± 0.3 | 37.3 ± 1.2 | 0.27 ± 0.01 |
| CDR3β | ||||
| A99 | 0.55 ± 0.12 | 16.9 ± 1.0 | 41.7 ± 2.4 | 0.80 ± 0.21 |
| G100 | 0.79 ± 0.26 | 15.0 ± 1.2 | 39.4 ± 2.4 | 0.56 ± 0.20 |
| G101 | 0.80 ± 0.19 | 11.0 ± 1.1 | 52.3 ± 1.9 | 0.68 ± 0.15 |
| G101 (BDPY)f | 1.12 ± 0.02 | 14.6 ± 0.3 | 54.5 ± 0.1 | 0.49 ± 0.01 |
| R102 | 0.67 ± 0.12 | 11.8 ± 0.4 | 38.6 ± 2.1 | 0.60 ± 0.13 |
| HLA-A2 | ||||
| S195 | 0.45 ± 0.03 | 8.3 ± 0.6 | 74.1 ± 0.9 | 1.68 ± 0.12 |
From the quantitative analysis of the TRFA decay curves. Values represent the averages and standard deviations of a minimum of seven independent measurements.
Fast correlation time, reflecting backbone motion
Slow correlation time, reflecting overall protein tumbling
Amplitude of fast decay phase, reflecting percent contribution of backbone motion to overall anisotropy decay
Amplitude of fast decay normalized by fast correlation time, reflecting the contributions of both amplitude and correlation time to overall anisotropy decay. Higher numbers translate into greater/faster dynamics
Collected using BODIPY-FL as a fluorescent probe. All other measurements utilized fluorescein.
Some variation was seen in the slow correlation time θs, although the average of 14 ns is close to the value expected for a 50 kDa globular protein 25. The variation in θs is not unexpected given our use of fluorescein, whose fluorescence lifetime is three- to four-fold smaller than the expected θs, resulting in little fluorescence signal to report on overall protein tumbling in the presence of faster modes of anisotropy decay. For the same reason, seemingly faster and less accurate values of θs are expected as backbone flexibility increases 22, as is observed in the data.
The measurements at positions 101 in CDR3α and CDR3β were repeated using BODIPY-FL malemide as a fluorescent probe (Fig. S2). BODIPY-FL has spectral characteristics very similar to fluorescein, yet possesses different structural and chemical properties. The correlation times and amplitudes obtained with BODIPY-FL differed somewhat when compared to the those obtained with fluorescein, as expected given the differences in structure, chemistry, and fluorescence lifetime between fluorescein and BODIPY-FL. However, the overall conclusions from the BODIPY-FL data were the same: faster decay was observed for CDR3β than for CDR3α. Importantly, the ratios of the ff/θf values between the CDR3β and CDR3α data for position 101 were the same for the BODIPY-FL and fluorescein data, verifying quantitatively the faster motion for CDR3β.
Molecular dynamics simulations indicate CDR3α moves slowly between bound and free conformations whereas CDR3β rapidly samples a more extensive range of conformations
We next examined the flexibility of the free A6 TCR using molecular dynamics (MD) simulations. We began by running five independent 40ns trajectories (200 ns of total simulation time), beginning with the coordinates for the first molecule in the asymmetric unit. Backbone flexibility was examined by calculating atomic displacement (in the form of B-factors) for the α carbons of the TCR. Over the full 200 ns, the CDR3α and CDR3β loops showed the highest degree of flexibility in the α and β variable domains (Fig. 4A). In agreement with the crystallographic and TRFA data, CDR3β showed greater flexibility than CDR3α, with an approximately 60% higher average displacement for the loop apex compared to CDR3α. A covariance analysis between the residues of the two loops, calculated over the full 200 ns of simulation time, indicated only marginal coupled motion between the residues of CDR3α and CDR3β (Fig. S3).
Figure 4.

Molecular dynamics simulations support the dynamics measurements and place them in a structural context. A) B-factors for the α carbons of the A6 Vα and Vβ domains indicate that CDR3α and CDR3β are the most dynamic, with the apex of CDR3β showing approximately 60% greater displacement than that of CDR3α. B) RMSD from various configurations for the residues of CDR3α (V92 – K103). For the majority of simulation time, CDR3α remained in a set of conformations closely resembling its starting, unligated conformation. In the third 40 ns trajectory, CDR3α sampled a conformation more closely resembling that of the bound state. C) RMSD from various configurations for the residues of CDR3β (S94 – E105). Unlike CDR3α, CDR3β sampled a range of conformations, and did not remain in any single state for an appreciable length of time. D) 50 structural snapshots from the simulation, averaged over subsequent 4ns blocks. The two general conformations adopted by CDR3α are colored orange and grey. The orange conformations illustrate those closest to the bound state of CDR3α, observed during the third 40ns segment. The wide range of conformations adopted by CDR3β are also apparent.
To more quantitatively examine the conformations adopted by CDR3α and CDR3β during the MD simulations, we calculated RMS deviations of the CDR3α and CDR3β loops relative to the starting conformation and the conformations adopted in the structures of A6 bound to Tax/HLA-A2 16 and Tel1p/HLA-A2 18. For the majority of simulation time, the backbone of CDR3α remained close to the starting conformation (average RMSD relative to start was 0.5 Å; average RMSD relative to the bound state with the Tax and Tel1p peptides was 1.5 Å) (Fig. 4B). However, in the third 40-ns MD segment, CDR3α moved to and remained in a conformation more similar to that seen in the bound states (average RMSD relative to the bound state with the Tax peptide was 1.0 Å, with a minimum value of 0.3 Å).
In good agreement with the comparison of the free and bound TCR structures, the movement between the free and bound-like conformations of CDR3α was controlled largely by φ/ψ bond rotations at Gly102 and Thr93 (Fig. S4). Partial movement towards the bound state was seen in the fourth MD segment, in which the Gly102 φ bond moved within 30° of the value in the bound state, although the overall conformation of the loop remained closer to that observed in the free rather than bound TCR.
The third molecular dynamics segment in which CDR3α switched to a bound-like conformation was continued for an additional 60 ns, during which CDR3α remained in this conformation. The observation of only a single conformational switch for CDR3α over 260 ns of simulation time implies a high energy barrier separating the loop’s free and bound conformations.
Unlike CDR3α, CDR3β sampled multiple conformations during the simulations, mirroring those seen in the various A6-peptide/HLA-A2 complexes. The loop did not remain in any one state for an appreciable length of time (Fig. 4C). Notably, Leu98, Ala99, Gly100, Gly101, and Arg102 of CDR3β sampled the φ/ψ dihedral angles present in all known A6-peptide/HLA-A2 crystal structures (Fig. S5). The observation of multiple, more easily accessible conformations indicates a broader and smoother energy landscape for CDR3β compared to CDR3α.
Coordinates for CDR3α and CDR3β output every 4 ns are shown superimposed in Fig. 4D. The free and bound-like conformations observed for CDR3α are highlighted, as is the range of conformations observed for CDR3β. Superimposition of these conformations onto the A6-Tax/HLA-A2 complex confirmed that the steric overlaps between CDR3α and HLA-A2 persisted while the loop remained in its free conformation.
Finally, we ran an additional 200 ns of simulation on the A6 TCR in its bound-state conformation, beginning with the coordinates of A6 bound to Tax-P6A/HLA-A2, with the pMHC removed 19. During this “reverse” simulation, despite the absence of the pMHC, the backbone of CDR3α remained near its starting, bound conformation, supporting the conclusion that the energy barrier separating the bound and free conformations for CDR3α is high in both directions. CDR3β, on the other hand, sampled a range of conformations in the reverse simulation, showing dynamic behavior nearly identical to that observed when the simulation was begun with the coordinates for the free TCR (Fig. S6).
A6 recognition of the Tax-Y5F variant confirms CDR3β possesses a smooth energy landscape
The data so far suggest a broad, smooth energy landscape for CDR3β, leading to the rapid sampling of multiple conformations in the free TCR. To test whether these conformations are compatible with different ligands, we determined the structure of the A6 TCR in complex with HLA-A2 presenting a variant of the Tax peptide in which the central Tyr5 residue was replaced with phenylalanine (Tax-Y5F). We previously observed a correlation between the presence or absence of a hydrogen bond donor or acceptor at position 5 of the Tax peptide and the conformation of CDR3β 17, and hypothesized that simply replacing Tyr5 with phenylalanine would alter loop conformation. Importantly, Tax-Y5F is recognized with affinities and kinetics identical within error to those for native Tax/HLA-A2 26. An altered CDR3β conformation with Tax-Y5F would thus indicate that the smooth energy landscape of CDR3β spans multiple binding-competent conformations.
The A6-Tax-Y5F/HLA-A2 complex crystallized in space group C2 with unit cell parameters similar to those for A6 bound to the native Tax/HLA-A2 ligand (Table 1 and Fig. S7). Overall, the two complexes were essentially the same (Fig. 5A), with all α carbons superimposing with an RMSD of 0.8 Å. As hypothesized though, CDR3β was shifted into a more open conformation (Fig. 5B), displacing its apex 3.3 Å towards the HLA-A2 α2 helix. The change in CDR3β was identical to that seen upon A6 recognition of the HuD peptide 17, and only slightly smaller than that seen upon recognition of a Tax variant with doubly-fluorinated phenylalanine at position five 21. As with both of these ligands, the loss of a hydrogen bond between the peptide and Arg95 of CDR3β was compensated by the formation of a salt-bridge between Arg102 of CDR3β and Glu154 of the HLA-A2 heavy chain (Fig. 5C–E). The loss of a single hydrogen bond is thus sufficient to trigger an altered CDR3β conformation, in this case due to the need to optimize interface electrostatics.
Figure 5.

The structure of A6 bound to Tax-Y5F/HLA-A2 supports a broad, smooth energy landscape for CDR3β. A) Superimposition of the structure of the complexes with native Tax and Tax-Y5F highlight the overall structural similarities between the two complexes. The color scheme is indicated in the inset. B) Close-up of the region around CDR3β, showing the shift in CDR3β conformation in response to replacing Tyr5 of the Tax peptide with phenylalanine. The shift is largest at the α carbon of Gly101, which moves 3.3 Å relative to its position with native Tax. The color scheme is the same as in panel A. C) The conformation of CDR3β in the Tax-Y5F structure is nearly identical to that seen in the structure with the HuD peptide. D) The hydrogen bond made between Tyr5 and Arg95β in the structure with native Tax. E) Loss of the Tyr5-CDR3β hydrogen bond is compensated by the formation of a salt-bridge between Arg102 of CDR3β and HLA-A2 in the Tax-Y5F structure, as also seen with the HuD peptide 17 and fluorinated Tax variants 21.
When considered alongside the previously published binding data 26, the simplest interpretation of the structural data with the Tax-Y5F peptide is that the change in loop conformation between native Tax and Tax-Y5F costs little in free energy and that a significant barrier does not separate the conformations. To confirm this, we compared the thermodynamics of A6 recognition of native and Tax-Y5F using isothermal titration calorimetry (ITC), reasoning that a more complex mechanism behind the shift in loop conformation should result in a substantial change to the binding thermodynamics.
ITC experiments for A6 recognition of Tax/HLA-A2 and Tax-Y5F/HLA-A2 are shown in Fig. 6. The thermodynamic parameters for recognition of the native Tax ligand are in excellent agreement with those determined previously and show the unfavorable enthalpy change and favorable entropy change that characterizes A6 recognition of ligand 27; 28. Importantly, recognition of the Tax-Y5F ligand shows the same profile, with ΔG° values identical within error. Recognition of Tax-Y5F is slightly more unfavorable enthalpically and favorable entropically (ΔΔH° = 1.5 kcal/mol, ΔΔS° = 4 cal/mol/K), consistent with the electrostatic alterations in the interface and the greater hydrophobicity of phenylalanine compared to tyrosine. However, the conservation of the distinctive overall thermodynamic profile supports the overall conclusion regarding CDR3β: the loop possesses a smooth energy landscape that rapidly samples multiple conformations that are competent ligands that vary structural and chemical features across the center of the peptide.
Figure 6.
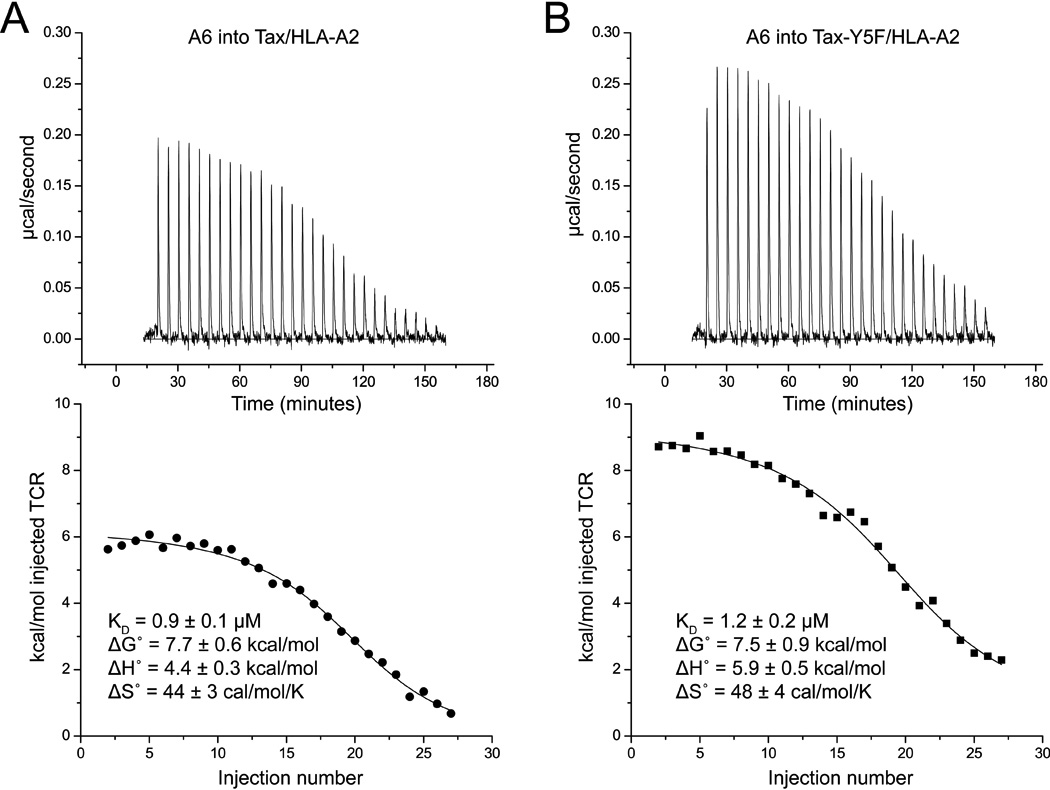
Isothermal titration calorimetry indicates A6 recognition of Tax-Y5F/HLA-A2 proceeds with an affinity identical within error and the same distinctive thermodynamic profile as recognition of native Tax/HLA-A2. A–B) Calorimetric titration of Tax/HLA-A2 (A) and Tax-Y5F/HLA-A2 (B) with the A6 TCR. Upper panels show the baseline corrected titrations; lower panels show the fits to single site binding models and associated thermodynamic parameters.
Discussion
The energy landscapes of CDR3α and CDR3β control A6 TCR cross-reactivity and specificity
To gain insight into how T cell receptor flexibility impacts binding and cross-reactivity, we examined the energy landscapes of the A6 TCR, focusing on the backbones of the hypervariable CDR3α and CDR3β loops. The data indicate that both CDR3α and CDR3β must adjust to recognize incoming ligands, consistent with kinetic data, which show that A6 binds the Tax/HLA-A2 ligand at rates below the diffusion limit when electrostatics are screened 27. The need for conformational adjustments is also consistent with measurements of binding thermodynamics, which again for recognition of Tax/HLA-A2, indicate that a large entropic penalty must be overcome after accounting for changes in solvation and other binding-linked effects 28.
However, although both the CDR3α and CDR3β loops must adjust to ligand, their underlying energy landscapes and resulting intrinsic flexibilities are different, as diagrammed in Fig. 7. CDR3β possesses a broad, relatively smooth energy landscape (Fig. 7A), leading to the rapid sampling of multiple conformations compatible with a range of ligands that alter size, shape, and electrostatic features across the center of the peptide. The consequences of this behavior are highlighted when recognition of the Tax and Tax-Y5F ligands is compared: despite requiring different conformations for CDR3β, the TCR binds the two with the same affinity, kinetics, and distinctive thermodynamic profile. The negligible impact on binding kinetics is particularly informative, as this indicates that not only can the adoption of different CDR3β conformations cost little or nothing in free energy, it can occur at rates fast relative to receptor-ligand association. The negligible impact on association rate for a ligand requiring an altered A6 CDR3β conformation is not limited to the Tax-Y5F peptide, as this has also been seen with fluorinated Tax variants 21. For at least a subset of ligands then, CDR3β can participate in rapid conformational selection, with various ligands “selecting” a compatible conformation from a rapidly fluctuating ensemble.
Figure 7.

Models of the energy landscapes of CDR3α and CDR3β. In all panels, free energy is on the vertical axis and conformational space on the horizontal axis. A) The energy landscape of CDR3β is broad and relatively smooth, facilitating rapid sampling of multiple binding-competent conformations in the free TCR. B) The energy landscape of CDR3α is more rugged than that of CDR3β, consisting of two more narrow wells separated by a higher energy barrier. Movement over the barrier between the two wells is controlled by hinges on either end of the CDR3α loop. Although the barrier is high in both directions, the relative energies of the two wells are unknown, indicated by the use of dashed lines to describe each well. Conformations sampled in one of the wells resemble that seen in the structure of the unbound TCR, whereas conformations sampled in the other resemble that seen in the structures of the bound TCR. The wells indicate some heterogeneity to account for fluctuations around the two general conformations. C) Depending on the stability of the TCR-pMHC intermediate, the landscape of CDR3α could lead to both conformational selection and induced-fit. For an induced-fit pathway, the energy of the intermediate present in the induced-fit pathway will be high, but will be reduced by increases in concentration 11; 29 and local conformational rearrangements.
Unlike CDR3β, the energy landscape for CDR3α is characterized by two more restricted conformational wells, separated by a high barrier that is gated by hinge rotations at the beginning and end of the loop (Fig. 7B). The conformations sampled in one of these wells are binding-incompetent, as evidenced by the overlaps between elements of the loop and HLA-A2 when the free and bound A6 structures are superimposed. The conformations sampled in the second well closely resemble the conformation adopted in the various A6-peptide/HLA-A2 crystal structures. The ability of CDR3α to sample a binding-competent state in the free TCR indicates that CDR3α may also participate in conformational selection, with ligand binding to the fraction of TCRs which in which CDR3α is binding-competent resulting in a redistribution of the conformational equilibrium in the free TCR. However, the high barrier in the CDR3α landscape and the resulting slower movement compared to CDR3β could also promote an induced-fit style interaction for the fraction of receptors for which CDR3α is incompetent, as shown in Fig. 7C. Although the probability of an induced-fit occurrence for CDR3α would be impacted by the presence of steric overlaps between CDR3α and HLA-A2, these could be forcibly avoided if binding is driven via interactions elsewhere in the interface (e.g., through interactions with the germline-encoded CDR1 or CDR2 loops and/or a binding-competent CDR3β conformation). High concentrations can also shift binding trajectories towards induced-fit pathways 11; 29, an effect which physiologically will be magnified for TCRs and their ligands due to membrane tethering.
Irrespective of the mechanisms by which it engages, the conformation adopted by CDR3α in the bound state of the A6 TCR does not vary with different peptides. While it is possible that a different conformation could be seen in a new crystallographic structure, the energy landscape of CDR3α indicates that adoption of another conformation will be slow and thermodynamically expensive. In contrast with CDR3β, CDR3α thus appears to limit A6 cross-reactivity to a reduced set of ligands compatible with this single CDR3α conformation. For peptides, this may translate into those with a glycine at peptide position 4. A glycine at position 4 is the only conserved amino acid at the peptide center in all known A6 ligands 30, and a hydrogen bond from Ser100α to the carbonyl of Gly4 is the only CDR3α-peptide interaction conserved in all 10 A6-peptide/HLA-A2 crystal structures. Not unexpectedly, A6 tolerates substitutions to Gly4 very poorly.
The conformational properties of CDR3α influence A6 TCR restriction towards HLA-A2
In addition to peptide specificity, the use of a single CDR3α conformation in the bound states of A6 also appears to contribute to specificity (i.e., restriction) towards HLA-A2. In all 10 A6-peptide/HLAA2 ternary complexes, CDR3α interacts with Arg65, Lys66, and Ala69 of the HLA-A2 α1 helix. Mutations at each of these sites substantially weakens A6 binding 31; 32; 33. The side chains of Arg65, Lys66, and Ala69 all clash with the binding-incompetent state of CDR3α, indicating that the contributions of these side chains to binding results not only from the formation of intermolecular interactions, but also the need to avoid what would otherwise be unfavorable steric clashes.
Interestingly, Arg65, Lys66, and Ala69 are all polymorphic sites in class I MHC molecules. The clashes with Arg65 are of particular interest, as they include backbone and β carbon atoms of the TCR and thus cannot all be resolved with side chain rotamer changes in the TCR. These clashes would be eliminated by replacement of Arg65 with shorter amino acids, such as the glutamine or asparagine present in most HLA-B alleles. Removal of these clashes would provide less energetic “incentive” for the loop to adopt a conformation compatible with HLA-A2. Thus, restriction of the A6 TCR towards HLA-A2 appears to be governed in part by how the conformational ensemble of CDR3α interfaces with HLA-A2.
Seemingly unproductive CDR loop flexibility may be a product of thymic selection
The energy landscape of CDR3α may at first glance be puzzling: as the CDR3α conformation is invariant in different ternary structures, why does the loop sample a binding-incompetent conformation at all, i.e., why is it not rigid and locked into a binding-competent form? One answer could be that the degree of CDR3α flexibility is simply a consequence of the amino acid sequence needed to ensure the loop can adopt a conformation compatible with peptide and HLA-A2. However, as with any TCR that has passed positive selection, A6 recognizes a number of self-antigens weakly 30. If A6 possessed a more rigid CDR3α loop, these self-antigens would be recognized with stronger affinities, possibly leading to deletion of A6-expressing T cell clones during negative selection. Thymic education may thus select for differing degrees flexibility not only to influence TCR cross-reactivity and MHC restriction, but as a strategy to tune receptor binding affinities.
The binding mechanism of A6 blends elements of both the conformer and two-step TCR binding models
The observation that both CDR3α and CDR3β sample conformations resembling their bound states in the free TCR is consistent with the conformer model for TCR cross-reactivity 10, which incorporates the general principles of conformational selection as traditionally envisioned. As discussed above however, it remains possible that CDR3α could also engage via an induced-fit mechanism, reflecting some aspects of the two-step TCR binding model 7. This “blending” of elements of two popular models for TCR recognition reflects the reality that conformational selection and induced-fit are extremes on a continuum 8, with actual binding mechanisms a complex function of multiple variables, including association kinetics, energies of binding intermediates, and the potentially disparate energy landscapes of interacting regions.
Furthermore, our emphasis here has been on the backbones of the hypervariable loops. Optimizations will be needed in some side chain positions, even for the germline-encoded loops whose backbones are pre-configured to bind. As has been seen for other proteins 34, some of these optimizations may proceed via an induced-fit mechanism, regardless of whether conformational selection occurs earlier during binding. Our discussion has also ignored the energy landscapes of peptide and MHC, which possess their own complexities 18. Nonetheless, it is clear that for the A6 TCR, specificity and cross-reactivity are essentially pre-programmed into the energy landscapes and the resulting conformational ensembles of the two CDR3 loops.
To what extent can the principles identified here be applied to other T cell receptors or TCR recognition in general? As noted above, TCR CDR3α and CDR3β loops show the greatest differences between free and bound receptors, and frequently adopt different conformations in the structures of a single TCR bound to multiple ligands 2. The murine 2C TCR, for which structures are also available with several ligands, shows considerable diversity in CDR3α as well as conserved positioning in CDR3β and the germline-encoded loops 3; 35; 36. While the 2C structures together with the NMR data available for the D10 TCR 12 suggests a theme regarding the intrinsic variability of TCR hypervariable vs. germline loops (if not CDR3α vs. CDR3β), similar dynamics measurements are not available for 2C. Further, it may be notable that among crystallographic structures of free TCRs, only four out of 13 have sufficiently weak electron density prohibiting the conformation of a hypervariable loop to be fully modeled (in addition to A6, the others are 2B4, ELS4, and 1.D9.B2) 37; 38; 39. While it thus seems reasonable to conclude that the hypervariable CDR loops will generally possess the greatest extent of intrinsic flexibility as seen here, additional data are needed to uncover the extent to which general trends exist in how such flexibility is utilized. In the interim, the data with A6 provide an instructional example against which the recognition mechanisms of other TCRs can be compared.
Lastly, the observation of disparate degrees of flexibility within a protein binding site and the consequences for cross-reactivity, specificity, and binding mechanism is instructive for protein-protein interactions in general. Of particular interest are other proteins with large numbers of binding partners, e.g., the “hubs” in protein interaction networks 40. Although conformational variability is one mechanism considered to underlie general binding promiscuity, the results here suggest a more nuanced consideration may be helpful. For example, taking cues from the limited variability of the A6 CDR3α loop, slow switching between discrete but relatively stable conformations in one region of a binding site could bias recognition between different classes of targets. Rapid fluctuations within a broad conformational ensemble elsewhere in the interface, as seen with A6 CDR3β, could then fine tune the recognition towards different targets within a class. As implied by the work with the A6 TCR, this view requires detailed studies not only of the rate limiting motions of a recognition protein, but the underlying energy landscapes of multiple regions.
Materials & Methods
Proteins and peptides
Soluble A6 and HLA-A2 were purified from refolded E. coli-expressed inclusion bodies as previously described 27. The TCR utilized an engineered disulfide bond across the constant domains for improved stability 41. Cysteine mutations were introduced via Quickchange mutagenesis (Stratagene). The S195C mutant of the HLA-A2 heavy chain was previously generated 21. The Tax and Tax-Y5F peptide were synthesized locally with an ABI 433A instrument or purchased commercially (Genscript). Peptides were chromatographically purified and validated via mass spectrometry.
X-ray crystallography
Crystals of the free A6 TCR were grown from 30% PEG 4000, 0.1 M TRIS, pH 8.5. Crystals of A6- Tax-Y5F/HLA-A2 were grown from 15% PEG 4000 in 0.1 M Tris, pH 8.5, 0.2 M MgCl2. Cryo-protection for all crystals consisted of 20–25% glycerol. Diffraction data were collected at Argonne National Laboratory at the indicated beamlines at 100 K. Data reduction, structure solution, refinement, and structure validation was performed as previously described 20, except that Phaser 42 was used to solve the free A6 structure and MolProbitiy 43 was utilized as an additional evaluation tool during and after refinement. Coordinates for the search model for the free A6 structure were from PDB entry 1QRN 19 with the pMHC and CDR loops removed. Coordinates for the search model for the Tax-Y5F complex were from PDB entry 2GJ6 20 with the peptide and CDR loops removed.
Time-resolved fluorescence anisotropy
Refolded and purified A6 or Tax/HLA-A2 single cysteine mutants in 20 mM phosphate, 75 mM NaCl, pH 7.0 at concentrations from 25 to 40 µM were labeled with a ten-fold molar excess of fluorescein-5-maleimide or BODIPY-FL maleimide (Invitrogen) together with 10 – 20 µM TCEP to prevent formation of disulfide-linked dimers. The final volumes of the labeling reactions were 0.5–1.0 mL. After mixing for 45 minutes at room temperature, excess label was removed by dialysis followed by size exclusion chromatography. Parallel labeling reactions with wild-type protein containing no free cysteine were used to evaluate non-specific labeling. Labeling efficiencies ranged from 11–80% as determined by A280/A495 ratios. Non-specific labeling never exceeded 2%. UV images of reduced/non-reduced SDS-PAGE gels verified that fluorescence emanated only from the chain with the cysteine mutant. Fluorescence intensity measurements collected with a Beacon 2000 instrument (Invitrogen) confirmed that wild-type protein had insignificant amounts of non-covalently associated label.
Time-correlated single-photon counting (TCSPC) fluorescence lifetimes and anisotropies of labeled A6 TCR mutants were measured at 25 °C using a HORIBA Jobin Yvon 5000U FluoroCube (fluorescein samples) or a FluoroLog 3 (BODIPY-FL samples) spectrofluorometer. Samples were excited with a 457-nm or 460-nm NanoLED pulsed diodes at a repetition rate of 1 MHz, and time-correlated single-photon-counting by TBX-04 or TBX-05 detectors was collected at an emission wavelength of 515 nm. Anisotropy measurements were collected as the emission polarizer was toggled between parallel and perpendicular positions relative to the vertically oriented excitation polarizer until a minimum peak difference of 10,000 counts was reached. The G-factor was experimentally determined to adjust for polarization bias. Data were analyzed by the sum/difference impulse reconvolution approach 22; 23; 24, in which a fit of the decay of the emission intensity free of anisotropy effects is used to constrain a fit of the intensity decay including anisotropy effects. The data were best fit by a biexponential function to account for depolarization with two time constants:
where r is the anisotropy at time t, θf and θs are fast and slow correlation times and βf and βs are the associated amplitudes. Independently collected lifetime measurements did not vary from values calculated from the total emission decay. Fluorescence lifetimes did not vary appreciably with labeling position. Reported values for the time constants and amplitudes are the averages and standard deviations of a minimum of seven separate measurements.
Molecular dynamics simulations
MD simulations and analysis were performed using the AMBER 10 suite 44 utilizing the ff99sb force field 45. The starting coordinates of the A6 TCR were taken from the first molecule in the asymmetric unit of the free A6 structure, for which the electron density of CDR3α and CDR3β was most complete (the “forward” simulation), or from the structure of A6 bound to Tax-P6A/HLA-A2 19 leaving out the pMHC (the “reverse” simulation). Molecules were neutralized with sodium ions and solvated using SPC/E waters. Molecules were energy minimized and heated to 300K using a Langevin thermostat 46. After minimization, solute restraints were gradually relaxed from 25 to 0 kcal/mol/Å2 over 100 ps of dynamics while keeping the pressure at 1 atm. The volume was then fixed and temperature constraints removed to convert to a NVE ensemble. Equilibration consisted of 2 ns of dynamics. Production simulation consisted of 40 ns of dynamics, utilizing a 2 fs time step and the SHAKE algorithm. Additional simulations were produced starting with the 5, 10, 15, and 20 ns coordinate files from the first 40 ns simulation. To ensure statistical independence, each new simulation was re-equilibrated and run for an additional 40 ns (100 ns for the 15 ns, “third segment” branch). B-factors, RMSD plots, dihedral angles, and superimpositions were calculated using the ptraj program of the AMBER suite.
Isothermal titration calorimetry
Titration calorimetry was performed with a Microcal VP-ITC (GE Healthcare). Titrations were performed with TCR in the syringe and pMHC in the calorimeter cell. Starting concentrations were 15 µM for pMHC and 150 µM for TCR. Solution conditions were 20 mM HEPES, 150 mM NaCl, pH 7.4, 4 °C. ITC injection volumes were 10 µL and injections were performed over 12 s spaced 300 s apart to allow for a return to baseline. A separate titration of TCR into buffer was performed to account for heats of dilution. Data were processed and integrated with the software distributed with the instrument. Data were fit to a single site binding model with the nonlinear fitting package using OriginPro 7.5 (OriginLabs). The first data point was excluded from analysis due to dilution across the injection needle tip.
Supplementary Material
Acknowledgements
We thank Cynthia Piepenbrink for outstanding technical assistance and Prashant Kamat, Karen Gall, and Jim Mattheis for use of TCSPC instruments. Supported by grant GM067079 from NIGMS, NIH. Support for simulations was provided by the Notre Dame Center for Research Computing. Use of calorimetric instrumentation was supported by grant RR27898 from NIGMS. DRS was supported by a fellowship from the Notre Dame CBBI program, funded by grant T32GM075762 from NIGMS. Results shown in this report are derived from work performed at the Structural Biology Center and Life Science Collaborative Access Team (LS-CAT) at the Advanced Photon Source of Argonne National Laboratory. Argonne is operated by UChicago Argonne, LLC, for the U.S. Department of Energy, Office of Biological and Environmental Research under contract DE-AC02-06CH11357. Use of the LS-CAT Sector 21 was supported by the Michigan Economic Development Corporation and the Michigan Technology Tri-Corridor (grant 085P1000817).
Footnotes
Publisher's Disclaimer: This is a PDF file of an unedited manuscript that has been accepted for publication. As a service to our customers we are providing this early version of the manuscript. The manuscript will undergo copyediting, typesetting, and review of the resulting proof before it is published in its final citable form. Please note that during the production process errors may be discovered which could affect the content, and all legal disclaimers that apply to the journal pertain.
Accession numbers: Coordinates and structure factors have been deposited in the Protein Data Bank with accession number 3QH3 and 3QFJ.
References
- 1.Mason D. A very high level of cross-reactivity is an essential feature of the T-cell receptor. Immunology Today. 1998;19:395–404. doi: 10.1016/s0167-5699(98)01299-7. [DOI] [PubMed] [Google Scholar]
- 2.Armstrong KM, Piepenbrink KH, Baker BM. Conformational changes and flexibility in T-cell receptor recognition of peptide-MHC complexes. Biochem J. 2008;415:183–196. doi: 10.1042/BJ20080850. [DOI] [PMC free article] [PubMed] [Google Scholar]
- 3.Jones LL, Colf LA, Stone JD, Garcia KC, Kranz DM. Distinct CDR3 Conformations in TCRs Determine the Level of Cross-Reactivity for Diverse Antigens, but Not the Docking Orientation. J Immunol. 2008;181:6255–6264. doi: 10.4049/jimmunol.181.9.6255. [DOI] [PMC free article] [PubMed] [Google Scholar]
- 4.Mazza C, Auphan-Anezin N, Gregoire C, Guimezanes A, Kellenberger C, Roussel A, Kearney A, van der Merwe PA, Schmitt-Verhulst AM, Malissen B. How much can a T-cell antigen receptor adapt to structurally distinct antigenic peptides? EMBO J. 2007;26:1972–1983. doi: 10.1038/sj.emboj.7601605. [DOI] [PMC free article] [PubMed] [Google Scholar]
- 5.Reiser JB, Darnault C, Gregoire C, Mosser T, Mazza G, Kearney A, van der Merwe PA, Fontecilla-Camps JC, Housset D, Malissen B. CDR3 loop flexibility contributes to the degeneracy of TCR recognition. Nat Immunol. 2003;4:241–247. doi: 10.1038/ni891. [DOI] [PubMed] [Google Scholar]
- 6.Burrows SR, Chen Z, Archbold JK, Tynan FE, Beddoe T, Kjer-Nielsen L, Miles JJ, Khanna R, Moss DJ, Liu YC, Gras S, Kostenko L, Brennan RM, Clements CS, Brooks AG, Purcell AW, McCluskey J, Rossjohn J. Hard wiring of T cell receptor specificity for the major histocompatibility complex is underpinned by TCR adaptability. Proceedings of the National Academy of Sciences. 2010;107:10608–10613. doi: 10.1073/pnas.1004926107. [DOI] [PMC free article] [PubMed] [Google Scholar]
- 7.Wu LC, Tuot DS, Lyons DS, Garcia KC, Davis MM. Two-step binding mechanism for T-cell receptor recognition of peptide MHC. Nature. 2002;418:552–556. doi: 10.1038/nature00920. [DOI] [PubMed] [Google Scholar]
- 8.Csermely P, Palotai R, Nussinov R. Induced fit, conformational selection and independent dynamic segments: an extended view of binding events. Trends in biochemical sciences. 2010;35:539–546. doi: 10.1016/j.tibs.2010.04.009. [DOI] [PMC free article] [PubMed] [Google Scholar]
- 9.Boehr DD, Nussinov R, Wright PE. The role of dynamic conformational ensembles in biomolecular recognition. Nature chemical biology. 2009;5:789–796. doi: 10.1038/nchembio.232. [DOI] [PMC free article] [PubMed] [Google Scholar]
- 10.Holler PD, Kranz DM. T cell receptors: affinities, cross-reactivities, and a conformer model. Molecular Immunology. 2004;40:1027–1031. doi: 10.1016/j.molimm.2003.11.013. [DOI] [PubMed] [Google Scholar]
- 11.Hammes GG, Chang YC, Oas TG. Conformational selection or induced fit: a flux description of reaction mechanism. Proceedings of the National Academy of Sciences of the United States of America. 2009;106:13737–13741. doi: 10.1073/pnas.0907195106. [DOI] [PMC free article] [PubMed] [Google Scholar]
- 12.Hare BJ, Wyss DF, Osburne MS, Kern PS, Reinherz EL, Wagner G. Structure, specificity and CDR mobility of a class II restricted single-chain T-cell receptor. Nat Struct Biol. 1999;6:574–581. doi: 10.1038/9359. [DOI] [PubMed] [Google Scholar]
- 13.Gakamsky DM, Lewitzki E, Grell E, Saulquin X, Malissen B, Montero-Julian F, Bonneville M, Pecht I. Kinetic evidence for a ligand-binding-induced conformational transition in the T cell receptor. Proceedings of the National Academy of Sciences. 2007 doi: 10.1073/pnas.0707061104. 0707061104. [DOI] [PMC free article] [PubMed] [Google Scholar]
- 14.Armstrong KM, Insaidoo FK, Baker BM. Thermodynamics of T-cell receptor-peptide/MHC interactions: progress and opportunities. Journal of Molecular Recognition. 2008;21:275–287. doi: 10.1002/jmr.896. [DOI] [PMC free article] [PubMed] [Google Scholar]
- 15.Garcia KC, Adams EJ. How the T cell receptor sees antigen - A structural view. Cell. 2005;122:333–336. doi: 10.1016/j.cell.2005.07.015. [DOI] [PubMed] [Google Scholar]
- 16.Garboczi DN, Ghosh P, Utz U, Fan QR, Biddison WE, Wiley DC. Structure of the complex between human T-cell receptor, viral peptide and HLA-A2. Nature. 1996;384:134–141. doi: 10.1038/384134a0. [DOI] [PubMed] [Google Scholar]
- 17.Borbulevych OY, Piepenbrink KH, Baker BM. Conformational Melding Permits a Conserved Binding Geometry in TCR Recognition of Foreign and Self Molecular Mimics. J Immunol. 2011;186:2950–2958. doi: 10.4049/jimmunol.1003150. [DOI] [PMC free article] [PubMed] [Google Scholar]
- 18.Borbulevych OY, Piepenbrink KH, Gloor BE, Scott DR, Sommese RF, Cole DK, Sewell AK, Baker BM. T cell receptor cross-reactivity directed by antigen-dependent tuning of peptide-MHC molecular flexibility. Immunity. 2009;31:885–896. doi: 10.1016/j.immuni.2009.11.003. [DOI] [PMC free article] [PubMed] [Google Scholar]
- 19.Ding YH, Baker BM, Garboczi DN, Biddison WE, Wiley DC. Four A6-TCR/peptide/HLA-A2 structures that generate very different T cell signals are nearly identical. Immunity. 1999;11:45–56. doi: 10.1016/s1074-7613(00)80080-1. [DOI] [PubMed] [Google Scholar]
- 20.Gagnon SJ, Borbulevych OY, Davis-Harrison RL, Turner RV, Damirjian M, Wojnarowicz A, Biddison WE, Baker BM. T Cell Receptor Recognition via Cooperative Conformational Plasticity. Journal of Molecular Biology. 2006;363:228–243. doi: 10.1016/j.jmb.2006.08.045. [DOI] [PubMed] [Google Scholar]
- 21.Piepenbrink KH, Borbulevych OY, Sommese RF, Clemens J, Armstrong KM, Desmond C, Do P, Baker BM. Fluorine substitutions in an antigenic peptide selectively modulate T-cell receptor binding in a minimally perturbing manner. Biochemical Journal. 2009;423:353–361. doi: 10.1042/BJ20090732. [DOI] [PMC free article] [PubMed] [Google Scholar]
- 22.Boyd AE, Dunlop CS, Wong L, Radic Z, Taylor P, Johnson DA. Nanosecond Dynamics of Acetylcholine-sterase Near the Active Center Gorge. J. Biol. Chem. 2004;279:26612–26618. doi: 10.1074/jbc.M401482200. [DOI] [PubMed] [Google Scholar]
- 23.Hibbs RE, Radic Z, Taylor P, Johnson DA. Influence of Agonists and Antagonists on the Segmental Motion of Residues near the Agonist Binding Pocket of the Acetylcholine-binding Protein. J. Biol. Chem. 2006;281:39708–39718. doi: 10.1074/jbc.M604752200. [DOI] [PubMed] [Google Scholar]
- 24.Shi J, Tai K, McCammon JA, Taylor P, Johnson DA. Nanosecond Dynamics of the Mouse Acetylcholinesterase Cys69–Cys96 Omega Loop. J. Biol. Chem. 2003;278:30905–30911. doi: 10.1074/jbc.M303730200. [DOI] [PubMed] [Google Scholar]
- 25.Lakowicz JR. Principles of Fluorescence Spectroscopy. 3rd edit. Springer; 2006. [Google Scholar]
- 26.Davis-Harrison RL, Insaidoo FK, Baker BM. T Cell Receptor Binding Transition States and Recognition of Peptide/MHC. Biochemistry. 2007;46:1840–1850. doi: 10.1021/bi061702p. [DOI] [PubMed] [Google Scholar]
- 27.Davis-Harrison RL, Armstrong KM, Baker BM. Two Different T Cell Receptors use Different Thermodynamic Strategies to Recognize the Same Peptide/MHC Ligand. Journal of Molecular Biology. 2005;346:533–550. doi: 10.1016/j.jmb.2004.11.063. [DOI] [PubMed] [Google Scholar]
- 28.Armstrong KM, Baker BM. A Comprehensive Calorimetric Investigation of an Entropically Driven T Cell Receptor-Peptide/Major Histocompatibility Complex Interaction. Biophys. J. 2007;93:597–609. doi: 10.1529/biophysj.107.104570. [DOI] [PMC free article] [PubMed] [Google Scholar]
- 29.Weikl TR, von Deuster C. Selected-fit versus induced-fit protein binding: kinetic differences and mutational analysis. Proteins. 2009;75:104–110. doi: 10.1002/prot.22223. [DOI] [PubMed] [Google Scholar]
- 30.Hausmann S, Biddison WE, Smith KJ, Ding YH, Garboczi DN, Utz U, Wiley DC, Wucherpfennig KW. Peptide recognition by two HLA-A2/Tax11–19-specific T cell clones in relationship to their MHC/peptide/TCR crystal structures. J Immunol. 1999;162:5389–5397. [PubMed] [Google Scholar]
- 31.Baker BM, Turner RV, Gagnon SJ, Wiley DC, Biddison WE. Identification of a Crucial Energetic Footprint on the α1 Helix of Human Histocompatibility Leukocyte Antigen (HLA)-A2 That Provides Functional Interactions for Recognition by Tax Peptide/HLA-A2-specific T Cell Receptors. J. Exp. Med. 2001;193:551–562. doi: 10.1084/jem.193.5.551. [DOI] [PMC free article] [PubMed] [Google Scholar]
- 32.Baxter TK, Gagnon SJ, Davis-Harrison RL, Beck JC, Binz A-K, Turner RV, Biddison WE, Baker BM. Strategic mutations in the class I MHC HLA-A2 independently affect both peptide binding and T cell receptor recognition. J. Biol. Chem. 2004;279:29175–29184. doi: 10.1074/jbc.M403372200. [DOI] [PubMed] [Google Scholar]
- 33.Gagnon SJ, Borbulevych OY, Davis-Harrison RL, Baxter TK, Clemens JR, Armstrong KM, Turner RV, Damirjian M, Biddison WE, Baker BM. Unraveling a Hotspot for 22 TCR Recognition on HLA-A2: Evidence Against the Existence of Peptide-independent TCR Binding Determinants. Journal of Molecular Biology. 2005;353:556. doi: 10.1016/j.jmb.2005.08.024. [DOI] [PubMed] [Google Scholar]
- 34.Wlodarski T, Zagrovic B. Conformational selection and induced fit mechanism underlie specificity in noncovalent interactions with ubiquitin. Proceedings of the National Academy of Sciences of the United States of America. 2009;106:19346–19351. doi: 10.1073/pnas.0906966106. [DOI] [PMC free article] [PubMed] [Google Scholar]
- 35.Garcia KC, Degano M, Pease LR, Huang M, Peterson PA, Teyton L, Wilson IA. Structural basis of plasticity in T cell receptor recognition of a self peptide-MHC antigen. Science. 1998;279:1166–1172. doi: 10.1126/science.279.5354.1166. [DOI] [PubMed] [Google Scholar]
- 36.Colf LA, Bankovich AJ, Hanick NA, Bowerman NA, Jones LL, Kranz DM, Garcia KC. How a Single T Cell Receptor Recognizes Both Self and Foreign MHC. Cell. 2007;129:135–146. doi: 10.1016/j.cell.2007.01.048. [DOI] [PubMed] [Google Scholar]
- 37.Kjer-Nielsen L, Clements CS, Brooks AG, Purcell AW, McCluskey J, Rossjohn J. The 1.5 A crystal structure of a highly selected antiviral T cell receptor provides evidence for a structural basis of immunodominance. Structure. 2002;10:1521–1532. doi: 10.1016/s0969-2126(02)00878-x. [DOI] [PubMed] [Google Scholar]
- 38.Newell EW, Ely LK, Kruse AC, Reay PA, Rodriguez SN, Lin AE, Kuhns MS, Garcia KC, Davis MM. Structural Basis of Specificity and Cross-Reactivity in T Cell Receptors Specific for Cytochrome c-I-E. Journal of immunology. 2011;186:5823–5832. doi: 10.4049/jimmunol.1100197. [DOI] [PMC free article] [PubMed] [Google Scholar]
- 39.McBeth C, Seamons A, Pizarro JC, Fleishman SJ, Baker D, Kortemme T, Goverman JM, Strong RK. A New Twist in TCR Diversity Revealed by a Forbidden [alpha][beta] TCR. Journal of Molecular Biology. 2008;375:1306–1319. doi: 10.1016/j.jmb.2007.11.020. [DOI] [PMC free article] [PubMed] [Google Scholar]
- 40.Tsai C-J, Ma B, Nussinov R. Protein–protein interaction networks: how can a hub protein bind so many different partners? Trends in Biochemical Sciences. 2009;34:594–600. doi: 10.1016/j.tibs.2009.07.007. [DOI] [PMC free article] [PubMed] [Google Scholar]
- 41.Boulter JM, Glick M, Todorov PT, Baston E, Sami M, Rizkallah P, Jakobsen BK. Stable, soluble T-cell receptor molecules for crystallization and therapeutics. Protein Eng. 2003;16:707–711. doi: 10.1093/protein/gzg087. [DOI] [PubMed] [Google Scholar]
- 42.McCoy AJ, Grosse-Kunstleve RW, Adams PD, Winn MD, Storoni LC, Read RJ. Phaser crystallographic software. J Appl Crystallogr. 2007;40:658–674. doi: 10.1107/S0021889807021206. [DOI] [PMC free article] [PubMed] [Google Scholar]
- 43.Chen VB, Arendall WB, 3rd, Headd JJ, Keedy DA, Immormino RM, Kapral GJ, Murray LW, Richardson JS, Richardson DC. MolProbity: all-atom structure validation for macromolecular crystallography. Acta Crystallogr D Biol Crystallogr. 2010;66:12–21. doi: 10.1107/S0907444909042073. [DOI] [PMC free article] [PubMed] [Google Scholar]
- 44.Case DA, Cheatham TE, Darden T, Gohlke H, Luo R, Merz KM, Onufriev A, Simmerling C, Wang B, Woods RJ. The Amber biomolecular simulation programs. Journal of Computational Chemistry. 2005;26:1668–1688. doi: 10.1002/jcc.20290. [DOI] [PMC free article] [PubMed] [Google Scholar]
- 45.Hornak V, Abel R, Okur A, Strockbine B, Roitberg A, Simmerling C. Comparison of multiple Amber force fields and development of improved protein backbone parameters. Proteins. 2006;65:712–725. doi: 10.1002/prot.21123. [DOI] [PMC free article] [PubMed] [Google Scholar]
- 46.Furse KE, Corcelli SA. The dynamics of water at DNA interfaces: computational studies of Hoechst 33258 bound to DNA. J Am Chem Soc. 2008;130:13103–13109. doi: 10.1021/ja803728g. [DOI] [PubMed] [Google Scholar]
Associated Data
This section collects any data citations, data availability statements, or supplementary materials included in this article.