

Abstract
Purpose
Recent advances in drug discovery have led to the development of a number of therapeutic macromolecules for treatment of posterior eye diseases. We aimed to investigate the clearance of macromolecular contrast probes (polymers conjugated with Gd-chelate) in the vitreous after intravitreal injections with the recently developed ms-DSEPI-T12 MRI and to examine the degradation of disulfide-containing biodegradable polymers in the vitreous humor in vivo.
Methods
Intravitreal injections of model contrast agents poly[N-(2-hydroxypropyl)methacrylamide]-GG-1,6-hexanediamine-(Gd-DO3A), biodegradable (Gd-DTPA)-cystine copolymers, and MultiHance were performed in rabbits; their distribution and elimination from the vitreous after injections were determined by MRI.
Results
Times for macromolecular contrast agents to decrease to half their initial concentrations in the vitreous ranged from 0.4–1.3 days post-injection. Non-biodegradable polymers demonstrated slower vitreal clearance than those of disulfide-biodegradable polymers. Biodegradable polymers had similar clearance as MultiHance.
Conclusions
Usefulness of T1 mapping and ms-DSEPI-T12 MRI to study ocular pharmacokinetics was demonstrated. Results suggest an enzymatic degradation mechanism for the disulfide linkage in polymers in the vitreous leading to breakup of polymers in vitreous humor over time.
Keywords: biodegradable polymer, MRI, ms-DSEPI-T12, ocular pharmacokinetics, vitreous humors
INTRODUCTION
In recent years, significant advances have been made in the treatment of blindness-related eye diseases such as age-related macular degeneration and diabetic retinopathies. For diseases of the anterior parts of the eye, the common route of administration is topical eye drop. However, topical administration generally does not effectively deliver drugs to the tissues at the back of the eye. Systemic administration is usually not preferred because of the resulting systemic toxicity. An effective and robust drug delivery system for the treatment of posterior segment diseases is still not available. Intravitreal injection remains the preferred route of drug administration to the posterior segment of the eye (1–3).
Biodegradable polymers have been employed in targeted drug delivery in the eye and as a drug delivery matrix for sustained ocular delivery (4,5). Disulfide-containing polymers have been used as biomaterial platforms in the development of drug and gene delivery systems due to their biocompatibility and targetability (6). For example, these reduction-sensitive drug delivery systems have been evaluated as bioresponsive polymeric nanocarriers and temperature sensitivity block copolymers (4,7). One of the characteristics of the disulfide linkages is that at times the disulfide bond can be relatively stable in body fluids but can go through rapid cleavage under other conditions such as enzymatic degradation. The study of ocular distribution of disulfide-biodegradable synthetic polymers in the eye could help pharmaceutical scientists understand the drug delivery mechanism and clearance after intravitreal administration of these drug delivery systems.
Improvement of eye disease treatment based on novel drug delivery methods depends on reliable pharmacokinetics data and the understanding of drug delivery and clearance mechanisms in the eye (8,9). The investigation of ocular pharmacokinetics by traditional methods is invasive and can severely disturb the biodistribution of pharmaceuticals during dissection in animals (10). Recent studies have demonstrated the feasibility of MRI for noninvasive monitoring of the biodistribution of pharmaceuticals in the body in drug delivery research (9,11–13). MRI is particularly useful in ocular research to study, for example, the flux-enhancing mechanisms of ocular iontophoresis, the release kinetics from an ocular implant, the least resistive route for transscleral penetration, and the locations of the periocular and intraocular depots in periocular, intrascleral, and intravitreal administration (10,14–22). In these MRI studies, quantitative measurements of the concentration of contrast agent were performed by comparing the signal intensities of the voxel in the region of interest (ROI) and a calibration curve. The calibration curves were constructed by MRI of contrast agent solution standards or standards of contrast agent in hydroxypropyl methylcellulose. This method of converting the signal intensity to contrast agent concentration can be affected by errors such as variability due to MRI hardware, coil positioning, and experimental setup as well as by the non-linear signal intensity-to-concentration relationship.
In the present study, a new quantitative method was employed in an MRI study of macromolecules conjugated with gadolinium-chelate (Gd-chelate) that were injected into the vitreous of the rabbit eye. These macromolecules are drug surrogates to study the clearance of macromolecules in ocular drug delivery. For the accurate quantification of the contrast agent concentration, the change in the relaxation rate (ΔR1) was measured using 3D multishot double spin echo-planar imaging with automated variation of TR and TE (ms-DSEPI-T12) (23), which offers rapid and dynamic T1 measurement; ΔR1 is known to be directly proportional to the concentration of the Gd-based contrast agent, unlike MRI signal intensity, which is not linear to the local concentration of the paramagnetic ion. The objectives of the present study were therefore to (a) demonstrate the applicability of the ms-DSEPI-T12 method in MRI ocular pharmacokinetic study, (b) examine disulfide bond degradation in the vitreous humor with polymerized biodegradable/nonbiodegradable compounds, and (c) study the clearance of macromolecules in the vitreous after intravitreal injections with MRI.
MATERIALS AND METHODS
Materials
Polymers poly[N-(2-hydroxypropyl)methacrylamide]-GlyGly-1,6-hexanediamine-(Gd-DO3A) (abbreviation: PHPMA-GG-1,6-hexanediamine-(Gd-DO3A) or PGH) of molecular weights 20 kDa and 90 kDa were synthesized using a method similar to that described previously (24). The polymers were then prepared in saline at concentration of 1.3 μmol-Gd per mL. Biodegradable polymers (Gd-DTPA)-cystine copolymers (abbreviation: GDCP) of molecular weights 21 kDa and 144 kDa were synthesized as described previously (25) and prepared in saline at concentration of 1.3 μmol-Gd per mL. The molecular structures of PGH and GDCP are shown in Fig. 1a, b, respectively. MultiHance™ (Bracco Diagnostics, Inc.) was prepared in saline at the same concentration (1.3 μmol-Gd per mL) and used as a reference.
Fig. 1.

(a) PHPMA-GG-1,6-hexanediamine-(Gd-DO3A). (b) GDCP: (Gd-DTPA)-Cystine copolymers.
MRI Phantom Experiment
MRI studies were performed on a Clinical 3T MRI system (Trio, Siemens Medical Solutions, Erlangen, Germany) with Avanto gradients (45 mT/m strength and 200 T/m/s slew rate) at room temperature (~25°C). Phantom experiments were conducted to determine the relationship between signal intensity and six GDCP (144 kDa) concentrations. T1 relaxivity was measured using inversion-recovery spin-echo on a series of phantoms filled with different concentrations of PGH20, PGH90, GDCP21, and MultiHance™. 12-element receive-only coil with body coil excitation was used on phantom with the following scan parameters: FOV=200× 150 mm2, matrix size=256×192, slice thickness=2.5 mm, TR/TE=5000/16 ms, inversion recovery time=25, 35, 50, 75, 100, 200, 400, 800 and 1600 ms, respectively.
MRI Animal Experiment
New Zealand White rabbits (weight ~3 kg) were used with the approval of the Institutional Animal Care and Usage Committee at the University of Utah. The animals were anesthetized by the intramuscular injection of a cocktail of 1 ml Ketamine (100 mg/ml) and 1 ml Xylazine (15 mg/ml). Intravitreal injections of 100 μL PGH or GDCP at 1.3 μmol-Gd per mL were performed using a 0.5-inch 29-gauge needle at the pars plana. Intravitreal injections of a corresponding dose of Multihance™ were performed on the opposite eyes using the same procedure. Following the injections, rabbit MRI was performed on the Clinical 3T MRI system. After the MRI scans, the animals were returned to their cage and allowed normal access to food and water.
T1 weighted spin echo and saturation-recovery multishot spin-echo EPI (3D multishot double spin-echo EPI: 3D ms-DSEPI-T12) pulse sequences were applied at each dynamic time point to acquire the T1 weighted-spin echo images and T1 maps, respectively. The in vivo T1 relaxation times were measured before and after contrast agent injection into the vitreous humor. Briefly, in T1 and T2 mapping imaging using 3D ms-DSEPI-T12 (23), the recovery times (TR) and the echo times (TE) that are relevant time variables for the fitting were varied automatically within the pulse sequence for entire data collection. The imaging parameters for the T1 weighted imaging were 0.4×0.4×1.0 mm3 spatial resolution, 256× 160 acquisition matrix, receiver bandwidth 250 Hz/pixel, and TR/TE 602/11 ms. Images were acquired consecutively before and at different time points after the injection of PGH, GDCP, and MultiHance™. The imaging parameters for the T1 mapping were FOV 128×40×24 mm3, acquisition matrix 128×40×12, spatial resolution 1.0×1.0×2.0 mm3, receiver bandwidth of 1.086 kHz/pixel, echotrain length (ETL) 7, and TRs/TEs of 138/32, 338/42, 738/52, 1528/62, 2318/72 and 3108/82 ms. The total scan time for each time-point was 6 min.
Data Processing
Rabbit vitreous humor T1 maps were calculated for each slice using a non-linear least-squares three-parameter fitting algorithm for a given time point. The in vivo T1 relaxation time is then used to construct the change in the relaxation rate using . The temporal change of T1 relaxation rates in rabbit vitreous following a contrast agent injection was investigated by summing ΔR1 over the whole vitreous humor. For a given animal, rabbit eye anatomical region was manually segmented to cover the whole vitreous humor. Because the concentration of the contrast agent is proportional to the T1 relaxation rates, ΔR1 = r1 Cmolecule , where r1 is the molecule relaxivity and Cmolecule is the concentration of the contrast agent, the amount of the contrast agent in each voxel is proportional to T1. The total average concentration of the contrast agent in the vitreous (Ctotal) at each time point (or the total amount of contrast agent in the vitreous humor divided by the volume of the vitreous) can therefore be calculated:
| (1) |
where Nvoxel is the total number of voxel in the measurement, Vvoxel is the voxel volume, and background is the value determined using the same method but with control rabbits without the injection of the contrast agent. The relaxivity r1 was measured using phantoms containing the contrast agent (see T1 relaxivity presented in Table I). The concentration-time profiles of the contrast agent in the vitreous were then analyzed.
Table I.
T1 Relaxivity of GDCP, MultiHance and PGH
| GDCP | MultiHance™ | PGH | |||
|---|---|---|---|---|---|
| Molecular Weight (kDa) | 21 | 144 | 1.1 | 20 | 90 |
| T1 relaxivity (r1) (mM−1s−1) | 5.4 | 8.2 | 4.2 | 11.7 | 10.9 |
RESULTS
MRI Phantom Experiment: T1 Relaxivity of GDCP, MultiHance, and PGH
Figure 2a, b presents the representative profiles of the changes of the relative signal intensity and the relaxation rate ΔR1 as a function of GDCP concentration. The relative signal intensity was defined as the ratio of images acquired with GDCP and reference image without GDCP, which were measured using the inversion recovery spin echo pulse sequence. The relationship between the signal intensity and the Gd concentration is non-linear, as illustrated in Fig. 2a, where the negative sign of signal intensity indicates the inverted longitudinal magnetization vector (anti-parallel to the applied magnetic field B0) after 180° inversion RF pulse. The non-linear relationship between signal intensity (SI) and contrast agent concentration could introduce substantial errors in estimating the concentration and the subsequent pharmacokinetic evaluation. On the contrary, the change of inverse T1 exhibits linear correlation with respect to GDCP concentration as shown in Fig. 2b.
Fig. 2.

Plots of (a) inversion-recovery spin-echo signal intensity and (b) ΔR1 with respect to GDCP concentration in solution phantom. SI and S0 are signal intensity acquired with and without GDCP in phantom, respectively. Negative sign in signal intensity indicates inverted longitudinal magnetization vector after 180° inversion RF pulse.
Table I summarizes the T1 relaxivities of the contrast agents in the present study. T1 relaxivity for gadolinium-based chelates is determined mainly by three factors: the exchange time between the water molecule being bound to the Gd and in bulk solution, the electron relaxation time of Gd, and the tumbling time of Gd. As the molecular weight increases, the longer tumbling time allows the other two factors to dominate. Relaxivity among biodegradable polymers GDCP144 and GDCP21 increases with increasing polymer molecular weight. For the non-biodegradable polymers PGH20 and PGH90, the polymer molecular weight does not significantly affect PGH relaxivity.
MRI Animal Experiment: Ocular Clearance After Intravitreal Injection
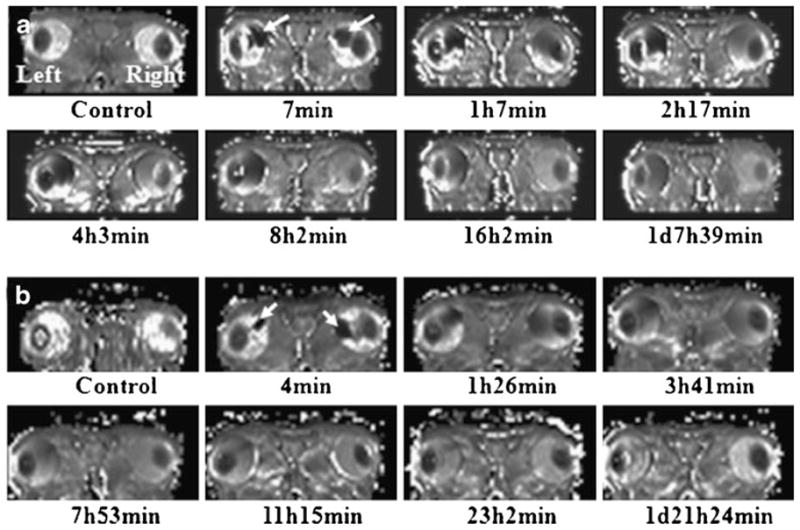
Figure 3a, b shows the representative MR images at different stages after the injection of non-biodegradable PGH20 (left) and MultiHance (right) and biodegradable GDCP21 (left) and MultiHance (right), respectively. The MR images show clear differences between the post-injection distributions of PGH20, GDCP21, and MultiHance in the rabbit eyes. MultiHance was administered into the vitreous for comparison. Due to the introduction of these contrast agents, T1 value near the administration site was shortened, and signal intensity around the administration site was enhanced: these sites are demonstrated by white arrows in Fig. 3a, b. The MR images of MultiHance and GDCP21 show that signal enhancement disappears around 1 day after intravitreal administration. Figure 4a shows the representative T1 maps of non-biodegradable PGH20 (left) and MultiHance (right). Unlike signal intensity contrast images that usually have coupling effects of multiple mechanisms, T1 map contrast is uniquely determined by relative T1 amplitude in the vitreous region, which is dynamically altered as contrast agent diffuses and clears out. In the present experiment, a significant amount of PGH was observed even after 3 days based on the T1 maps. On the contrary, MultiHance shows rapid clearance from the vitreous compared to PGH. Figure 4b presents the T1 maps of GDCP and MultiHance in similar experimental settings. The arrows point to the administration sites. The data show that clearance of GDCP from the vitreous is faster than that of PGH.
Fig. 3.

Representative T1 weighted spin echo images for (a) PGH20 (L) and MultiHance (R) and (b) GDCP21 (L) and MultiHance (R), where L and R represent left eye and right eye, respectively. Day, hour and minute are abbreviated as d, h and min, respectively. White arrows show the injection sites of the contrast agents.
Fig. 4.
Representative time varied T1 map computed using MR images acquired with ms-DSEPI- T12 for (a) PGH20 (L) and MultiHance (R) and (b) GDCP21 (L) and MultiHance (R), respectively. White arrows show the injection sites of the contrast agents.
The concentration-time profiles of PGH in the vitreous are plotted in Fig. 5a. During the early time period post-injection, PGH90 concentration increases with time after the injection and then gradually decreases over time from approximate 4 h after injection to the end of the experiment. The increase of the mean concentration in the vitreous at the first several time points after injection is puzzling and likely related to T1 overestimation that will be discussed later in the Discussion section. From the results in Fig. 5a, a significant amount of PGH90 was still observed in the vitreous even at 3 days post-injection. A similar trend in the PGH20 concentration profile was observed. PGH20 concentration reaches its maximum around 2 h after the injection and is cleared faster from the vitreous than PGH90. These plots suggest that clearance for the non-biodegradable polymers is a slow process in the vitreous and is related to the molecular weight of the polymers.
Fig. 5.

Concentration-time profile of (a) non-biodegradable PGH (20 and 90 kDa) and (b) biodegradable GDCP (21 and 144 kDa). The concentration-time profiles of MultiHance in (a) and (b) are shown as reference.
In Fig. 5a, different clearance behavior was observed in concentration-time plot of MultiHance compared with that of PGH. MultiHance does not show an initial increase in concentration, and its concentration decreases quickly with time until all residual MultiHance is cleared. For GDCP in Fig. 5b, the biodegradable polymers exhibit different clearance patterns compared to those of PGH. Both GDCP21 and GDCP144 concentrations in the vitreous humor decrease relatively quickly over time. For example, the biodegradable polymers show a similar decrease in concentration as that of MultiHance in the first day, different from that of PGH90. Comparing the concentration of GDCP, PGH, and MultiHance, the times of GDCP21, GDCP144, and MultiHance to decrease to half of their initial concentrations (i.e., their initial half-lives) in the vitreous after intravitreal injection are approximately 0.5, 0.4, and 0.15 days, and those of PGH20 and PGH90 are 0.5 and 1.3 days, respectively. The clearance of a molecule in the vitreous humor is expected to follow a monoexponential decay function when the molecule diffuses in the vitreous and eliminated at the retina or the anterior chamber. However, the concentration-time profiles in the vitreous for the studied polymers, particularly PGH20 and PGH90, did not fit well with a first-order mono-exponential decay function. This can also be illustrated by following the concentration-time decrease profiles from 50% to 25% of their initial values in the figure. The times of PGH20 and PGH90 to decrease to 25% of their initial concentration in the vitreous are approximately 1.4 and 6 days post-injection, about 3 and 5 times of their respective initial half-lives.
DISCUSSION
MRI Ocular Pharmacokinetic Studies
Ocular drug delivery has been a recent interest among ophthalmologists and pharmaceutical researchers, partly due to the lack of an effective drug delivery system for the treatment of posterior eye diseases. Previous MRI pharmacokinetic studies of the eye have demonstrated the advantages of the noninvasive MRI approach. However, quantitative measurements of the concentration of contrast agent in these MRI studies relied on a signal intensity versus contrast agent concentration calibration curve constructed by MRI of contrast agent standards, which can be compromised by errors such as variability of coil positioning and experimental setup. In addition, the relationship between image signal intensity and contrast agent concentration was not linear, as the image signal intensity is intrinsically determined not only by T1 relaxation but also T2 relaxation mechanisms. Most methods for T1 measurement are time-consuming and unsuitable for dynamic pharmacokinetic study. In the present study, a recently developed MR technique (ms-DSEPI-T12) was used to dynamically map the T1 of the contrast agents in the vitreous humor; the scan time was 6 min in the present MRI setting. This powerful technique has the potential to measure rapid T1 changes due to the clearance of contrast agents from the vitreous as demonstrated in the present study.
The study of disulfide bond biodegradable polymers in the vitreous humor can provide information on the clearance mechanism and degradation kinetics of disulfide linkage in the vitreous in the development of novel drug delivery systems to deliver therapeutics to the posterior eye. The present study examined the degradation of disulfide bonds in the vitreous humor. The comparison of the clearance of biodegradable polymers GDCP, nonbiodegradable polymers PGH, and MultiHance suggests that GDCP were broken into smaller fragments in the vitreous humor within a day after intravitreal administration. It was originally thought that disulfide-containing biodegradable polymers have slow polymer degradation in the vitreous and thus can be utilized as matrices in ocular drug delivery systems such as bioresponsive polymeric nanocarrier and temperature sensitivity copolymer drug delivery systems for sustained drug delivery in the eye. In general, slow-degrading polymers are required to provide effective sustained ocular delivery for the treatment of chronic eye diseases, and, ideally, drug administration through the intravitreal route such as injection or implant is preferred to have longer than 1-month interval. The relatively fast and noticeable disulfide degradation in the vitreous humor shown in the present study suggests that this type of polymer may not be suitable for long sustained drug delivery (e.g., over 1 month) in chronic posterior eye disease therapy.
Experimental Errors, Assumptions, and Their Effects
The concentration of the contrast agents in the present study was determined by T1 relaxivities of the contrast agents. Unlike contrast agents in tissues that in vivo T1 relaxivities are likely different from the in vitro values, the vitreous humor generally can be assumed as uniform in character and the observed relaxivity values of the polymers in solutions in vitro can be assumed approximately equivalent to those in the vitreous in vivo. This assumption is appropriate in the PGH and Multihance analyses. For GDCP, a caveat is that the observed relaxivities for the biodegradable GDCP could consistently be changing when the molecular weight decreases over time due to polymer degradation in the vitreous.
Temperature difference between MRI experiments in vivo (26) and those of phantoms at room temperature in vitro could be another source of errors due to the possible effect of temperature on T1 relaxivity. According to theory, the change in relaxation rate (1/T1) contributed through the paramagnetic ion (Gd) is directly related to the change in the molecular motion of the contrast agent. For a contrast agent with relatively high molecular weight (e.g., 20–144 kDa), it is not likely that the molecular motion varies significantly between room and body temperature. The effect of temperature on relaxivity of Gd-chelate polymers has been described in a previous study (27) in which less than 5% change of relaxivity was observed within the temperature range from 26 to 37°C. The difference in the temperatures in the present in vivo and in vitro MRI experiments therefore is not expected to significantly impact the conclusions of the present study.
Another experimental error was related to the increase in the mean total concentration of the contrast agent in vitreous humor in the first several time points after the injection of PGH as illustrated in Fig. 5a. Once the Gd-chelated compound was injected into the vitreous, a decline in the total vitreous concentration over the duration of the experiment was expected. This abnormal behavior probably resulted from T1 overestimation. In the T1 relaxivity calculation, the saturation recovery signal intensity curve was used to determine the T1 value. The available minimum saturation recovery time is limited to 138 ms in the present imaging technique. If the T1 value near the administration site of PGH is shorter than 100 ms, curve-fitting routine may introduce an error in the resultant T1 value under the effect of noise. The fitting on these signal curves would result in the overestimation of T1 value. As the concentration in local region decreases, overestimation of T1 diminishes when the longer true T1 relaxation time is greater than 138 ms.
Ocular Clearance of Macromolecules
Previous studies have shown that the half-lives of vitreal clearance of ranibizumab (Lucentis) and bevacizumab (Avastin), which have molecular weight of 48 k and 149 k Dalton, are 2.9 and 4.3 days, respectively, in rabbits (28,29). For rituximab, another antibody, the half-life of the macromolecule in vitreous was 4.7 days (30). FITC-dextran of 66 k Dalton in the vitreous after intravitreal administration has a clearance rate of 0.005 h−1, this corresponding to apparent half-life of ~5 days (31,32). The clearance of MRI contrast agent Gd-labeled albumin (Galbumin) in the vitreous was studied and found to have apparent initial half-life of 2 days after 1 mg/mL intravitreal injection (22). In the present intravitreal study, the times of PGH90 to decrease to half and one-fourth of its initial concentration were 1.3 and 6 days, respectively, within the same order of magnitude compared to these macromolecules in the literature.
Based on Einstein diffusion theory, the molecular translational diffusivity is inversely proportional to as , and the mean displacement is , where m and τ represent the molecular mass and diffusion time, respectively. Molecules with higher molecular weight diffuse at slower rates, take longer time to spread in the vitreous, and have slower clearance rates. As illustrated in the present study, PGH20 has a faster clearance rate than PGH90. Similarly, MultiHance shows faster clearance compared with PGH20 and PGH90. These results are consistent with the diffusion theory. On the other hand, GDCP21 and GDCP144 have similar clearance vs. time patterns, possibly due to their degradable nature. GDCP144 or GDCP21 can degrade into smaller molecules during the course of diffusion in the vitreous, and the smaller GDCP fragments have faster clearance from the vitreous. These GDCP results suggest fast degradation of disulfide-containing polymers (disulfide bond) in the vitreous, possibly due to the presence of disulfide bond enzymes in the vitreous humor.
Although the clearance of macromolecules is hypothesized to be predominantly through the anterior route (32,33), there is no significant increase in the signal in the anterior chamber in the experiments with PGH. This may be due to the fast clearance in the anterior chamber (volume ~0.3 mL with aqueous humor turnover rate ~0.1 mL/hr (34)) resulting in PGH concentration below the MRI detection limit in the anterior chamber. PGH can also be cleared at the uvea/ciliary body as the main elimination pathway before PGH enters the anterior chamber. It is also possible that posterior clearance remained the main ocular elimination route for the macromolecule. Further investigation on the clearance mechanism of macromolecules after intravitreal administration, such as using Gd-labeled polymers at higher concentrations, is required to study the clearance route of macromolecules. For GDCP, due to the degradation of the polymers and the similar clearance rate between GDCP and MultiHance as illustrated in Fig. 5b, it is likely that these biodegradable polymers are cleared through the retina.
CONCLUSION
The distribution and clearance of PGH and GDCP in the vitreous after intravitreal injections were studied in rabbits with the recently developed ms-DSEPI-T12 MRI in the present study. The usefulness of T1 mapping with this technique to determine polymer distribution and clearance in the vitreous after intravitreal injection was demonstrated. Contrast agent MultiHance™ was quickly cleared from the eye in the first day post-injection. The non-biodegradable polymers PGH had slower clearance in the vitreous compared with MultiHance. To examine the clearance of disulfide bond-containing biodegradable polymers and its degradation in the vitreous humor, intravitreal GDCP was investigated, and the results were compared with those of PGH and MultiHance. GDCP had faster clearance than PGH and had comparable clearance rate as MultiHance, suggesting that GDCP was broken into smaller fragments in the vitreous humor, possibly due to disulfide bond enzymatic degradation.
Acknowledgments
This work was supported by NIH grant EY 015181 and Margolis Foundation.
Contributor Information
Xianfeng Shi, Department of Radiology, Utah Center for Advanced Imaging Research, University of Utah, 729 Arapeen Dr., Salt Lake City, Utah 84108, USA.
Xin Liu, Department of Radiology, Utah Center for Advanced Imaging Research, University of Utah, 729 Arapeen Dr., Salt Lake City, Utah 84108, USA.
Xueming Wu, Department of Biomedical Engineering, Case Western Reserve University, Cleveland, Ohio, USA.
Zheng-Rong Lu, Department of Biomedical Engineering, Case Western Reserve University, Cleveland, Ohio, USA.
S. Kevin Li, Division of Pharmaceutical Sciences, College of Pharmacy, University of Cincinnati, Cincinnati, Ohio, USA.
Eun-Kee Jeong, Email: ekj@ucair.med.utah.edu, Department of Radiology, Utah Center for Advanced Imaging Research, University of Utah, 729 Arapeen Dr., Salt Lake City, Utah 84108, USA.
References
- 1.Ghate D, Edelhauser HF. Ocular drug delivery. Expert Opin Drug Deliv. 2006;3(2):275–87. doi: 10.1517/17425247.3.2.275. [DOI] [PubMed] [Google Scholar]
- 2.Janoria KG, et al. Novel approaches to retinal drug delivery. Expert Opin Drug Deliv. 2007;4(4):371–88. doi: 10.1517/17425247.4.4.371. [DOI] [PubMed] [Google Scholar]
- 3.Choonara YE, et al. A review of implantable intravitreal drug delivery technologies for the treatment of posterior segment eye diseases. J Pharm Sci. 2010;99(5):2219–39. doi: 10.1002/jps.21987. [DOI] [PubMed] [Google Scholar]
- 4.Lee J, et al. Temperature-sensitive biodegradable poly(ethylene glycol) J Biomater Sci Polym Ed. 2009;20(7–8):957–65. doi: 10.1163/156856209X444367. [DOI] [PubMed] [Google Scholar]
- 5.Lee SS, et al. Biodegradable implants for sustained drug release in the eye. Pharm Res. 2010;27(10):2043–53. doi: 10.1007/s11095-010-0159-x. [DOI] [PubMed] [Google Scholar]
- 6.Meng F, Hennink WE, Zhong Z. Reduction-sensitive polymers and bioconjugates for biomedical applications. Biomaterials. 2009;30(12):2180–98. doi: 10.1016/j.biomaterials.2009.01.026. [DOI] [PubMed] [Google Scholar]
- 7.Kim JO, et al. Polymeric micelles with ionic cores containing biodegradable cross-links for delivery of chemotherapeutic agents. Biomacromolecules. 2010;11(4):919–26. doi: 10.1021/bm9013364. [DOI] [PMC free article] [PubMed] [Google Scholar]
- 8.Mader K, et al. Noninvasive in vivo monitoring of drug release and polymer erosion from biodegradable polymers by EPR spectroscopy and NMR imaging. J Pharm Sci. 1997;86(1):126–34. doi: 10.1021/js9505105. [DOI] [PubMed] [Google Scholar]
- 9.Rudin M, Weissleder R. Molecular imaging in drug discovery and development. Nat Rev Drug Discov. 2003;2(2):123–31. doi: 10.1038/nrd1007. [DOI] [PubMed] [Google Scholar]
- 10.Li SK, Lizak MJ, Jeong EK. MRI in ocular drug delivery. NMR Biomed. 2008;21(9):941–56. doi: 10.1002/nbm.1230. [DOI] [PMC free article] [PubMed] [Google Scholar]
- 11.Richardson JC, et al. Pharmaceutical applications of magnetic resonance imaging (MRI) Adv Drug Deliv Rev. 2005;57 (8):1191–209. doi: 10.1016/j.addr.2005.01.024. [DOI] [PubMed] [Google Scholar]
- 12.Rudin M, et al. In vivo magnetic resonance methods in pharmaceutical research: current status and perspectives. NMR Biomed. 1999;12(2):69–97. doi: 10.1002/(sici)1099-1492(199904)12:2<69::aid-nbm548>3.0.co;2-d. [DOI] [PubMed] [Google Scholar]
- 13.Wilson CG. In-vivo monitoring of dosage forms. J Pharm Pharmacol. 1998;50(4):383–6. doi: 10.1111/j.2042-7158.1998.tb06877.x. [DOI] [PubMed] [Google Scholar]
- 14.Kim H, et al. Controlled drug release from an ocular implant: an evaluation using dynamic three-dimensional magnetic resonance imaging. Invest Ophthalmol Vis Sci. 2004;45(8):2722–31. doi: 10.1167/iovs.04-0091. [DOI] [PubMed] [Google Scholar]
- 15.Kim H, et al. Study of ocular transport of drugs released from an intravitreal implant using magnetic resonance imaging. Ann Biomed Eng. 2005;33(2):150–64. doi: 10.1007/s10439-005-8974-7. [DOI] [PubMed] [Google Scholar]
- 16.Li SK, Jeong EK, Hastings MS. Magnetic resonance imaging study of current and ion delivery into the eye during transscleral and transcorneal iontophoresis. Invest Ophthalmol Vis Sci. 2004;45(4):1224–31. doi: 10.1167/iovs.03-0821. [DOI] [PubMed] [Google Scholar]
- 17.Li SK, Molokhia SA, Jeong EK. Assessment of subconjunctival delivery with model ionic permeants and magnetic resonance imaging. Pharm Res. 2004;21(12):2175–84. doi: 10.1007/s11095-004-7669-3. [DOI] [PubMed] [Google Scholar]
- 18.Kim SH, et al. Assessment of subconjunctival and intrascleral drug delivery to the posterior segment using dynamic contrast-enhanced magnetic resonance imaging. Invest Ophthalmol Vis Sci. 2007;48(2):808–14. doi: 10.1167/iovs.06-0670. [DOI] [PubMed] [Google Scholar]
- 19.Kim SH, et al. Drug elimination kinetics following subconjunctival injection using dynamic contrast-enhanced magnetic resonance imaging. Pharm Res. 2008;25(3):512–20. doi: 10.1007/s11095-007-9408-z. [DOI] [PubMed] [Google Scholar]
- 20.Molokhia SA, et al. Examination of penetration routes and distribution of ionic permeants during and after transscleral iontophoresis with magnetic resonance imaging. Int J Pharm. 2007;335(1–2):46–53. doi: 10.1016/j.ijpharm.2006.11.001. [DOI] [PMC free article] [PubMed] [Google Scholar]
- 21.Molokhia SA, et al. Examination of barriers and barrier alteration in transscleral iontophoresis. J Pharm Sci. 2008;97(2):831–44. doi: 10.1002/jps.21003. [DOI] [PMC free article] [PubMed] [Google Scholar]
- 22.Molokhia SA, et al. Transscleral iontophoretic and intravitreal delivery of a macromolecule: study of ocular distribution in vivo and postmortem with MRI. Exp Eye Res. 2009;88(3):418–25. doi: 10.1016/j.exer.2008.10.010. [DOI] [PMC free article] [PubMed] [Google Scholar]
- 23.Liu X, et al. Rapid simultaneous acquisition of T1 and T2 mapping images using multishot double spin-echo EPI and automated variations of TR and TE (ms-DSEPI-T12) NMR Biomed. 2010;23(1):97–104. doi: 10.1002/nbm.1440. [DOI] [PMC free article] [PubMed] [Google Scholar]
- 24.Ke T, et al. Biodegradable cystamine spacer facilitates the clearance of Gd(III) chelates in poly(glutamic acid) Gd-DO3A conjugates for contrast-enhanced MR imaging. Magn Reson Imaging. 2006;24(7):931–40. doi: 10.1016/j.mri.2006.03.009. [DOI] [PubMed] [Google Scholar]
- 25.Zong Y, et al. Effect of size and charge on pharmacokinetics and in vivo MRI contrast enhancement of biodegradable polydisulfide Gd (III) complexes. J Control Release. 2006;112(3):350–6. doi: 10.1016/j.jconrel.2006.03.006. [DOI] [PubMed] [Google Scholar]
- 26.Schwartz B, Feller MR. Temperature gradients in the rabbit eye. Invest Ophthalmol. 1962;1:513–21. [PubMed] [Google Scholar]
- 27.Benjamin M. Master Thesis. Ch 2 University of Cincinnati; 2006. Synthesis, characterization, and determination of relaxivities for glycoamido-DTPA polymers for use as MRI contrast agents. [Google Scholar]
- 28.Bakri SJ, et al. Pharmacokinetics of intravitreal ranibizumab (Lucentis) Ophthalmology. 2007;114(12):2179–82. doi: 10.1016/j.ophtha.2007.09.012. [DOI] [PubMed] [Google Scholar]
- 29.Gaudreault J, et al. Pharmacokinetics and retinal distribution of ranibizumab, a humanized antibody fragment directed against VEGF-A, following intravitreal administration in rabbits. Retina. 2007;27(9):1260–6. doi: 10.1097/IAE.0b013e318134eecd. [DOI] [PubMed] [Google Scholar]
- 30.Kim H, et al. The pharmacokinetics of rituximab following an intravitreal injection. Exp Eye Res. 2006;82(5):760–6. doi: 10.1016/j.exer.2005.09.018. [DOI] [PubMed] [Google Scholar]
- 31.Araie M, Maurice DM. The loss of fluorescein, fluorescein glucuronide and fluorescein isothiocyanate dextran from the vitreous by the anterior and retinal pathways. Exp Eye Res. 1991;52(1):27–39. doi: 10.1016/0014-4835(91)90125-x. [DOI] [PubMed] [Google Scholar]
- 32.Maurice DM. Review: practical issues in intravitreal drug delivery. J Ocul Pharmacol Ther. 2001;17(4):393–401. doi: 10.1089/108076801753162807. [DOI] [PubMed] [Google Scholar]
- 33.Urtti A. Challenges and obstacles of ocular pharmacokinetics and drug delivery. Adv Drug Deliv Rev. 2006;58(11):1131–5. doi: 10.1016/j.addr.2006.07.027. [DOI] [PubMed] [Google Scholar]
- 34.Mitra AK. Ophthalmic drug delivery systems. 2nd ed. Informa Healthcare; New York, NY: 2003. [Google Scholar]