

Abstract
BACKGROUND AND PURPOSE
Previous studies have pointed to the plant flavonoids myricetin and quercetin as two structurally related stimulators of vascular Cav1.2 channel current (ICa1.2). Here we have tested the proposition that the flavonoid structure confers the ability to modulate Cav1.2 channels.
EXPERIMENTAL APPROACH
Twenty-four flavonoids were analysed for their effects on ICa1.2 in rat tail artery myocytes, using the whole-cell patch-clamp method.
KEY RESULTS
Most of the flavonoids stimulated or inhibited ICa1.2 in a concentration- and voltage-dependent manner with EC50 values ranging between 4.4 µM (kaempferol) and 16.0 µM (myricetin) for the stimulators and IC50 values between 13.4 µM (galangin) and 100 µM [(±)-naringenin] for the inhibitors. Key structural requirements for ICa1.2 stimulatory activity were the double bond between C2 and C3 and the hydroxylation pattern on the flavonoid scaffold, the latter also determining the molecular charge, as shown by molecular modelling techniques. Absence of OH groups in the B ring was key in ICa1.2 inhibition. The functional interaction between quercetin and either the stimulator myricetin or the antagonists resokaempferol, crysin, genistein, and 5,7,2′-trihydroxyflavone revealed that quercetin expressed the highest apparent affinity, in the low µM range, for Cav1.2 channels. Neither protein tyrosine kinase nor protein kinase Cα were involved in quercetin-induced stimulation of ICa1.2.
CONCLUSIONS AND IMPLICATIONS
Quercetin-like plant flavonoids were active on vascular Cav1.2 channels. Thus, the flavonoid scaffold may be a template for the design of novel modulators of vascular smooth muscle Cav1.2 channels, valuable for the treatment of hypertension and stroke.
Keywords: Cav1.2 channel current, myricetin, quercetin, rat tail artery myocyte, whole-cell patch-clamp
Introduction
Flavonoids are a family of polyphenolic compounds with strong antioxidant activity present in fruits, vegetables and other plant foods (Erdman et al., 2007). More than 5000 distinct flavonoids have been identified so far, and several hundreds are known to be present in foods eaten every day.
Several beneficial health effects have been ascribed to flavonoids and to the diet typically richest in these compounds, that is the Mediterranean diet. These include anticancer, anti-inflammatory and cardiovascular-protecting effects. Treatment of rats with red wine polyphenolic compounds for 1 week before brain ischemia ameliorated cerebral blood flow, reduced the neurotoxic release of excitatory amino acids and protected the brain against ischemic injury. These effects were associated with an increase in the expression of proteins involved in the maintenance of energy metabolism, neuronal calibre and axon formation, as well as protection against oxidative stress injury (Ritz et al., 2008). Furthermore, a diet enriched in polyphenols and polyunsaturated fatty acids induced neurogenesis in adult mouse brain (Valente et al., 2009). However, most of the molecular mechanisms underlying these effects are still poorly understood.
There is an increasing body of evidence that flavonoids can affect vascular tone and cardiac function by directly targeting cardiovascular ion channels (Scholz et al., 2010). Recent findings from this laboratory have highlighted vascular ion channels as important targets for flavonoids. Specifically, while (±)-naringenin was able to stimulate KCa1.1 channel current (Saponara et al., 2006), and quercetin and myricetin stimulated Cav1.2 channel current (ICa1.2) (Saponara et al., 2002; Fusi et al., 2005), cardamonin behaved like a bifunctional vasodilator capable of inhibiting ICa1.2 and stimulating KCa1.1 current (Fusi et al., 2010; ion channel nomenclature follows Alexander et al., 2009). However, although sharing several basic features with the Ca2+ channel agonist Bay K 8644, both quercetin and myricetin displayed particular sites and mechanisms of action at Cav1.2 channels (Saponara et al., 2002; Fusi et al., 2003). Thus, on one side, Ca2+ antagonists were more potent against contractions induced by myricetin than those induced by Bay K 8644 and on the other, quercetin affected the electrophysiological features of ICa1.2 quite differently from Bay K 8644. This flavonoid slowed down the rate of inactivation while leaving unaltered the threshold of the current and, in contrast with Bay K 8644, it generally promoted relaxation of vascular smooth muscle, though vasoconstriction has been recently reported in both portal vein and aorta (Chiwororo and Ojewole, 2010; Suri et al., 2010). Additionally, both quercetin (unpublished observation) and myricetin (Fusi et al., 2003) did not displace (+)-[3H]PN-200–110 binding to porcine aortic membranes. In consideration of both the effects of quercetin and myricetin on Cav1.2 channels and the widespread opinion that the pharmacological potential of a specific flavonoid is strongly related to its molecular structure, a series of flavonoids, structurally related to quercetin and myricetin (Table 1), were investigated. The aim was to determine the structural features responsible for their action on Cav1.2 channels and to gain insight into their mechanism of action. The results obtained support the view that flavonoids are a class of naturally occurring modulators of vascular Cav1.2 channels.
Table 1.
Chemical structures of compounds
| Substituents | |||||||||
|---|---|---|---|---|---|---|---|---|---|
| Generic structure | Flavonoid | 2′ | 3′ | 4′ | 5′ | 3 | 5 | 6 | 7 |
| Flavonol | 3,4′-Dihydroxyflavone | OH | OH | ||||||
 |
3,6,4′-Trihydroxyflavone | OH | OH | OH | |||||
| 3-Methyl galangin | OCH3 | OH | OH | ||||||
| Galangin | OH | OH | OH | ||||||
| Isorhamnetin | OCH3 | OH | OH | OH | OH | ||||
| Kaempferol | OH | OH | OH | OH | |||||
| Morin | OH | OH | OH | OH | OH | ||||
| Myricetin | OH | OH | OH | OH | OH | OH | |||
| Quercetin | OH | OH | OH | OH | OH | ||||
| Resokaempferol | OH | OH | OH | ||||||
| Rutin | OH | OH | O-rutinose | OH | OH | ||||
| Tamarixetin | OH | OCH3 | OH | OH | OH | ||||
| Flavone | 5,7,2′-Trihydroxyflavone | OH | OH | OH | |||||
 |
5-Hydroxyflavone | OH | |||||||
| Apigenin | OH | OH | OH | ||||||
| Baicalein | OH | OH | OH | ||||||
| Chrysin | OH | OH | |||||||
| Luteolin | OH | OH | OH | OH | |||||
| Scutellarein | OH | OH | OH | OH | |||||
| Flavanone | (±)-Naringenin | OH | OH | OH | |||||
 |
Naringin | OH | OH | O-β-neo-hesperidose | |||||
| (±)-Taxifolin | OH | OH | OH | OH | OH | ||||
| Isoflavone | Daidzein | OH | OH | ||||||
 |
Genistein | OH | OH | OH | |||||
Methods
Animals
All animal care and experimental procedures complied with the Guide for the Care and Use of Laboratory Animals published by the US National Institutes of Health (NIH Publication no. 85–23, revised 1996) and were approved by the Animal Care and Ethics Committee of the Università degli Studi di Siena, Italy (27–1-2009). Male Sprague–Dawley rats (300–400 g, Charles River Italia, Calco, Italy) were anaesthetized (i.p.) with a mixture of Ketavet® (30 mg kg−1 ketamine; Intervet, Aprilia, Italy) and Xilor® (8 mg kg−1 xylazine; Bio 98, San Lazzaro, Italy), decapitated and exsanguinated. The tail was removed immediately, cleaned of skin and placed in external solution (see below for composition). The main tail artery was dissected free of its connective tissue.
Cell isolation procedure for ICa1.2 recordings
Smooth muscle cells were freshly isolated from the tail main artery incubated at 37°C in 2 mL of 0.1 mM Ca2+ external solution (see below) containing 1 mg·mL−1 collagenase (type XI), 1 mg·mL−1 soybean trypsin inhibitor, and 1 mg·mL−1 BSA, gently bubbled with a 95% O2– 5% CO2 gas mixture, as previously described (Fusi et al., 2001). Cells exhibited an ellipsoid form (10–15 µm in width, 35–55 µm in length) and were continuously superfused with external solution containing 0.1 mM Ca2+ and 30 mM tetraethylammonium using a peristaltic pump (LKB 2132, Bromma, Sweden), at a flow rate of 400 µL·min−1. An estimated time of 3 s was sufficient for the complete exchange of cell chamber buffer.
Whole-cell patch-clamp recordings
The conventional whole-cell patch-clamp method (Hamill et al., 1981) was employed to voltage-clamp smooth muscle cells. Recording electrodes were pulled from borosilicate glass capillaries (WPI, Berlin, Germany) and fire-polished to obtain a pipette resistance of 2–5 MΩ when filled with internal solution (see below). A low-noise, high-performance Axopatch 200B patch-clamp amplifier (Molecular Devices Corporation, Sunnyvale, CA, USA) driven by a personal computer in conjunction with an A/D, D/A board (DigiData 1200 A/B series interface, Molecular Devices Corporation) was used to generate and apply voltage pulses to the clamped cells and record the corresponding membrane currents. At the beginning of each experiment, the junction potential between the pipette and bath solution was electronically adjusted to zero. Cell break-in was accomplished by gentle suction at a holding potential (Vh) of −50 mV for ICa1.2 recordings. Then, Vh was set either to −50 mV or to −90 mV. Micropipette seals had to be GΩ in nature with leak currents less than 0.25 pA/mV. Current signals, after compensation for whole-cell capacitance and series resistance (between 70–80%), were low-pass filtered at 1 kHz and digitized at 3 kHz prior to being stored on the computer hard disk. Electrophysiological responses were tested at room temperature (20–22°C) only in those cells that were phase dense.
ICa1.2 recordings
ICa1.2 was always recorded in external solution containing 30 mM tetraethylammonium as well as 5 mM Ca2+. Current was elicited with 250 ms clamp pulses (0.067 or 0.033 Hz) to 0 mV from a Vh of −50 mV or −90 mV. Test pulses to 0 mV were selected as this voltage has been shown to be the most convenient for studying quercetin-induced stimulation of ICa1.2 (Saponara et al., 2002). Furthermore, preliminary current–voltage relationships performed for each compound at a Vh of −50 mV demonstrated that results obtained at a test pulse of 0 mV did not differ from those obtained at the maximum (i.e. 10–20 mV) of the same relationship (data not shown). Data were collected once the current amplitude had been stabilized (usually 7–10 min after the whole-cell configuration had been obtained). At this point, the various protocols were performed as detailed below. ICa1.2 did not run down during the following 40 min under these conditions (Petkov et al., 2001).
Steady-state inactivation curves were obtained using a double-pulse protocol. Once various levels of the conditioning potential had been applied for 5 s, followed by a short (5 ms) return to the Vh, a test pulse (250 ms) to 0 mV was delivered to evoke the current. The delay between the conditioning potential and the test pulse allowed full or near-complete deactivation of the channels simultaneously avoiding partial recovery from inactivation.
Activation curves were derived from the current–voltage relationships (as shown in Figure 4). Conductance (G) was calculated from the equation G = ICa1.2/(Em− Erev), where: ICa1.2 is the peak current elicited by depolarizing test pulses in the range −50 to 20 or 30 mV from Vh of −50 mV; Em is the membrane potential; and Erev is the reversal potential (181 mV, as estimated with the Nerst equation). Gmax is the maximal Ca2+ conductance (calculated at potentials ≥0 mV). The ratio G/Gmax was plotted against the membrane potential and fitted with the Boltzmann equation.
Figure 4.
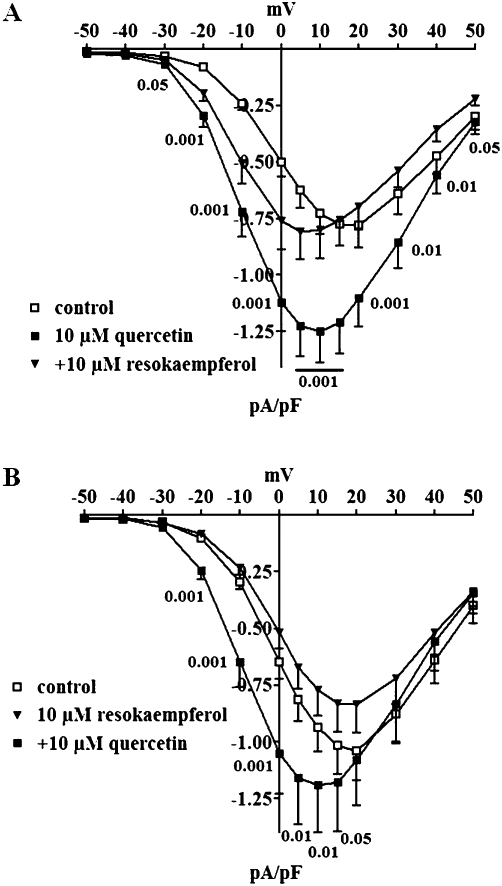
Effect of quercetin and resokaempferol on ICa1.2-voltage relationship in rat tail artery myocytes. Current-voltage relationships, recorded from Vh of −50 mV, constructed prior to the addition of drug (control), in the presence of 10 µM quercetin and after the subsequent addition of 10 µM resokaempferol (A) or vice versa (B). Data points are mean ± SEM (n = 8–10). P-values for repeated measures anova are shown.
ICa1.2 deactivation was assessed by analysing tail currents recorded on repolarisation to −20 mV after a depolarizing stimulus (25 ms duration) to 10 mV from a Vh of −50 mV.
The rate of inhibition of ICa1.2 by 30 µM chrysin or by 100 µM resokaempferol, genistein, and 5,7,2′-trihydroxyflavone was analysed either in the absence or presence of 10 µM quercetin. The resulting time courses were fitted by a mono-exponential equation.
K+ currents were blocked with 30 mM tetraethylammonium in the external solution and Cs+ in the internal solution (see below).
Current values were corrected for leakage using 300 µM Cd2+, which completely blocked ICa1.2.
Solutions for ICa1.2 recordings
The external solution contained (in mM): 130 NaCl, 5.6 KCl, 10 HEPES, 20 glucose, 1.2 MgCl2·6 H2O, and 5 Na-pyruvate (pH 7.4). For cell isolation, external solution containing 20 mM taurine was prepared by replacing NaCl with equimolar taurine. CaCl2 (5 mM, final concentration) and tetraethylammonium (30 mM) were added to the external solution for ICa1.2 recordings. The internal solution (pCa 8.4) consisted of (in mM): 100 CsCl, 10 HEPES, 11 EGTA, 2 MgCl2·6 H2O, 1 CaCl2, 5 Na-pyruvate, 5 succinic acid, 5 oxalacetic acid, 3 Na2-ATP, and 5 phosphocreatine; pH was adjusted to 7.4 with CsOH. The osmolarity of the 30 mM tetraethylammonium- and 5 mM Ca2+-containing external solution (320 mosmol) and that of the internal solution (290 mosmol; Stansfeld and Mathie, 1993) were measured with an osmometer (Osmostat OM 6020, Menarini Diagnostics, Florence, Italy).
Statistical analysis
Acquisition and analysis of data were accomplished by using pClamp 8.2.0.232 and 9.2.1.8 software (Molecular Devices Corporation), respectively, and GraphPad Prism version 5.02 (GraphPad Software Inc., San Diego, CA, USA). Data are reported as mean ± SEM; n is the number of cells analysed (indicated in parentheses), isolated from at least three animals. Statistical analyses and significance as measured by either anova (ordinary or repeated measures followed by Dunnett's or Bonferroni post-test), Student's t-test for paired samples (two-tail), or one sample t-test were obtained using GraphPad InStat version 3.06 (GraphPad Software Inc.). In all comparisons, P < 0.05 was considered significant. The pharmacological response to each flavonoid, described in terms of EC50 or IC50, was calculated by non-linear regression from the equation: Y = bottom + (top-bottom)/(1 + 10∧((LogEC50-X) Hillslope)), where Hillslope describes the steepness of the curve.
Materials
The materials used included: collagenase (type XI), trypsin inhibitor, BSA, tetraethylammonium chloride, EGTA, taurine, CdCl2, quercetin, luteolin, isorhamnetin, apigenin, kaempferol, tamarixetin, rutin, (±)-taxifolin, morin, genistein, (±)-naringenin, naringin, baicalein, daidzein, myricetin, dephostatin, and Gö6976 (from Sigma Chimica, Milan, Italy); 5-hydroxyflavone and 3-methyl galangin (from Specs, the Netherlands); chrysin, resokaempferol, galangin, scutellarein, 3,4′-dihydroxyflavone, 3,6,4′-trihydroxyflavone, and 5,7,2′-trihydroxyflavone (from Indofine Chemical Company, Hillsborough, NJ, USA). The flavonoids, Gö6976, and dephostatin, dissolved directly in DMSO, were diluted at least 1000 times prior to use. The resulting concentrations of DMSO (below 0.1%, vv−1) failed to alter the response of the preparations (data not shown). Final drug concentrations are stated in the text.
Following control measurements, each cell was exposed to a drug by flushing through the experimental chamber external solution containing that drug.
Molecular modelling: principal component analysis (PCA) with VolSurf+ descriptors
An analysis of the dataset of 24 flavonoids was carried out using molecular modelling techniques, using Volsurf+ (version 1.0.4, Molecular Discovery Ltd., London, UK). Their 3-D molecular structures were converted into a set of molecular descriptors, based on chemical, physical and chemico-physical properties of the molecules (Cruciani et al., 2000). These descriptors proved to relate very well to the pharmacokinetic (Crivori et al., 2000) and toxicological features of the compounds (Carosati et al., 2010). Some descriptors account for the polar hydrophilic and apolar hydrophobic moieties of the molecule and the balance between them, whereas others determine the percentage of ionized and unionized species as a function of pH. When applied to a set of molecules, such descriptors are tabulated to form the so-called X-matrix, where the molecules are the objects (rows), and the descriptors are the variables (columns). This table is available as Supporting Information. The multivariate PCA is an extremely useful statistical method to obtain a simple and straightforward reading of the X-matrix and to summarize the resulting information in a more understandable form. In fact, PCA is composed of a set of new, independent, and orthogonal variables, called principal components (PCs), which are linear combinations of the original variables (here the VolSurf+ descriptors). PCA model dimension depends on the variance of data; in general, for drug-like molecules as objects and VolSurf+ descriptors as variables, two or three PCs are sufficient to treat the data. The results of a PCA are usually discussed in terms of ‘scores’ and ‘loadings’: objects-molecules and variables-molecular descriptors are processed into the corresponding score plot and loading plot where the first two dimensions are labelled PC1 and PC2. In the score plot, the position of the molecules reflects their similarity, as molecules that lie in proximity of each other can be considered similar and molecules that lie orthogonally can be considered completely dissimilar. The loadings report how the variables contribute to the model: homogeneous variables can be identified unequivocally by their clustering, which becomes responsible for the corresponding position of the compounds in the score plot. For more details on PCA, refer to Wold et al. (1984).
Prediction of pKa values with Moka software
The -log10 of the acid dissociation constant Ka (pKa) values of the hydroxyl groups were computed using the Moka software (Milletti et al., 2007), a well-established method for predicting them in drug-like compounds, with a root-mean-squared error of about 1 pKa unit (Manchester et al., 2010).
Results
Effects of flavonoids on ICa1.2
The effects of flavonoids on ICa1.2 recordings were assessed at a Vh of −50 mV. Myricetin, quercetin (Figure 1A), isorhamnetin, luteolin, apigenin and kaempferol enhanced the current in a concentration-dependent manner with EC50 values ranging between 2.9 µM and 16.0 µM and a maximal effect between 165% and 305% of controls (Table 2). On the contrary, (±)-naringenin, resokaempferol (Figure 1B), baicalein, genistein, 3-methyl galangin, 5,7,2′-trihydroxyflavone and chrysin reduced the current in a concentration-dependent manner with IC50 values ranging between 22.2 and 100 µM and maximal effect values between 51% and 18% of controls. Furthermore, galangin modulated ICa1.2 in a concentration-dependent manner, stimulating at concentrations ≤3 µM and inhibiting at concentrations ≥10 µM (data not shown). The remainders showed intermediate activity spanning from a weak enhancement to a small reduction of the current.
Figure 1.
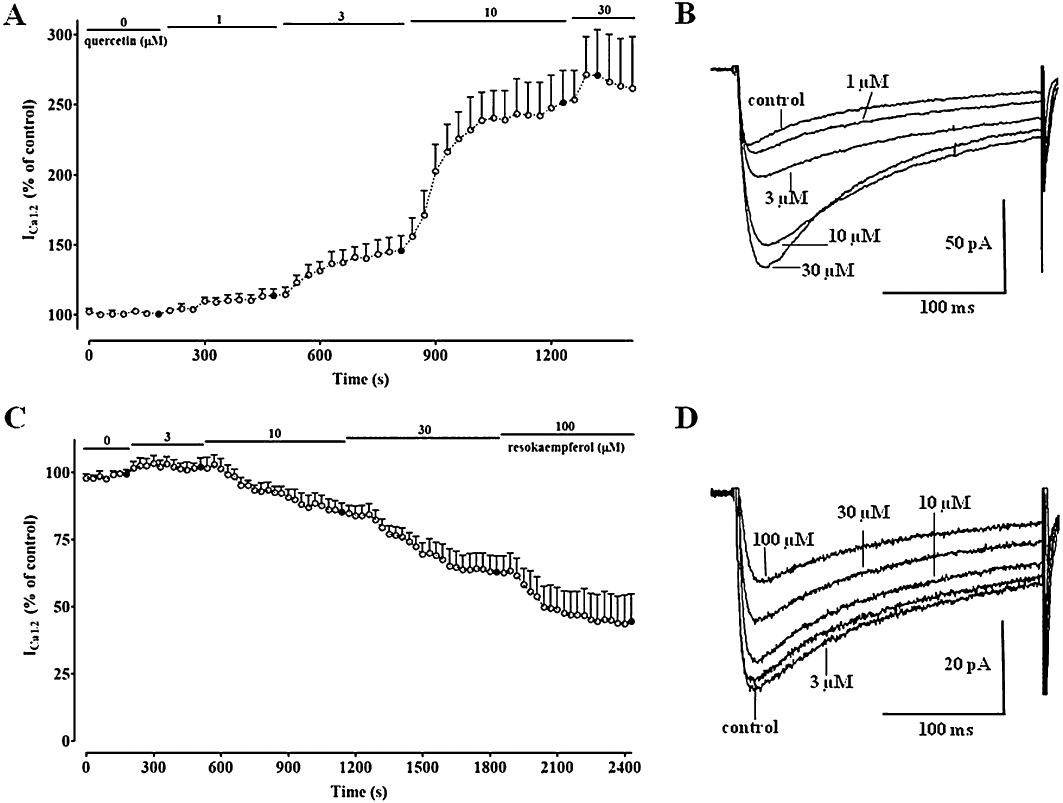
Time course of the effects of quercetin and resokaempferol on ICa1.2. Peak currents were recorded during a typical depolarization from −50 mV to 0 mV, applied every 30 s (0.033 Hz), and subsequently normalized against the current recorded just prior to drug application. ICa1.2 amplitudes are plotted as a function of time. During the periods indicated by the horizontal lines, cells were exposed to increasing concentrations of either quercetin (A) or resokaempferol (C). Filled symbols correspond to current traces shown in panels B and D. Data points are mean ± SEM (n = 5–6). (B and D) Average traces (recorded from 5–6 cells) of conventional whole-cell ICa1.2 elicited with 250-ms clamp pulses to 0 mV from a Vh of −50 mV, measured in the absence or presence of cumulative concentrations of either quercetin or resokaempferol, respectively.
Table 2.
Effects of flavonoids on ICa1.2 in rat tail artery myocytes
| Flavonoid | EC50 or IC50 (µM) | Emax (% of control) |
|---|---|---|
| Myricetin | 16.0 ± 1.9 | 304.9 ± 27.1** (100 µM) |
| Quercetin | 5.1 ± 0.5 | 285.7 ± 31.1** (30 µM) |
| Isorhamnetin | 2.9 ± 0.4 | 189.2 ± 17.1** (10 µM) |
| Luteolin | 4.0 ± 0.5 | 183.2 ± 8.1** (30 µM) |
| Apigenin | 3.0 ± 0.9 | 181.9 ± 20.8* (30 µM) |
| Kaempferol | 4.4 ± 1.1 | 164.6 ± 23.0* (30 µM) |
| Tamarixetin | ND | 118.6 ± 16.0 (30 µM) |
| Rutin | ND | 113.9 ± 9.1 (30 µM) |
| (±)-Taxifolin | ND | 105.1 ± 10.4 (30 µM) |
| 3,6,4′-Trihydroxyflavone | ND | 85.9 ± 5.7 (100 µM) |
| Scutellarein | ND | 70.7 ± 13.8 (100 µM) |
| Naringin | ND | 69.8 ± 6.6* (100 µM) |
| 5-Hydroxyflavone | ND | 68.9 ± 9.0* (100 µM) |
| 3,4′-Dihydroxyflavone | ND | 68.8 ± 6.8** (30 µM) |
| Daidzein | ND | 61.3 ± 4.4*** (100 µM) |
| Morin | ND | 53.6 ± 8.9** (100 µM) |
| (±)-Naringenin | ∼100.0 | 51.1 ± 2.1*** (100 µM) |
| Resokaempferol | ∼27.5 ± 3.8 | 42.4 ± 9.8** (100 µM) |
| Baicalein | ∼85.1 | 41.5 ± 2.5*** (100 µM) |
| Genistein | ∼57.5 ± 9.2 | 33.0 ± 4.4*** (100 µM) |
| 3-Methyl galangin | 29.7 ± 11.8 | 29.6 ± 6.2** (100 µM) |
| 5,7,2′-Trihydroxyflavone | ∼45.1 ± 7.0 | 22.3 ± 3.1*** (100 µM) |
| Chrysin | 22.2 ± 3.0 | 18.4 ± 1.5*** (100 µM) |
| Galangin | 13.4 ± 1.3 | 9.4 ± 2.5*** (100 µM) |
Current was evoked by 250 ms clamp pulses to 0 mV from a Vh of −50 mV. Each flavonoid was added to the perfusion solution to perform a cumulative concentration-response curve.
Potency was expressed as EC50 or IC50 values, for the ICa1.2 intensity recorded under control conditions, respectively. Efficacy (Emax), given as percentage of control (no drug added), was evaluated as the ICa1.2 intensity recorded at the maximal concentration (indicated in parentheses) of the flavonoid assessed. For channel blockers, potency could not be calculated when the efficacy parameter was higher than 50%; in some cases, where efficacy was between 50% and 20%, IC50 values (preceded by the symbol ∼) were calculated constraining the bottom plateau to 0% (defined after the addition of Cd2+). Data are mean ± SEM (n = 3–6).
P < 0.05
P < 0.01
P < 0.001 significantly different from control (100%), one sample t-test.
ND: Not Detectable.
ICa1.2 stimulation by some flavonoids was voltage dependent (Table 3): when Vh was shifted from −50 to −90 mV, isorhamnetin and tamarixetin increased their efficacy, while that of myricetin as well as all Cav1.2 channel antagonists, with the exception of 3-methyl galangin, was reduced.
Table 3.
Voltage dependency of the effects of flavonoids on rat tail artery myocytes ICa1.2
| Effect (% of control) | ||
|---|---|---|
| Flavonoid | Vh = −50 mV | Vh = −90 mV |
| Quercetin | 285.7 ± 31.1 (6) | 259.3 ± 16.2 (8) |
| Myricetin | 263.9 ± 25.9 (4) | 178.2 ± 9.2** (9) |
| Luteolin | 183.2 ± 8.1 (4) | 204.9 ± 24.5 (8) |
| Apigenin | 181.9 ± 20.8 (5) | 176.1 ± 8.3 (9) |
| Isorhamnetin | 165.0 ± 17.2 (6) | 224.8 ± 19.1* (9) |
| Kaempferol | 165.0 ± 27.2 (6) | 168.6 ± 13.6 (11) |
| Tamarixetin | 118.6 ± 16.0 (7) | 167.0 ± 12.3* (11) |
| Scutellarein | 115.4 ± 20.1 (6) | 142.4 ± 12.5 (6) |
| Rutin | 113.9 ± 9.1 (6) | 102.7 ± 3.1 (8) |
| (±)-Taxifolin | 105.1 ± 10.4 (6) | 94.4 ± 3.9 (9) |
| Baicalein | 104.1 ± 11.5 (6) | 160.3 ± 25.7 (5) |
| 3,6,4′-Trihydroxyflavone | 91.7 ± 5.2 (5) | 102.7 ± 6.3 (4) |
| (±)-Naringenin | 83.1 ± 4.5 (5) | 96.2 ± 7.4 (5) |
| Genistein | 81.5 ± 9.0 (7) | 115.1 ± 9.8* (9) |
| 5-Hydroxyflavone | 79.5 ± 7.1 (4) | 107.6 ± 9.9 (5) |
| Naringin | 77.4 ± 6.8 (4) | 97.4 ± 3.8* (4) |
| Morin | 76.9 ± 7.1 (5) | 94.4 ± 4.3* (8) |
| Daidzein | 73.7 ± 3.5 (5) | 90.2 ± 5.8* (5) |
| 5,7,2′-Trihydroxyflavone | 69.1 ± 6.8 (5) | 116.9 ± 11.7* (7) |
| 3,4′-Dihydroxyflavone | 68.8 ± 6.8 (5) | 79.9 ± 3.5 (5) |
| Resokaempferol | 65.0 ± 5.9 (5) | 87.4 ± 5.8* (5) |
| 3-Methyl galangin | 48.8 ± 13.0 (4) | 50.8 ± 6.2 (5) |
| Chrysin | 30.7 ± 2.6 (6) | 50.9 ± 5.1** (7) |
| Galangin | 19.4 ± 1.0 (5) | 35.0 ± 4.1** (5) |
Current was evoked by 250-ms clamp pulses to 0 mV from a Vh of either −50 mV or −90 mV. Each flavonoid was added to the perfusion solution at 30 µM concentration.
Effect is given as % of the current recorded under control conditions. Some data are taken from Table 2. Data are mean ± SEM (n is indicated in parentheses).
P < 0.05
P < 0.01 significantly different from Vh of −50 mV, Student's t-test for unpaired samples.
Molecular modelling
All the compounds were assessed by the molecular modelling procedure with the exception of naringin and rutin, which were excluded because of their molecular hindrance. With VolSurf+ software, a PCA model was constructed using 128 molecular descriptors. Data clustered in some PCs with variances as follows: PC1 36.6; PC2 21.3; PC3 9.5; PC4 7.9; PC5 5.2. Consequently, the model dimension was limited to the first two PCs. The effects of all variables on the first (PC1) and the second dimension (PC2) have been provided as Supporting Information. Figure 2 reports the Score plot (panel A) and Loading plot (panel B) of the PCA model. It is evident from the first PC (X axis) of the score plot that agonists were dragged to the left by the high values of those variables that lie in the corresponding part of the loading plot. Because these variables refer to polarity and size, agonists were larger and more polar/hydrophilic than antagonists, which, on the contrary, were mostly positioned on the right in the plot. The second PC (Y axis) showed few compounds with low scores on PC2. Most of them were classified as intermediate, and differed from the others mainly because of their ionization features along the pH scale (see below and Supporting Information). This finding prompted us to analyse in detail the pKa of the flavonoid phenols and this analysis highlighted significant differences among the molecules. The predicted pKa values (reported in the Supporting Information) were always around or below 4 for OH groups at 3 position, around 7 at 4′ and 7 position, while the others were higher than 8. We can infer that at pH 7.4 many compounds and, in particular, most of the agonists – with the exception of luteolin and apigenin – were negatively charged owing to one or two ionized phenolate groups. On the contrary, the abundance of the unionized species at pH 7.4 was relevant for the antagonists, with the only exception of galangin and resokaempferol. Flavonoids species abundance profiles as a function of pH and pKa values are reported in the Supporting Information.
Figure 2.
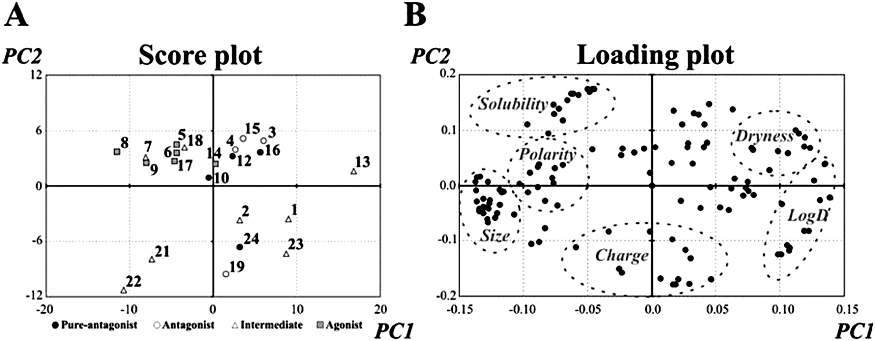
Score plot and Loading plot for the two principal components (PC1 and PC2) of the PCA model on the flavonoids, using 128 molecular descriptors (variables, present in the loading plot). (A) Molecules are grouped according to their effect on ICa1.2 (see Table 2). 1, 3,4′-Dihydroxyflavone; 2, 3,6,4′-trihydroxyflavone; 3, 3-methyl galangin; 4, galangin; 5, isorhamnetin; 6, kaempferol; 7, morin; 8, myricetin; 9, quercetin; 10, resokaempferol; 11, rutin; 12, 5,7,2′-trihydroxyflavone; 13, 5-hydroxyflavone; 14, apigenin; 15, baicalein; 16, chrysin; 17, luteolin; 18, scutellarein; 19 (±)-naringenin; 20, naringin; 21, tamarixetin; 22 (±)-taxifolin; 23, daidzein; 24, genistein. (B) In the loading plot, the variables that univocally clustered are encircled by a dotted line. ‘Size’ stands for variables related to size and shape of the molecule (surface, volume, molecular weight, globularity, polarizability, etc.); ‘Polarity’ and ‘Dryness’ for variables related to the hydrophilic (hydrophilic volumes and hydrophilic ‘capacities’) and hydrophobic moieties (hydrophobic volumes and hydrophobic ‘capacities’), respectively; ‘Solubility’ for variables related to the aqueous solubility of the molecule calculated at different pH values; ‘Charge’ for variables related to different ionisation features along the pH scale; and ‘LogD’ for variables related to LogD calculated at different pH values. In panel A, PC1 and PC2 represent the scores on the first and second PCs, respectively. These are the projections of the objects on PC1 and PC2. In panel B, PC1 and PC2 represent the loadings on the first and second PC, respectively. These are the variable contributions to PC1 and PC2.
Functional interaction between quercetin and myricetin
The functional interaction between the two most effective ICa1.2 stimulators, quercetin and myricetin, was assessed at concentrations close to their EC50 values (Table 2). When cells pretreated with 10 µM quercetin (ICa1.2 246 ± 17% of control) were exposed to 20 µM myricetin, a significant reduction of the current was observed (198 ± 28%, n = 11; P < 0.05, Student's t-test for paired samples). Conversely, the addition of quercetin to cells pretreated with myricetin (235 ± 7%) brought about a further increase in ICa1.2 (309 ± 25%, n = 8; P < 0.01).
Quercetin increased both activation and inactivation time constant (τ) (Table 4). The subsequent addition of myricetin reduced the inactivation τ to a value that was not different from that of the control, leaving the activation τ unaltered. In cells pretreated with myricetin, the subsequent addition of quercetin increased activation τ that was fitted by a mono-exponential equation, giving rise to values similar to those observed in the presence of quercetin alone. Furthermore, the inactivation τ was not different from the control value.
Table 4.
Effects of quercetin and myricetin, either alone or in combination, on activation, inactivation, and deactivation rates of ICa1.2
| τact (ms) | τinact (ms) | n | τdeact fast (ms) | τdeact slow (ms) | n | |
|---|---|---|---|---|---|---|
| Control | 2.9 ± 0.2 | 105.4 ± 7.4 | 11 | 2.3 ± 0.4 | 25.8 ± 3.0 | 8 |
| Quercetin | 6.1 ± 0.3*** | 138.7 ± 6.4** | 11 | 4.0 ± 0.4* | 26.0 ± 3.2 | 8 |
| +Myricetin | 5.8 ± 0.3*** | 124.0 ± 9.4 | 11 | 4.7 ± 0.7*** | 25.5 ± 3.3 | 8 |
| Control | 3.2 ± 0.3 | 104.3 ± 3.5 | 8 | 2.1 ± 0.4 | 21.4 ± 2.6 | 7 |
| Myricetin | 3.1 ± 0.5 | ND | 8 | 3.7 ± 0.4** | 37.8 ± 4.5*** | 7 |
| 13.6 ± 3.4 | ||||||
| +Quercetin | 5.9 ± 0.6** | 111.5 ± 4.8 | 8 | 4.4 ± 0.7*** | 25.7 ± 3.5### | 7 |
Quercetin and myricetin were added at 10 µM and 20 µM, respectively. Activation and inactivation rates refer to the current evoked by 250 ms clamp pulses to 0 mV from a Vh−50 mV. Time constants for activation (τact) and for inactivation (τinact) are reported.
Deactivation rates refer to the current evoked by 25 ms clamp pulses to 10 mV from a Vh of −50 mV which repolarized to −20 mV. Tail currents could be fitted by a bi-exponential function with a fast (τdeact fast) and a slow time constant (τdeact slow). Data are mean ± SEM.
P < 0.05
P < 0.01
P < 0.001 significantly different from control
P < 0.001 significantly different from myricetin alone, repeated measures ANOVA and Bonferroni post-test or Student's t-test for paired samples.
ND: Not Detectable.
Under control conditions, ICa1.2 deactivation kinetics revealed two components of τ a fast (τdeact fast) and a slow component (τdeact slow). Quercetin increased significantly τdeact fast of ICa1.2 without affecting τdeact slow (Table 4). The subsequent addition of myricetin further increased τdeact fast without modifying τdeact slow. Similar effects were observed on τdeact fast when myricetin was added before quercetin. On the contrary, τdeact slow, which was increased by myricetin, returned to control values following the addition of quercetin.
Insight into the mechanism of action of quercetin and genistein
The possible involvement of protein tyrosine kinase in quercetin- and genistein-induced modulation of ICa1.2 was assessed in myocytes treated with the protein tyrosine phosphatase inhibitor dephostatin. Dephostatin (50 µM) per se stimulated ICa1.2 up to 154 ± 7% of control (n = 14; P < 0.001, one sample t-test). Neither ICa1.2 stimulation induced by 10 µM quercetin (215 ± 19%, n = 6) nor ICa1.2 inhibition caused by 100 µM genistein (32.9 ± 3.7%, n = 7) were affected by the presence of dephostatin (192 ± 21%, n = 6, and 22.7 ± 2.8%, n = 5, respectively; P > 0.05, Student's t-test for unpaired samples).
In a second series of experiments, the possibility that quercetin stimulates ICa1.2via activation of protein kinase Cα (PKCα) was considered. The PKCα inhibitor Gö6976 (100 nM), decreased ICa1.2 to 73.4 ± 7.5% of control (n = 6; P < 0.05, one sample t-test). The subsequent addition of 10 µM quercetin caused a gradual increase of the current over Gö6976 values (249 ± 43%) that was not different from that given by quercetin alone (see above; P > 0.05, Student's t-test for unpaired samples).
Inhibition of quercetin-induced ICa1.2 stimulation by resokaempferol, chrysin, genistein and 5,7,2′-trihydroxyflavone
Resokaempferol, chrysin, genistein and 5,7,2′-trihydroxyflavone, considered as ‘pure’ antagonists as distinct from baicalein, 3-methyl galangin and galangin which displayed also stimulatory activity, were tested in cells pretreated with quercetin. Genistein antagonized quercetin-stimulated ICa1.2 (Figure 3) with an IC50 value of 50.8 ± 10.3 µM (n = 5) similar to that observed in the absence of quercetin (P > 0.05 vs. the IC50 value shown in Table 2, Student's t-test for unpaired samples). On the contrary, resokaempferol-, chrysin- and 5,7,2′-trihydroxyflavone-induced inhibition of the current was affected by the presence of quercetin (9.4 ± 2.9 µM, P < 0.01; 10.9 ± 2.3 µM, P < 0.05; and 22.5 ± 3.3 µM, P < 0.05, respectively; n = 5). Taking quercetin-stimulated ICa1.2 as 100%, 5,7,2′-trihydroxyflavone and resokaempferol reduced current intensity to percentage values (10% and 19%, respectively) smaller than those observed in control myocytes (no quercetin added; see Table 2). In contrast, the maximum effect of chrysin (15%) and genistein (23%) was not affected by the presence of quercetin. For comparison, nifedipine displayed the same potency both in control (IC50 = 4.5 ± 0.1 nM, n = 5) and in quercetin-treated myocytes (IC50 = 7.6 ± 1.8 nM, n = 6; P > 0.05), the current being fully blocked at the highest concentration employed.
Figure 3.
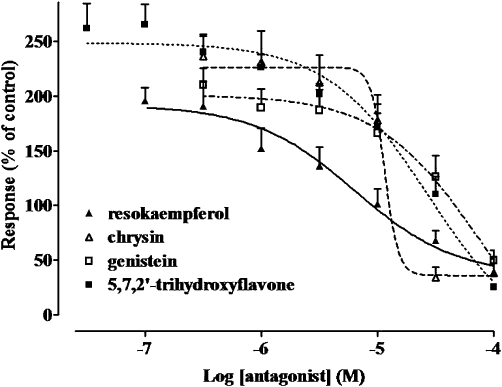
Effects of resokaempferol, chrysin, genistein and 5,7,2′-trihydrohyflavone on ICa1.2 amplitude recorded in presence of quercetin in rat tail artery myocytes. The amplitude of the current recorded during a typical depolarization from −50 mV to 0 mV in the presence of 10 µM quercetin was normalized to that recorded under control conditions, taken as 100%. Data points are mean ± SEM (n = 3–5).
The rate of inhibition of ICa1.2 by 30 µM chrysin or by 100 µM resokaempferol, genistein and 5,7,2′-trihydroxyflavone, either in the absence or presence of 10 µM quercetin, was also analysed. As shown in Table 5, quercetin reduced significantly only the rate of inhibition of resokaempferol.
Table 5.
Time course of ICa1.2 inhibition exerted by resokaempferol, genistein, 5,7,2′-trihydroxyflavone, and chrysin in the presence or absence of quercetin
| Alone | +10 µM quercetin | |||
|---|---|---|---|---|
| Drug | τon (s) | n | τon (s) | n |
| Resokaempferol | 100.9 ± 13.9 | 5 | 58.9 ± 7.8* | 5 |
| Genistein | 44.7 ± 5.9 | 6 | 51.0 ± 5.0 | 5 |
| 5,7,2′-Trihydroxyflavone | 86.5 ± 2.9 | 5 | 117.1 ± 23.3 | 5 |
| Chrysin | 97.9 ± 9.6 | 6 | 91.4 ± 20.3 | 4 |
τon is the time constant of the onset of inhibition by the antagonist evaluated at 100 µM resokaempferol, genistein or 5,7,2′-trihydroxyflavone, or 30 µM chrysin. Data represent the mean ± SEM.
P < 0.05, significantly different from values without quercetin (alone), Student's t-test for unpaired samples.
Effects of quercetin on current-voltage relationship as well as steady-state activation and inactivation curves for ICa1.2 in absence or presence of resokaempferol
Resokaempferol, the most potent among the ‘pure’ antagonists, was assayed for its interaction with quercetin on the current-voltage relationship (Figure 4A). Quercetin increased the peak inward current in the range between −30 and 30 mV and shifted the apparent maximum by 10 mV in the hyperpolarizing direction without changing the threshold. The subsequent addition of 10 µM resokaempferol brought the apparent maximum back to control values, and further shifted it by 5 mV in the hyperpolarizing direction. When cells pretreated with resokaempferol (Figure 4B) were exposed to quercetin, an increase of ICa1.2 was still observed although the degree of this stimulation (162% of control at 0 mV) was smaller than that evoked by quercetin alone (225%, see Figure 4A). The inward current stimulation by quercetin developed between −20 and 5 mV as compared with control preparations and between −20 and 15 mV as compared with resokaempferol alone. Notably, quercetin shifted the apparent maximum by 10 mV, irrespective of the presence of resokaempferol.
Any possible effect of resokaempferol on the voltage dependence of quercetin ICa1.2 stimulation was sought by analysing the steady-state activation and inactivation curves of the current. Both quercetin and resokaempferol alone shifted the steady-state inactivation curve to more negative potentials but only quercetin decreased the slope factor for inactivation (Table 6). The effects of both quercetin and resokaempferol in cells pretreated with either resokaempferol or quercetin were additive towards the 50% inactivation potential. On the contrary, resokaempferol counteracted the effect of quercetin on the slope factor for inactivation, when added either before or after quercetin. Quercetin alone shifted the steady-state activation curve to more negative potentials and also reduced its slope factor (Table 6). Resokaempferol did not modify these effects when added either before or after quercetin.
Table 6.
Effects of quercetin and resokaempferol, either alone or in combination, on voltage-dependent activation and inactivation parameters of ICa1.2
| V50 inact (mV) | Slopeinact (mV) | n | V50 act (mV) | Slopeact (mV) | n | |
|---|---|---|---|---|---|---|
| Control | −21.7 ± 2.2 | –8.1 ± 0.9 | 8 | –0.4 ± 1.3 | 7.8 ± 0.6 | 8 |
| Quercetin | −28.1 ± 1.6*** | −5.9 ± 0.3* | 8 | −9.7 ± 1.4*** | 6.4 ± 0.2 | 8 |
| +Resokaempferol | −34.4 ± 2.1***### | –7.8 ± 0.3 | 8 | −10.8 ± 1.8*** | 6.1 ± 0.3* | 8 |
| Control | −20.8 ± 0.8 | –7.7 ± 0.7 | 6 | –1.1 ± 1.1 | 7.3 ± 0.2 | 10 |
| Resokaempferol | −26.4 ± 1.4***### | –7.1 ± 0.3 | 6 | −0.7 ± 1.3### | 7.2 ± 0.3# | 10 |
| +Quercetin | −31.7 ± 1.4*** | –6.4 ± 0.1 | 6 | −9.4 ± 1.6*** | 6.2 ± 0.2* | 10 |
V50 act and V50 inact, as well as slope factor for activation (slopeact) and inactivation (slopeinact) were obtained from steady-state activation and inactivation curves, fitted by the Boltzmann equation. Data represent the mean ± SEM.
P < 0.05
P < 0.001 significantly different from control
P < 0.05
P < 0.001 significantly different from quercetin alone or +quercetin, repeated measures ANOVA and Bonferroni post-test.
Discussion
The present study provides a detailed analysis of how quercetin-like flavonoids affect the Cav1.2 channels in vascular smooth muscle. Among the 24 compounds investigated, both ICa1.2 stimulators and inhibitors were identified and, in most cases, the effects were voltage- and/or concentration-dependent. The stimulators exhibited effects that turned out to be 1.7–3-fold less effective and two to three orders of magnitude less potent than those of Bay K 8644 (Saponara et al., 2008). A close correlation was found between the structure and ICa1.2 stimulating activity, with apigenin (4′,5,7-trihydroxyflavone) expressing the minimal structural requirements. The presence of an additional group in 3′ position (OH, as in luteolin; OCH3, as in isorhamnetin) or in 3 position (OH, as in kaempferol), gave rise to equipotent ICa1.2 stimulators. The presence of two additional OH groups in 3 and 3′ position, as in quercetin, or a third additional OH group in 5′ position, as in myricetin, markedly increased the efficacy. Failure to fulfil these minimal structural requirements as in the flavanones (lack of the double bond between C2 and C3) and isoflavones (B ring in 3 instead than in 2 position) as well as glycosilation or the introduction of an additional OH group either in 2′ or in 6 position, led to the loss of the stimulatory activity or even gave rise to Ca2+ channel antagonism as for galangin and chrysin. Univocal structure–activity relationship for Ca2+ channel antagonists, however, did not emerge from this series of compounds, although the seven most effective molecules were characterized either by the absence or by the presence of only one OH group in the B ring.
The molecular modelling provided further elements to strengthen the structure–activity relationship. Agonists, because of the greater number of OH groups were shown to be more hydrophilic and, because of different pKa values that varied according to the OH group position in the scaffold, turned out to be more negatively charged than antagonists. For example, scutellarein and kaempferol were positioned very close in the PCA because they have the same molecular weight and similar LogP. However, the different position of the four OH groups made scutellarein and kaempferol intermediate and agonist agents, respectively; this distinction was not evident from the PCA but emerged when comparing their pKa profile as a function of pH. The structure–activity relationship focussed on the role of the OH groups is summarized in Figure 5. The fact that the OH groups in 5 and 7 position were important for both agonists and antagonists allows us to hypothesize that, by interacting with positively charged groups, they might facilitate the docking of the compounds to the Cav1.2 channel. Moreover, genistein was categorized as an antagonist, although possessing OH groups in 5, 7, and 4′ position, like the agonist apigenin. Hence the flavonol scaffold, but not the isoflavone, allows an agonist-like presentation to the channel. Taken together, these data demonstrate that the distribution of OH groups and the double bond between C2 and C3 on the flavonoid scaffold are important determinants in the modulation of vascular ICa1.2.
Figure 5.
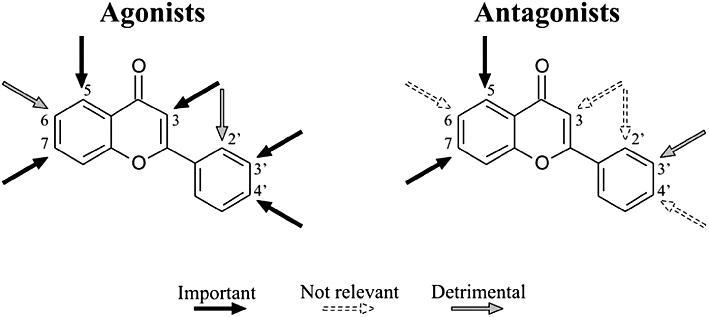
Outlines of the structure-activity relationships emerged in the present study for the series of flavonoids investigated as vascular smooth muscle Cav1.2 channels modulators. Arrows indicate the C with the OH group ‘Important’, ‘Not relevant’, and ‘Detrimental’ for both the agonist and antagonist activity.
So far, Cav1.2 channel agonists (such as the dihydropyridine Bay K 8644), although representing useful probes to explore the pore and gating behaviour of the channel (Tikhonov and Zhorov, 2009), have been shown to lack relevance to cardiovascular medicine because of their toxic effects (vasoconstriction and hypertension). Recent findings indicate that ischemia-induced inhibition of ICa1.2, possibly mediated by oxidative stress, gives rise to delayed death of hippocampal CA1 pyramidal neurons, which are particularly vulnerable to ischaemic insult (Li et al., 2007). Activation of Cav1.2 channels, at a late stage of reperfusion, increases the expression of a group of genes required for neuronal survival. Therefore, if flavonoid agonists are shown to affect Cav1.2 channels in CA1 pyramidal neurones, it will be of interest to assess their efficacy for reducing brain damage after stroke.
Another peculiar feature that emerged from the present study was the voltage-dependence of ICa1.2 modulation exhibited by many flavonoids. Hyperpolarized Vh enhanced the efficacy of isorhamnetin (implying a high affinity of the compound for resting channels) and exposed the stimulatory activity of tamarixetin, scutellarein and baicalein, otherwise almost ineffective at Vh of −50 mV. Conversely, more positive Vh (−50 mV) improved the efficacy of myricetin as well as that of most Cav1.2 channel antagonists (implying a high affinity for the channel in the inactivated state). Furthermore, the inhibition by both genistein and 5,7,2′-trihydroxyflavone shifted toward a stimulatory effect. This pleiomorphic activity, dependent on the changes in environmental conditions (i.e. Vh), shows some similarity to a novel structural model of Cav1.2 channels recently elaborated for dihydropyridine agonists/antagonists (Tikhonov and Zhorov, 2009). According to this model, atomic determinants for both agonist and antagonist capabilities are present within a single dihydropyridine molecule. The emergence of one or another activity depends on both the structural peculiarities of the ligand and the receptor, as well as on the ligand-receptor orientation that can be influenced by experimental conditions.
Quercetin and genistein have been described as inhibitors of protein tyrosine kinase (Glossmann et al., 1981; Akiyama et al., 1987), an enzyme known to affect Ca2+ channel current in vascular smooth muscle (Wijetunge et al., 2000). In general, effects elicited by these inhibitors depend on the full protein tyrosine phosphatase capacity to dephosphorylate tyrosine residues. However, the protein tyrosine phosphatase inhibitor, dephostatin, did not prevent genistein-induced inhibition and quercetin-induced stimulation of ICa1.2. Consequently, within the whole-cell configuration, both flavonoids modulate the channel by a mechanism unrelated to protein tyrosine kinase. This observation is in agreement with previously published data showing that genistein may directly block membrane channels (Smirnov and Aaronson, 1995; Toma et al., 1995).
There is now considerable evidence that the function of vascular ion channels in general, and of Cav1.2 channels in particular, can be altered during changes in cellular redox state (Lee and Griendling, 2008). Cellular redox state may be influenced by radical scavengers such as flavonoids, which are considered dietary antioxidants by virtue of their polyphenolic nature. In the present study, however, flavonoids showing very similar antioxidant activity (Rice-Evans et al., 1996) proved to be either ICa1.2 stimulators, inhibitors or indeed inactive on ICa1.2. It therefore appears that the effects of flavonoids on ICa1.2 are independent of their antioxidant capability.
Very recently, Amberg et al. (2010) described a novel model of local regulation of arterial Cav1.2 channels, where reactive oxygen species increase channel activity, resulting in increased Ca2+ influx, by oxidatively activating PKCα. This regulatory mechanism operates also in rat tail artery myocytes, as demonstrated by the reduction in current intensity caused by the specific inhibitor of PKCα Gö6976. It is conceivable that molecules such as quercetin, capable of generating H2O2 (Perez-Vizcaino and Duarte, 2010), may modulate Cav1.2 channel activity through the same mechanism. This hypothesis, however, is not supported by the observation that Gö6976 was not able to modify quercetin-induced stimulation of ICa1.2. In this context, it is important to mention that quercetin has been described as an inhibitor of PKC (Romero et al., 2009).
Taken together, all these data strengthen the hypothesis that, at least quercetin and genistein, may exert their effect via direct modulation of Cav1.2 channels, even though not all the pathways affecting channel function have been investigated. Furthermore, the analysis of the functional interaction between quercetin and other structurally related flavonoids provided evidence of a common recognition site for polyphenols. When the two most effective stimulators of the Cav1.2 channels, quercetin and myricetin, were assayed in combination, neither additive nor synergistic effects were observed. Rather, a general predominance of quercetin effects over those of myricetin was evident. Because the two flavonoids have a similar efficacy, it is likely that the greater apparent affinity of quercetin for Cav1.2 channels (three-fold higher than that of myricetin) can account for this phenomenon. This hypothesis is further supported by the observation that flavonoids which were either ineffective (rutin and (±)-taxifolin) or weak inhibitors of ICa1.2 (morin) antagonized current stimulation induced by myricetin more efficiently than that induced by quercetin (data not shown). On the other hand, the degree of structural similarity between antagonist flavonoids and quercetin determined how the agonist affected the action of antagonists. In fact, quercetin improved potency, efficacy, and rate of inhibition of its closest analogue, the flavonol resokaempferol, leaving unaltered those of the most different flavonoid, the isoflavone genistein. Intermediate was the case of the two flavones, 5,7,2′-trihydroxyflavone and chrysin. We would infer that, in the presence of quercetin, the rate of dissociation from the channel of both chrysin and 5,7,2′-trihydroxyflavone was reduced, while the increased affinity for resokaempferol was more likely to be a consequence of the faster rate of inhibition. Moreover, resokaempferol antagonized quercetin, possibly reducing its affinity as well as counteracting its intrinsic efficacy, irrespective of the order of the addition of drugs.
Altogether, these data indicate that the vascular Cav1.2 channels are novel targets for flavonoids structurally related to quercetin. This hypothesis is supported by the evidence that their activity varied considerably, following only minor modifications in the molecular structure. However, both the agonist and the antagonist effects here reported required concentrations 2–3 orders of magnitude higher than those of the well-known dihydropyridine Cav1.2 channel agonists and antagonists. This feature, along with the fact that these flavonoid derivatives significantly affect cellular ion trafficking, represent a potential limitation to their use as specific modulators of the Cav1.2 channel. Furthermore, the existence of a flavonoid recognition site on the Cav1.2 channel receptor complex in vascular smooth muscle is still a matter of speculation. Nevertheless, the flavonoid scaffold could turn out to be an interesting template for the design of novel modulators of Cav1.2 channels in vascular smooth muscle.
Acknowledgments
We wish to thank Dr Donata Iozzi for the assistance in some preliminary experiments. Professor Vincenzo Calderone and Professor Massimo Valoti are gratefully acknowledged for critical reading of the manuscript. This work was funded by a grant from the Ministero degli Affari Esteri (Rome, Italy) as stipulated by Law 212 (26–2-1992).
Glossary
Abbreviations
- Bay
K 8644, (S)-(-)-methyl-1,4-dihydro-2,6-dimethyl-3-nitro-4-(2-trifluoromethylphenyl)pyridine-5-carboxylate
- ICa1.2
Cav1.2 channel current
- Vh
holding potential
Conflicts of interest
None.
Supporting information
Additional Supporting Information may be found in the online version of this article:
Figure S1 pKa values for agonists, intermediates, antagonists, and pure antagonists.
Figure S2 Species profile for agonists, intermediates, antagonists, and pure antagonists. In each graph, red line relates to the presence of neutral species, while its sudden decay means the appearance of charged species. Different colours indicate different ionization states; the corresponding OH groups are reported. Numbers close to OH groups indicate the pH value at which their deprotonation occurs. Percentages of neutral species at pH 7.5 are given at the bottom of each graph.
Table S1 Effects of flavonoids on rat tail artery myocytes ICa1.2 inactivation and activation rates
Please note: Wiley-Blackwell are not responsible for the content or functionality of any supporting materials supplied by the authors. Any queries (other than missing material) should be directed to the corresponding author for the article.
References
- Akiyama T, Ishida J, Nakagawa S, Ogawara H, Watanabe S, Itoh N, et al. Genistein, a specific inhibitor of tyrosine-specific protein kinases. J Biol Chem. 1987;262:5592–5595. [PubMed] [Google Scholar]
- Alexander SPH, Mathie A, Peters JA. Guide to Receptors and Channels (GRAC), 4th edn. Br J Pharmacol. 2009;158(Suppl 1):S1–S254. doi: 10.1111/j.1476-5381.2009.00499.x. [DOI] [PMC free article] [PubMed] [Google Scholar]
- Amberg GC, Earley S, Glapa SA. Local regulation of arterial L-type Ca2+ channels by reactive oxygen species. Circ Res. 2010;107:1002–1010. doi: 10.1161/CIRCRESAHA.110.217018. [DOI] [PMC free article] [PubMed] [Google Scholar]
- Carosati E, Sforna G, Pippi M, Marverti G, Ligabue A, Guerrieri D, et al. Ligand-based virtual screening and ADME-tox guided approach to identify triazolo-quinoxalines as folate cycle inhibitors. Bioorgan Med Chem. 2010;18:7773–7785. doi: 10.1016/j.bmc.2010.09.065. [DOI] [PubMed] [Google Scholar]
- Chiwororo WDH, Ojewole JAO. Dual effect of quercetin on rat isolated portal vein smooth muscle contractility. Cardiovasc J Afr. 2010;21:132–136. [PMC free article] [PubMed] [Google Scholar]
- Crivori P, Cruciani G, Carrupt P-A, Testa B. Predicting blood-brain barrier permeation from three-dimensional molecular structure. J Med Chem. 2000;43:2204–2216. doi: 10.1021/jm990968+. [DOI] [PubMed] [Google Scholar]
- Cruciani G, Crivori P, Carrupt P-A, Testa B. Molecular fields in quantitative structure-permeation relationships: the VolSurf approach. J Mol Struc-THEOCHEM. 2000;503:17–30. [Google Scholar]
- Erdman JW, Jr, Balentine D, Arab L, Beecher G, Dwyer JT, Folts J, et al. Flavonoids and heart health: proceedings of the ILSI North America Flavonoids Workshop, May 31-June 1, 2005, Washington, DC. J Nutr. 2007;137:718S–737S. doi: 10.1093/jn/137.3.718S. [DOI] [PubMed] [Google Scholar]
- Fusi F, Saponara S, Gagov H, Sgaragli GP. 2,5-Di-t-butyl-1,4-benzohydroquinone (BHQ) inhibits vascular L-type Ca2+ channel via superoxide anion generation. Br J Pharmacol. 2001;133:988–996. doi: 10.1038/sj.bjp.0704183. [DOI] [PMC free article] [PubMed] [Google Scholar]
- Fusi F, Saponara S, Frosini M, Gorelli B, Sgaragli G. L-type Ca2+ channels activation and contraction elicited by myricetin on vascular smooth muscles. Naunyn Schmiedebergs Arch Pharmacol. 2003;368:470–478. doi: 10.1007/s00210-003-0836-y. [DOI] [PubMed] [Google Scholar]
- Fusi F, Sgaragli G, Saponara S. Mechanism of myricetin stimulation of vascular L-type Ca2+ current. J Pharmacol Exp Ther. 2005;313:790–797. doi: 10.1124/jpet.104.080135. [DOI] [PubMed] [Google Scholar]
- Fusi F, Cavalli M, Mulholland D, Crouch NR, Coombes P, Dawson G, et al. Cardamonin is a bifunctional vasodilator that inhibits Cav1.2 current and stimulates KCa1.1 current in rat tail artery myocytes. J Pharmacol Exp Ther. 2010;332:531–540. doi: 10.1124/jpet.109.161265. [DOI] [PubMed] [Google Scholar]
- Glossmann H, Presek P, Eigenbrodt E. Quercetin inhibits tyrosine phosphorylation by the cyclic nucleotide-independent, transforming protein kinase, pp60src. Naunyn Schmiedebergs Arch Pharmacol. 1981;317:100–102. doi: 10.1007/BF00506266. [DOI] [PubMed] [Google Scholar]
- Hamill OP, Marty A, Neher E, Sakmann B, Sigworth FJ. Improved patch-clamp techniques for high-resolution current recording from cells and cell-free membrane patches. Pflügers Arch. 1981;391:85–100. doi: 10.1007/BF00656997. [DOI] [PubMed] [Google Scholar]
- Lee MY, Griendling KK. Redox signaling, vascular function, and hypertension. Antioxid Redox Signal. 2008;10:1045–1059. doi: 10.1089/ars.2007.1986. [DOI] [PMC free article] [PubMed] [Google Scholar]
- Li XM, Yang JM, Hu DH, Hou FQ, Zhao M, Zhu XH, et al. Contribution of downregulation of L-type calcium currents to delayed neuronal death in rat hippocampus after global cerebral ischemia and reperfusion. J Neurosci. 2007;27:5249–5259. doi: 10.1523/JNEUROSCI.0802-07.2007. [DOI] [PMC free article] [PubMed] [Google Scholar]
- Manchester J, Walkup G, Rivin O, You Z. Evaluation of pKa estimation methods on 211 druglike compounds. J Chem Inf Model. 2010;50:565–571. doi: 10.1021/ci100019p. [DOI] [PubMed] [Google Scholar]
- Milletti F, Storchi L, Sforna G, Cruciani G. New and original pKa prediction method using grid molecular interaction fields. J Chem Inf Model. 2007;47:2172–2181. doi: 10.1021/ci700018y. [DOI] [PubMed] [Google Scholar]
- Perez-Vizcaino F, Duarte J. Flavonols and cardiovascular disease. Mol Aspects Med. 2010;31:478–494. doi: 10.1016/j.mam.2010.09.002. [DOI] [PubMed] [Google Scholar]
- Petkov GV, Fusi F, Saponara S, Gagov H, Sgaragli GP, Boev KK. Characterization of voltage-gated calcium currents in freshly isolated smooth muscle cells from rat tail main artery. Acta Physiol Scand. 2001;173:257–265. doi: 10.1046/j.1365-201X.2001.00907.x. [DOI] [PubMed] [Google Scholar]
- Rice-Evans CA, Miller NJ, Paganga G. Structure-antioxidant activity relationships of flavonoids and phenolic acids. Free Radic Biol Med. 1996;20:933–956. doi: 10.1016/0891-5849(95)02227-9. [DOI] [PubMed] [Google Scholar]
- Ritz MF, Ratajczak P, Curin Y, Cam E, Mendelowitsch A, Pinet F, et al. Chronic treatment with red wine polyphenol compounds mediates neuroprotection in a rat model of ischemic cerebral stroke. J Nutr. 2008;138:226–234. doi: 10.1093/jn/138.3.519. [DOI] [PubMed] [Google Scholar]
- Romero M, Jiménez R, Sánchez M, López-Sepúlveda R, Zarzuelo MJ, O'Valle F, et al. Quercetin inhibits vascular superoxide production induced by endothelin-1: role of NADPH oxidase, uncoupled eNOS and PKC. Atherosclerosis. 2009;202:58–67. doi: 10.1016/j.atherosclerosis.2008.03.007. [DOI] [PubMed] [Google Scholar]
- Saponara S, Sgaragli G, Fusi F. Quercetin as a novel activator of L-type Ca2+ channels in rat tail artery smooth muscle cells. Br J Pharmacol. 2002;135:1819–1827. doi: 10.1038/sj.bjp.0704631. [DOI] [PMC free article] [PubMed] [Google Scholar]
- Saponara S, Testai L, Iozzi D, Martinotti E, Martelli A, Chericoni S, et al. (+/-)-Naringenin as large conductance Ca2+-activated K+ (BKCa) channel opener in vascular smooth muscle cells. Br J Pharmacol. 2006;149:1013–1021. doi: 10.1038/sj.bjp.0706951. [DOI] [PMC free article] [PubMed] [Google Scholar]
- Saponara S, Sgaragli G, Fusi F. Quercetin antagonism of Bay K 8644 effects on rat tail artery L-type Ca2+ channels. Eur J Pharmacol. 2008;598:75–80. doi: 10.1016/j.ejphar.2008.08.016. [DOI] [PubMed] [Google Scholar]
- Scholz EP, Zitron E, Katus HA, Karle CA. Cardiovascular ion channels as a molecular target of flavonoids. Cardiovasc Ther. 2010;28:e46–e52. doi: 10.1111/j.1755-5922.2010.00212.x. [DOI] [PubMed] [Google Scholar]
- Smirnov SV, Aaronson PI. Inhibition of vascular smooth muscle cell K+ currents by tyrosine kinase inhibitors genistein and ST 638. Circ Res. 1995;76:310–316. doi: 10.1161/01.res.76.2.310. [DOI] [PubMed] [Google Scholar]
- Stansfeld C, Mathie A. Recording membrane currents of peripheral neurones in short-term culture. In: Wallis DI, editor. Electrophysiology. A Practical Approach. Oxford: IRL Press; 1993. pp. 3–28. [Google Scholar]
- Suri S, Liu XH, Rayment S, Hughes DA, Kroon PA, Needs PW, et al. Quercetin and its major metabolites selectively modulate cyclic GMP-dependent relaxations and associated tolerance in pig isolated coronary artery. Br J Pharmacol. 2010;159:566–575. doi: 10.1111/j.1476-5381.2009.00556.x. [DOI] [PMC free article] [PubMed] [Google Scholar]
- Tikhonov DB, Zhorov BS. Structural model for dihydropyridine binding to L-type calcium channels. J Biol Chem. 2009;284:19006–19017. doi: 10.1074/jbc.M109.011296. [DOI] [PMC free article] [PubMed] [Google Scholar]
- Toma C, Jensen PE, Prieto D, Hughes A, Mulvany MJ, Aalkjaer C. Effects of tyrosine kinase inhibitors on the contractility of rat mesenteric resistance arteries. Br J Pharmacol. 1995;114:1266–1272. doi: 10.1111/j.1476-5381.1995.tb13342.x. [DOI] [PMC free article] [PubMed] [Google Scholar]
- Valente T, Hidalgo J, Bolea I, Ramirez B, Anglés N, Reguant J, et al. A diet enriched in polyphenols and polyunsaturated fatty acids, LMN diet, induces neurogenesis in the subventricular zone and hippocampus of adult mouse brain. J Alzheimers Dis. 2009;18:849–865. doi: 10.3233/JAD-2009-1188. [DOI] [PubMed] [Google Scholar]
- Wijetunge S, Lymn JS, Hughes AD. Effects of protein tyrosine kinase inhibitors on voltage-operated calcium channel currents in vascular smooth muscle cells and pp60c-src kinase activity. Br J Pharmacol. 2000;129:1347–1354. doi: 10.1038/sj.bjp.0703186. [DOI] [PMC free article] [PubMed] [Google Scholar]
- Wold S, Albano C, Dunn WJ, III, Edlund U, Esbensen K, Geladi P, et al. Multivariate data analysis in chemistry. In: Kowalsky BR, editor. Chemometrics: Mathematical and Statistics in Chemistry. Dordrecht, Holland: D Reidel Publishing Company; 1984. pp. 17–96. [Google Scholar]
Associated Data
This section collects any data citations, data availability statements, or supplementary materials included in this article.