

Abstract
The human brain thalami play essential roles in integrating cognitive, sensory, and motor functions. In multiple sclerosis (MS), quantitative magnetic resonance imaging (qMRI) measurements of the thalami provide important biomarkers of disease progression, but late development and aging confound the interpretation of data collected from patients over a wide age range. Thalamic tissue volume loss due to natural aging and its interplay with lesion-driven pathology has not been investigated previously. In this work, we used standardized thalamic volumetry combined with diffusion tensor imaging, T2 relaxometry, and lesion mapping on large cohorts of controls (N = 255, age range = 6.2–69.1 years) and MS patients (N = 109, age range = 20.8–68.5 years) to demonstrate early age- and lesion-independent thalamic neurodegeneration.
Introduction
The thalamus is composed of complex gray matter (GM) nuclei interconnected with white matter (WM) fascicles and provides an essential relay to the cortex, striatum, brainstem, and cerebellum (Behrens et al., 2003). Postmortem studies on multiple sclerosis (MS) patients indicated atrophic thalami with reduced neuronal density (Cifelli et al., 2002; Vercellino et al., 2009). Several in vivo studies have shown abnormal thalami in MS using different quantitative neuroimaging methods, including glucose metabolism (Blinkenberg et al., 2000; Derache et al., 2006), voxel-based morphometry (Ceccarelli et al., 2008; Tao et al., 2009), manual delineation (Houtchens et al., 2007; Rocca et al., 2010), automated atlas-based volumetry (Ramasamy et al., 2009; Pellicano et al., 2010), spectroscopy (Cifelli et al., 2002; Geurts et al., 2006), perfusion (Varga et al., 2009), relaxometry (Niepel et al., 2006), iron-mapping methods (Ge et al., 2007), diffusion tensor imaging (DTI) (Tovar-Moll et al., 2009), and DTI-based fiber tractography (Henry et al., 2009) Thalamic atrophy has been reported in children diagnosed with MS (Mesaros et al., 2008; Aubert-Broche et al., 2011), clinically isolated syndrome (CIS) indicative of MS (Henry et al., 2009), and adult phenotypes of MS, including relapsing-remitting (RRMS), secondary-progressive (SPMS), and primary progressive MS (Ceccarelli et al., 2008; Rocca et al., 2010). In MS, reduced thalamic volume and hypometabolism were implicated in fatigue (Pellicano et al., 2010), cognitive dysfunction (Derache et al., 2006), and physical disability (Niepel et al., 2006). Thalamic lesions have been reported to be rare in RRMS using in vivo MRI (Bagnato et al., 2006; Derache et al., 2006; Tovar-Moll et al., 2009). However, thalamic lesions have been reported to be more visible using advanced histopathological methods (Vercellino et al., 2009).
In the absence of visible lesions, thalamic neuronal loss can be attributed to extrinsic and intrinsic factors (Cifelli et al., 2002; Henry et al., 2009; Sepulcre et al., 2009; Vercellino et al., 2009). Extrinsic factors are related to remote lesion activity in connected regions (e.g., anterograde degeneration in optic nerve and retrograde effects of lesions in brainstem, spinal cord, cerebellar, or cerebral WM). Intrinsic factors relate to the possible effects of microscopic inflammatory lesions within internuclear thalamic WM not visible on MRI, which could lead eventually to thalamocortical neuronal loss (Cifelli et al., 2002; Sepulcre et al., 2009; Vercellino et al., 2009).
The thalamus volume increases in typically developing children (Ostby et al., 2009) and decreases in healthy adults (Walhovd et al., 2011). Accounting for the late development and natural aging of the thalamus is important to help interpret the findings in MS in particular when MS patients include young adults. There has been no comprehensive in vivo report across the healthy human lifespan on the volumetry and microstructural attributes of the normal-appearing thalami relative to a large cohort of young and aging MS patients. The availability of such baseline data would help model the contributors to the pathogenesis of MS.
In this work, we hypothesized that the thalamus proper volume and its corresponding quantitative magnetic resonance imaging (qMRI) microstructural attributes can mark the lesion-driven atrophy relative to a neurodegenerative component that is independent of age and total brain lesion volume (LV). To accomplish this goal, we used standardized and multimodal qMRI that included transverse magnetization relaxation time (T2) and DTI (Pierpaoli et al., 1996) combined with lesion-mapping methods on a large cohort of healthy controls aged 6–69 years to interpret data collected from a substantial cohort of CIS, RRMS, and SPMS patients.
Materials and Methods
Study population.
The MRI protocol was approved by our Institutional Review Board. Written informed consent was obtained from all subjects or their guardians in the case of healthy children. Table 1 provides a detailed account of the demographics, clinical, and whole-brain lesion information on all subjects. In brief, we included 109 patients (75% females; 9 CIS, 88 RRMS, and 12 SPMS), aged 20.8–68.5 years, with a disease duration (DD) of 0.1–36.8 years and expanded disability status score (EDSS) from 0 to 6.5. At the time of their imaging session, 47% of patients were using glatiramer acetate, ∼22% an interferon β preparation (73.7% a subcutaneous product), and ∼25% were not on any disease modifying therapy. In addition, 255 healthy controls (46.3% females) aged 6.2–69.1 years were recruited from the local community and university staff. The healthy controls included 126 children (39% girls) aged 6.2–20.7 years and 129 adults (54% women) aged 20.8–69.1 years. The healthy children were recruited as part of ongoing clinical studies using identical MRI data acquisition protocols. All control subjects were screened for history of head trauma, surgery, chronic illness, alcohol, and/or drug abuse, neurological illness, and current pregnancy. None of the controls in this study reported any neurological conditions and their fluid-attenuated inversion recovery (FLAIR) images were judged to be normal by a board certified radiologist.
Table 1.
Basic demographics, clinical, MRI-based whole brain lesion volume and normalized thalamic volume information on healthy children, adult controls and the three patient groups
| Controls |
Patients |
||||
|---|---|---|---|---|---|
| Child | Adult | CIS | RRMS | SPMS | |
| N (F) | 126 (49) | 129 (69) | 9 (7) | 88 (68) | 12 (7) |
| (%Females) | (39%) | (54%) | (78%) | (77%) | (58%) |
| Age (years) | |||||
| Mean ± SD | 12.2 ± 3.8 | 36.0 ± 11.3 | 39.2 ± 14.7 | 42.6 ± 9.8 | 54.7 ± 9.6 |
| Median | 11.3 | 34.0 | 40.2 | 44.7 | 56.1 |
| [Range] | [6.2–20.7] | [20.8–69.1] | [20.8–50.6] | [22.0–63.1] | [35.4–68.5] |
| EDSS | Not applicable | 2.8 ± 3.2 | 11.1 ± 9.2 | 18.6 ± 9.6 | |
| 1.3 | 10.1 | 18.9 | |||
| [0.2–8.8] | [0.1–36.8] | [1.8–33.4] | |||
| Disease duration (years) | Not applicable | 0.4 ± 0.8 | 1.7 ± 1.6 | 4.2 ± 1.3 | |
| 0 | 1.5 | 4 | |||
| [0–2] | [0–6.5] | [2–6] | |||
| Whole-brain lesion volume (ml) | No lesions | 2.21 ± 2.74 | 12.23 ± 11.69 | 22.31 ± 9.70 | |
| 1.34 | 7.26 | 26.84 | |||
| [0.15–8.16] | 0.18–44.79 | [6.98–37.27] | |||
| NTV | 1.09 ± 0.11 | 1.03 ± 0.10 | 1.00 ± 0.07 | 0.92 ± 0.11 | 0.82 ± 0.09 |
p age (CIS ∼ RRMS) = 0.32; p age (SPMS > RRMS) = 3 × 10⁻⁵; p age (CIS ∼ adult controls) = 0.41; p age (RRMS > adult controls) = 1.7 × 10⁻⁵; p NTV (adult controls > RRMS) = 4.8 × 10⁻¹³ (−11%); p NTV (CIS > RRMS) = 0.03; p NTV (CIS ∼ adult controls) = 0.36; p NTV (healthy children > adults) <1 × 10⁻⁴.
MRI data acquisition.
All MRI studies were performed on a 3.0 T Philips Intera scanner with a dual quasar gradient system with maximum gradient amplitude of 80 mT/m and an eight channel SENSE-compatible head coil (Philips Medical Systems). MRI data collected on each subject included three-dimensional T1-weighted anatomical, two-dimensional DTI data (Hasan and Narayana, 2003) along with dual fast spin-echo (FSE) and FLAIR for lesion localization and quantification (Sajja et al., 2006).
MRI data processing.
The T1-weighted and T2-weighted volumes were masked to remove nonbrain tissues (Smith, 2002). The intracranial volume (ICV) was computed from the T2-weighted volumes and included both ventricular and sulcal CSF as described previously (Courchesne et al., 2000; Hasan et al., 2007). The T1-weighted volumes were prepared for subsequent processing, segmentation, and anatomical labeling using FreeSurfer (Fischl et al., 2002; Desikan et al., 2006) (http://surfer.nmr.mgh.harvard.edu/fswiki/FreeSurferWiki). The application and validation of FreeSurfer to MS brain tissue segmentation and atlas labeling has been detailed in several reports (Sailer et al., 2003; Ramasamy et al., 2009; Derakhshan et al., 2010). The T2 relaxation time (Hasan et al., 2010, 2011a) and diffusion tensor metrics were estimated from each anatomical region as detailed previously (Walimuni and Hasan, 2011).
Lesion volume segmentation and lesion probability map estimation.
Whole-brain lesion volume (LV) was quantified in the patient groups using the coregistered dual FSE and FLAIR volumes (Sajja et al., 2006; Hasan et al., 2009; Tao et al., 2009). After inspection by a trained rater, the lesion volume maps were saved as binary masks to enable fusion with other multimodal volumes acquired from the same subject (Brett et al., 2001). Lesion probability maps were generated as described previously (Narayanan et al., 1997; Ceccarelli et al., 2008). The lesion and qMRI maps were visualized and fused with MRIcroN (http://www.nitrc.org/projects/mricron/).
Multimodal MRI data fusion.
All MRI-derived volumes (i.e., T2, lesion masks) and DTI-derived volumes (i.e., fractional anisotropy, mean, radial, and axial diffusivities) were coregistered to the T1-weighted volume. Lesion masks were used to null out lesions from the atlas-based volume results (Brett et al., 2001; Ceccarelli et al., 2008; Aubert-Broche et al., 2011).
Scanner stability and data quality assurance.
The MRI data used in this report were collected over ∼5 year span during which scanner stability, intrascan and interscan reliability, and reproducibility were monitored closely using a database of water phantom relaxation time and DTI measurements (Hasan, 2007) and brain data acquired serially on healthy children (Hasan et al., 2011b), healthy adults (Hasan et al., 2007; Hasan and Frye, 2011), and MS patients (Hasan et al., 2009). The age-expected volume of regional WM tracts, subcortical GM, and whole-brain tissue have been reported previously on ∼60% of all healthy children and adults included in this report (Hasan et al., 2007, 2010a,b; Hasan and Frye, 2011). The age-expected global or regional volumetry and their corresponding microstructural attributes obtained on healthy children, adults and across the lifespan were consistent with data published by others (Courchesne et al., 2000; Sowell et al., 2003; Lebel et al., 2008; Leppert et al., 2009; Ostby et al., 2009; Saito et al., 2009; Kochunov et al., 2010; Walhovd et al., 2011). The brain MRI data of all controls included in this report were void of lesions. MS lesions and segmented volume boundaries were fused and inspected by trained raters.
Statistical analysis.
Given several reports on minute gender or hemispheric effects compared to pathology and age (Fjell et al., 2009; Hasan et al., 2009; Ostby et al., 2009; Walhovd et al., 2011), we pooled the measurements from both left and right thalami. Since we used data from healthy children, young and older adults, it was essential to fit the normalized thalami volume as a function of age using a combination of linear, quadratic, or cubic coefficients (Hasan et al., 2010a,b; Walhovd et al., 2011). Generalized linear models and goodness-of-fit methods were used to estimate the best fit parameters and their corresponding standard errors (Hasan et al., 2010a,b). In patients the correlations between age, normalized thalamic volumes (NTV), and whole-brain LV, disease duration, and T2 values and DTI-derived metrics were computed using the Pearson correlation coefficient. Age-adjusted correlations between EDSS score and all other qMRI variables were computed using the Spearman coefficient and analysis of covariance. Slopes and rates of change of MRI metrics with age were compared using the r-to-z Fisher transform. Comparisons between group means and medians were performed using ANOVA (t test or F = t2) and the Mann–Whitney U test. All group qMRI comparison differences and statistical significance were computed volumewise in native data space and were presented in standard space for visual inspection and fusion with the lesion probability maps. All statistical analyses used MATLAB R12.1 Statistical Toolbox v 3.0 (The MathWorks).
Results
Population demographics and clinical information
Healthy boys and girls, men, and women or males and females did not differ in age (p > 0.1). Despite differences in age range, the CIS and RRMS groups were comparable in mean age (p = 0.3), whereas the SPMS group was older than the RRMS (p = 3 × 10⁻⁵). On the entire patient population, significant correlations were noted between age, DD, LV, and EDSS: r(age, EDSS) = 0.34 (p = 3 × 10⁻⁴), r(age, DD) = 0.57 (p = 1 × 10⁻¹⁰), r(age, LV) = 0.19 (p = 0.04), r(DD, EDSS) = 0.48 (p = 1 × 10⁻⁷), r(LV, EDSS) = 0.50 (p = 3 × 10⁻⁸), and r(LV, DD) = 0.31 (p = 0.001).
Visualization of lesions in patients
Figure 1A shows the lesion probability map on the CIS, SPMS (Fig. 1B), and RRMS (Fig. 1C) patients at a selected level highlighting the anterior, middle, and posterior thalamocortical connections. Figure 1D highlights the regions with the highest lesion frequency in the RRMS patients such as the posterior corona radiata and optic radiations. In all MS phenotypes, lesions were least frequent in the thalamus proper, amygdalae, putamen, and cerebellar GM (Fig. 1).
Figure 1.

Spatial distribution of lesions or lesion probability map viewed in standard Montreal Neurological Institute (MNI) space on CIS (A), SPMS (B), and RRMS (C, D). Note the areas of high lesion frequency (posterior corona radiata, optic radiations) and regions with low lesions (e.g., thalamus proper).
Widespread loss of tissue volume or macrostructure and changes in microstructure in the RRMS cohort have been reported previously (Hasan et al., 2011c,d). In this report and the analyses below, we only focused on the normal-appearing thalamus proper to help identify markers of tissue injury in MS.
Group differences in thalamic volumetry
To minimize the effects of brain size variability between males and females, the ICV was used to normalize the thalamic volume measurements (Courchesne et al., 2000; Cifelli et al., 2002; Pellicano et al., 2010). The normal-appearing NTV or percentage of total thalamic proper volume-to-ICV (VOLp = VOL/ICV × 100%) was larger in healthy children than in adult controls (p = 1 × 10⁻⁴). The NTV was comparable between adult controls and CIS (p = 0.36). The NTV was larger in CIS than in RRMS (p = 0.03). The NTV was larger in adult controls than in RRMS (p = 4.8 × 10⁻¹³) and larger in adult controls than in SPMS (p = 1 × 10⁻¹⁰; ∼20%).
Thalamic volumetry in healthy children and adults
The NTV increased with age in healthy children: NTV(Age) = (1.012 ± 0.033) + (0.006 ± 0.003) × Age (r = 0.205; p = 0.021; N = 126), whereas in adult controls, the NTV decreased with age: NTV(Age) = (1.161 ± 0.028) − (0.004 ± 0.001) × Age (r = −0.391; p = 4.5 × 10⁻⁶; N = 129).
Thalamic qMRI metrics of healthy controls across the lifespan and MS patients
Figure 2A–D shows the thalamic volume percentage (Fig. 2A) and corresponding T2 relaxation time (Fig. 2B), fractional anisotropy (FA) (Fig. 2C), and average or mean diffusivity (Fig. 2D) as age advances on controls and patients. Note the rise, plateau, and fall of qMRI metrics upon pooling all healthy controls reflecting expected changes in tissue microstructure. In healthy controls, curvilinear age effects on T2, mean diffusivity, and FA are significant even without using the children data, which were more crucial to capturing the age-expected NTV. Compared to adult controls, note that the NTV is reduced in patients (p < 10−14) along with elevated T2, reduced FA, and elevated tensor diffusivities.
Figure 2.
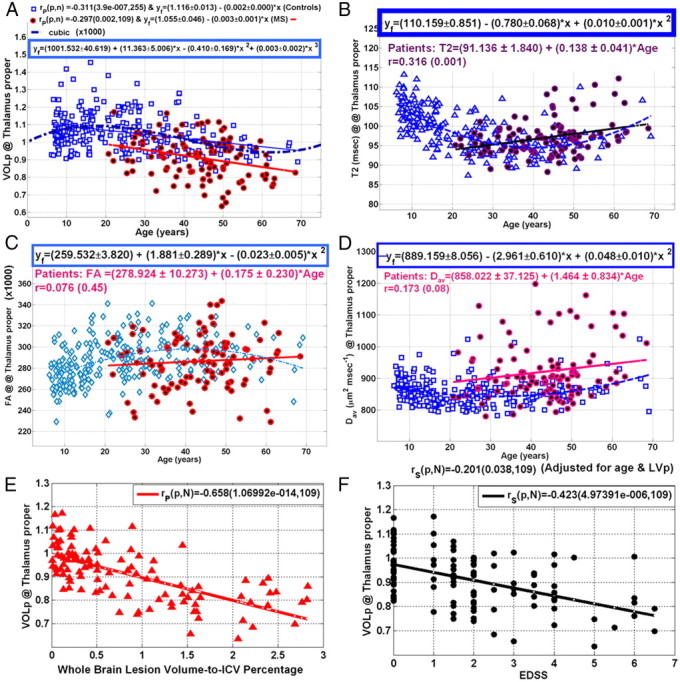
Representative illustration and analysis of age dependence of thalamic qMRI metrics in all controls and patients using scatter plots and linear regression. A–D, Volume percentage of the thalamus proper (A) and corresponding T2 relaxation time values (B), fractional anisotropy (× 1000.0) (C), and mean or average diffusivity (Dav) (D). Note the rise in normalized thalamic volume in healthy children and consequent rapid decrease in both healthy adults and patients. Note the curvilinear age-expected thalamic volumes in healthy controls. E, F, The variation of thalamic volume percentage with whole-brain lesion volume-to-ICV percentage (LVp) (E) and the scatter and regression of NTV with EDSS (F).
Thalamic qMRI metrics variation with age, DD, LV, and EDSS in MS
Table 2 summarizes the correlations of thalamic qMRI metrics in patients with age [Fig. 2A; NTV(Age in years) = (1.05 ± 0.046) − (0.003 ± 001) × Age; r = −0.297; p = 0.002], DD [NTV(DD in years) = (0.962 ± 0.016) − (0.004 ± 0.001) × DD; r = −0.364; p = 1 × 10⁻⁴], LV (Fig. 2E), and EDSS (Fig. 2F). In addition, Table 2 provides also the EDSS vs NTV correlation upon adjusting for age- and whole-brain lesion volume. Note that the correlation of EDSS with NTV adjusted for age and LV was statistically significant (r = −0.20; p = 0.04; Fig. 2F).
Table 2.
Correlation coefficient and statistical significance of the average normal-appearing thalamic qMRI metrics with age, disease duration, whole-brain LV, and EDSS in the 109 patients
| qMRI | Age | DD r (p) | LV r (p) | EDSS r (p) | EDSS-covaried (age & LV) r (p) |
|---|---|---|---|---|---|
| VOLp | −0.297 | −0.257 | −0.658 | −0.423 | −0.20 |
| (0.002) | (0.007) | (1.07 × 10⁻¹⁴) | (5 × 10⁻⁶) | (0.04) | |
| T2 | 0.316 | 0.285 | 0.45 | 0.325 | 0.06 |
| (0.001) | (0.004) | (2 × 10⁻⁶) | (0.0008) | (0.59) | |
| FA | 0.076 | 0.112 | 0.092 | 0.045 | −0.004 |
| (0.45) | (0.26) | (0.36) | (0.66) | (0.97) | |
| MD | 0.172 | 0.150 | 0.356 | 0.192 | 0.06 |
| (0.08) | (0.13) | (0.0003) | (0.05) | (0.58) | |
| AD | 0.231 | 0.196 | 0.433 | 0.225 | 0.046 |
| (0.02) | (0.048) | (6 × 10⁻⁶) | (0.02) | (0.65) | |
| RD | 0.132 | 0.117 | 0.299 | 0.165 | 0.06 |
| (0.19) | (0.24) | (0.002) | (0.10) | (0.57) |
The EDSS adjusted for age and LV provides a means to quantify the direct effects of disease progression without the confounding effects of natural aging and whole-brain LV. Statistically significant values (p < 0.05) are in bold. MD, AD, RD = mean, axial, and radial tensor diffusivities, respectively.
Discussion
We presented for the first time in vivo the age-expected thalamic volumetry, and corresponding T2 relaxation time, and DTI metrics on a relatively large cohort of MS patients and healthy controls across the active human lifespan. We also provided cross-sectional qMRI metrics of the thalami on patients as function of disease duration, whole-brain lesion volume, and disability.
A major finding of this report is that thalamic volume loss in MS patients correlated with disability after adjusting for natural aging and whole-brain lesion volume. Accounting for age is important as thalamic volume and corresponding qMRI metrics also depended on age. The relationship between age and qMRI metrics is not necessarily constant or linear as commonly assumed. Incorporating large cohorts of healthy controls and patients enabled the quantification of development and early and late aging effects on the disease-driven tissue loss.
Our results on the normative thalamic volumetry or macrostructure across the lifespan consolidate several past and recent reports (Pieperhoff et al., 2008) on the development (Ostby et al., 2009) and aging of this important territory using similar methods applied on multicenter cohorts (Walhovd et al., 2011). The thalamic volume evolution and corresponding microstructural changes across the lifespan indexed by T2 relaxation time, diffusion anisotropy, and mean diffusivity mark the changes in thalamic connections, subcortical, and cortical domains (Sowell et al., 2003) that are subserved by this territory (Behrens et al., 2003).
Our findings in regards to decreased NTV in MS patients compared with healthy adults consolidate previous reports (Houtchens et al., 2007; Tao et al., 2009; Pellicano et al., 2010; Rocca et al., 2010).
Our results on the lesion distribution and in particular minimal thalamic lesions are consistent with several histopathological (Brownell and Hughes, 1962) and noninvasive neuroimaging (Bagnato et al., 2006; Derache et al., 2006; Ceccarelli et al., 2008; Tovar-Moll et al., 2009; Pellicano et al., 2010) reports. Reduced thalamic lesion frequency may be explained by the high baseline or normative arterial perfusion of the thalamus and other deep gray matter structures such as the putamen (Heiss et al., 2004) compared to adjacent white matter (Varga et al., 2009).
The elevated thalamic T2 relaxation average values and increased mean diffusivity measurements reflect reduced microstructural organization (Beaulieu, 2002) and may be related to the pathological hallmarks of MS, which include edema, neuroaxonal loss, gliosis, and demyelination (Cifelli et al., 2002; Vercellino et al., 2009).
In the absence of visible thalamic lesions triggered by any injury mechanism, the loss of thalamic macrostructural volume and microstructural integrity evidenced by increased diffusivity and increased T2 relaxation time may then be related to its connections to the cortex (Behrens et al., 2003) and other brain regions through white matter pathways (Henry et al., 2009). In our analyses, we covaried the effects of age and whole-brain lesion volume, and yet thalamic volume loss predicted disability, hinting at a neurodegenerative element that is not explained by inflammatory lesions (Cifelli et al., 2002; Lassmann, 2007; Chard and Miller, 2009; Antulov et al., 2011).
The normal-appearing or lesion-free thalami volumetry in MS patients seem to be smaller than controls at all ages (Fig. 2A), hinting at early neurodegenerative pathology. Extending the MS population to include younger MS patients would provide additional clues to the evolution of this challenging disease.
In conclusion, using a multimodal qMRI approach applied to the thalami and accounting for lesion distribution, late development, and natural aging, we were able to demonstrate that MS pathology has a neurodegenerative component independent from lesions. Our data on the thalamus should help in the future design of clinical trials that incorporate patients with wide age span that include children.
Footnotes
This work is funded by the National Institutes of Health (NIH/NINDS R01-NS052505-04) and the Dunn Research Fund to K.M.H., NIH/NIBIB EB002095 to P.A.N., an unrestricted gift from the Band Against Multiple Sclerosis to J.S.W., NS046565 to R.E.F., and R01 NS046308 awarded to L.E.-C. The purchase of the 3.0 T MRI Clinical Scanner was partially funded by NIH Grant S10 RR19186 to P.A.N. We thank Vipul Kumar Patel for helping in data acquisition.
The authors declare no competing financial interests.
References
- Antulov R, Carone DA, Bruce J, Yella V, Dwyer MG, Tjoa CW, Benedict RH, Zivadinov R. Regionally distinct white matter lesions do not contribute to regional gray matter atrophy in patients with multiple sclerosis. J Neuroimaging. 2011;21:210–218. doi: 10.1111/j.1552-6569.2010.00482.x. [DOI] [PubMed] [Google Scholar]
- Aubert-Broche B, Fonov V, Ghassemi R, Narayanan S, Arnold DL, Banwell B, Sled JG, Collins DL. Regional brain atrophy in children with multiple sclerosis. Neuroimage. 2011;58:409–415. doi: 10.1016/j.neuroimage.2011.03.025. [DOI] [PubMed] [Google Scholar]
- Bagnato F, Butman JA, Gupta S, Calabrese M, Pezawas L, Ohayon JM, Tovar-Moll F, Riva M, Cao MM, Talagala SL, McFarland HF. In vivo detection of cortical plaques by MR imaging in patients with multiple sclerosis. AJNR Am J Neuroradiol. 2006;27:2161–2167. [PMC free article] [PubMed] [Google Scholar]
- Beaulieu C. The basis of anisotropic water diffusion in the nervous system—a technical review. NMR Biomed. 2002;15:435–455. doi: 10.1002/nbm.782. [DOI] [PubMed] [Google Scholar]
- Behrens TE, Johansen-Berg H, Woolrich MW, Smith SM, Wheeler-Kingshott CA, Boulby PA, Barker GJ, Sillery EL, Sheehan K, Ciccarelli O, Thompson AJ, Brady JM, Matthews PM. Non-invasive mapping of connections between human thalamus and cortex using diffusion imaging. Nat Neurosci. 2003;6:750–757. doi: 10.1038/nn1075. [DOI] [PubMed] [Google Scholar]
- Blinkenberg M, Rune K, Jensen CV, Ravnborg M, Kyllingsbaek S, Holm S, Paulson OB, Sørensen PS. Cortical cerebral metabolism correlates with MRI lesion load and cognitive dysfunction in MS. Neurology. 2000;54:558–564. doi: 10.1212/wnl.54.3.558. [DOI] [PubMed] [Google Scholar]
- Brett M, Leff AP, Rorden C, Ashburner J. Spatial normalization of brain images with focal lesions using cost function masking. Neuroimage. 2001;14:486–500. doi: 10.1006/nimg.2001.0845. [DOI] [PubMed] [Google Scholar]
- Brownell B, Hughes JT. The distribution of plaques in the cerebrum in multiple sclerosis. J Neurol Neurosurg Psychiatry. 1962;25:315–320. doi: 10.1136/jnnp.25.4.315. [DOI] [PMC free article] [PubMed] [Google Scholar]
- Ceccarelli A, Rocca MA, Pagani E, Colombo B, Martinelli V, Comi G, Filippi M. A voxel-based morphometry study of grey matter loss in MS patients with different clinical phenotypes. Neuroimage. 2008;42:315–322. doi: 10.1016/j.neuroimage.2008.04.173. [DOI] [PubMed] [Google Scholar]
- Chard D, Miller D. Is multiple sclerosis a generalized disease of the central nervous system? An MRI perspective. Curr Opin Neurol. 2009;22:214–218. doi: 10.1097/wco.0b013e32832b4c62. [DOI] [PubMed] [Google Scholar]
- Cifelli A, Arridge M, Jezzard P, Esiri MM, Palace J, Matthews PM. Thalamic neurodegeneration in multiple sclerosis. Ann Neurol. 2002;52:650–653. doi: 10.1002/ana.10326. [DOI] [PubMed] [Google Scholar]
- Courchesne E, Chisum HJ, Townsend J, Cowles A, Covington J, Egaas B, Harwood M, Hinds S, Press GA. Normal brain development and aging: quantitative analysis at in vivo MR imaging in healthy volunteers. Radiology. 2000;216:672–682. doi: 10.1148/radiology.216.3.r00au37672. [DOI] [PubMed] [Google Scholar]
- Derache N, Marié RM, Constans JM, Defer GL. Reduced thalamic and cerebellar rest metabolism in relapsing-remitting multiple sclerosis, a positron emission tomography study: correlations to lesion load. J Neurol Sci. 2006;245:103–109. doi: 10.1016/j.jns.2005.09.017. [DOI] [PubMed] [Google Scholar]
- Derakhshan M, Caramanos Z, Giacomini PS, Narayanan S, Maranzano J, Francis SJ, Arnold DL, Collins DL. Evaluation of automated techniques for the quantification of grey matter atrophy in patients with multiple sclerosis. Neuroimage. 2010;52:1261–1267. doi: 10.1016/j.neuroimage.2010.05.029. [DOI] [PubMed] [Google Scholar]
- Desikan RS, Ségonne F, Fischl B, Quinn BT, Dickerson BC, Blacker D, Buckner RL, Dale AM, Maguire RP, Hyman BT, Albert MS, Killiany RJ. An automated labeling system for subdividing the human cerebral cortex on MRI scans into gyral based regions of interest. Neuroimage. 2006;31:968–980. doi: 10.1016/j.neuroimage.2006.01.021. [DOI] [PubMed] [Google Scholar]
- Fischl B, Salat DH, Busa E, Albert M, Dieterich M, Haselgrove C, van der Kouwe A, Killiany R, Kennedy D, Klaveness S, Montillo A, Makris N, Rosen B, Dale AM. Whole brain segmentation: automated labeling of neuroanatomical structures in the human brain. Neuron. 2002;33:341–355. doi: 10.1016/s0896-6273(02)00569-x. [DOI] [PubMed] [Google Scholar]
- Fjell AM, Westlye LT, Amlien I, Espeseth T, Reinvang I, Raz N, Agartz I, Salat DH, Greve DN, Fischl B, Dale AM, Walhovd KB. Minute effects of sex on the aging brain: a multisample magnetic resonance imaging study of healthy aging and Alzheimer's disease. J Neurosci. 2009;29:8774–8783. doi: 10.1523/JNEUROSCI.0115-09.2009. [DOI] [PMC free article] [PubMed] [Google Scholar]
- Ge Y, Jensen JH, Lu H, Helpern JA, Miles L, Inglese M, Babb JS, Herbert J, Grossman RI. Quantitative assessment of iron accumulation in the deep gray matter of multiple sclerosis by magnetic field correlation imaging. AJNR Am J Neuroradiol. 2007;28:1639–1644. doi: 10.3174/ajnr.A0646. [DOI] [PMC free article] [PubMed] [Google Scholar]
- Geurts JJ, Reuling IE, Vrenken H, Uitdehaag BM, Polman CH, Castelijns JA, Barkhof F, Pouwels PJ. MR spectroscopic evidence for thalamic and hippocampal, but not cortical, damage in multiple sclerosis. Magn Reson Med. 2006;55:478–483. doi: 10.1002/mrm.20792. [DOI] [PubMed] [Google Scholar]
- Hasan KM. A framework for quality control and parameter optimization in diffusion tensor imaging: theoretical analysis and validation. Magn Reson Imaging. 2007;25:1196–1202. doi: 10.1016/j.mri.2007.02.011. [DOI] [PMC free article] [PubMed] [Google Scholar]
- Hasan KM, Frye RE. Diffusion tensor-based regional gray matter tissue segmentation using the international consortium for brain mapping atlases. Hum Brain Mapp. 2011;32:107–117. doi: 10.1002/hbm.21004. [DOI] [PMC free article] [PubMed] [Google Scholar]
- Hasan KM, Narayana PA. Computation of the fractional anisotropy and mean diffusivity maps without tensor decoding and diagonalization: theoretical analysis and validation. Magn Reson Med. 2003;50:589–598. doi: 10.1002/mrm.10552. [DOI] [PubMed] [Google Scholar]
- Hasan KM, Sankar A, Halphen C, Kramer LA, Brandt ME, Juranek J, Cirino PT, Fletcher JM, Papanicolaou AC, Ewing-Cobbs L. Development and organization of the human brain tissue compartments across the lifespan using diffusion tensor imaging. Neuroreport. 2007;18:1735–1739. doi: 10.1097/WNR.0b013e3282f0d40c. [DOI] [PubMed] [Google Scholar]
- Hasan KM, Halphen C, Kamali A, Nelson FM, Wolinsky JS, Narayana PA. Caudate nuclei volume, diffusion tensor metrics, and T(2) relaxation in healthy adults and relapsing-remitting multiple sclerosis patients: implications for understanding gray matter degeneration. J Magn Reson Imaging. 2009;29:70–77. doi: 10.1002/jmri.21648. [DOI] [PMC free article] [PubMed] [Google Scholar]
- Hasan KM, Kamali A, Abid H, Kramer LA, Fletcher JM, Ewing-Cobbs L. Quantification of the spatiotemporal microstructural organization of the human brain association, projection and commissural pathways across the lifespan using diffusion tensor tractography. Brain Struct Funct. 2010a;214:361–373. doi: 10.1007/s00429-009-0238-0. [DOI] [PMC free article] [PubMed] [Google Scholar]
- Hasan KM, Walimuni IS, Kramer LA, Frye RE. Human brain atlas-based volumetry and relaxometry: application to healthy development and natural aging. Magn Reson Med. 2010b;64:1382–1389. doi: 10.1002/mrm.22515. [DOI] [PubMed] [Google Scholar]
- Hasan KM, Walimuni IS, Kramer LA, Narayana PA. Human brain iron mapping using atlas-based T(2) relaxometry. Magn Reson Med. 2011a doi: 10.1002/mrm.23054. [DOI] [PMC free article] [PubMed] [Google Scholar]
- Hasan KM, Walimuni IS, Kramer LA, Ewing-Cobbs L. Atlas-based T2 relaxometry of the developing child brain: serial and cross-sectional analysis. Proceedings of the 19th Annual Meeting and Exhibition of International Society for Magnetic Resonance in Medicine; May; Montréal, Québec, Canada. 2011b. #4328. [Google Scholar]
- Hasan KM, Walimuni IS, Humaira A, Datta S, Wolinsky JS, Narayana PA. Human brain atlas-based multimodal MRI analysis of volumetry, diffusimetry, relaxometry and lesion distribution in multiple sclerosis patients and healthy adult controls: implications for understanding the pathogenesis of multiple sclerosis and consolidation of quantitative MRI results in MS. J Neurol Sci. 2011c doi: 10.1016/j.jns.2011.09.015. [DOI] [PMC free article] [PubMed] [Google Scholar]
- Hasan KM, Walimuni IS, Abid H, Datta S, Nelson F, Wolinsky JS, Narayana PA. Brain atlas-based lesion spatial distribution and modeling of Wallerian degeneration in multiple sclerosis. Proceedings of the 19th Annual Meeting and Exhibition of International Society for Magnetic Resonance in Medicine; May; Montréal, Québec, Canada. 2011d. #4086. [Google Scholar]
- Heiss WD, Habedank B, Klein JC, Herholz K, Wienhard K, Lenox M, Nutt R. Metabolic rates in small brain nuclei determined by high-resolution PET. J Nucl Med. 2004;45:1811–1815. [PubMed] [Google Scholar]
- Henry RG, Shieh M, Amirbekian B, Chung S, Okuda DT, Pelletier D. Connecting white matter injury and thalamic atrophy in clinically isolated syndromes. J Neurol Sci. 2009;282:61–66. doi: 10.1016/j.jns.2009.02.379. [DOI] [PubMed] [Google Scholar]
- Houtchens MK, Benedict RH, Killiany R, Sharma J, Jaisani Z, Singh B, Weinstock-Guttman B, Guttmann CR, Bakshi R. Thalamic atrophy and cognition in multiple sclerosis. Neurology. 2007;69:1213–1223. doi: 10.1212/01.wnl.0000276992.17011.b5. [DOI] [PubMed] [Google Scholar]
- Kochunov P, Williamson DE, Lancaster J, Fox P, Cornell J, Blangero J, Glahn DC. Fractional anisotropy of water diffusion in cerebral white matter across the lifespan. Neurobiol Aging. 2010 doi: 10.1016/j.neurobiolaging.2010.01.014. [DOI] [PMC free article] [PubMed] [Google Scholar]
- Lassmann H. Multiple sclerosis: is there neurodegeneration independent from inflammation? J Neurol Sci. 2007;259:3–6. doi: 10.1016/j.jns.2006.08.016. [DOI] [PubMed] [Google Scholar]
- Lebel C, Walker L, Leemans A, Phillips L, Beaulieu C. Microstructural maturation of the human brain from childhood to adulthood. Neuroimage. 2008;40:1044–1055. doi: 10.1016/j.neuroimage.2007.12.053. [DOI] [PubMed] [Google Scholar]
- Leppert IR, Almli CR, McKinstry RC, Mulkern RV, Pierpaoli C, Rivkin MJ, Pike GB. T(2) relaxometry of normal pediatric brain development. National Institutes of Health (NIH) MRI study of normal brain development. J Magn Reson Imaging. 2009;29:258–267. doi: 10.1002/jmri.21646. [DOI] [PMC free article] [PubMed] [Google Scholar]
- Mesaros S, Rocca MA, Absinta M, Ghezzi A, Milani N, Moiola L, Veggiotti P, Comi G, Filippi M. Evidence of thalamic gray matter loss in pediatric multiple sclerosis. Neurology. 2008;70:1107–1112. doi: 10.1212/01.wnl.0000291010.54692.85. [DOI] [PubMed] [Google Scholar]
- Narayanan S, Fu L, Pioro E, De Stefano N, Collins DL, Francis GS, Antel JP, Matthews PM, Arnold DL. Imaging of axonal damage in multiple sclerosis: spatial distribution of magnetic resonance imaging lesions. Ann Neurol. 1997;41:385–391. doi: 10.1002/ana.410410314. [DOI] [PubMed] [Google Scholar]
- Niepel G, Tench ChR, Morgan PS, Evangelou N, Auer DP, Constantinescu CS. Deep gray matter and fatigue in MS: a T1 relaxation time study. J Neurol. 2006;253:896–902. doi: 10.1007/s00415-006-0128-9. [DOI] [PubMed] [Google Scholar]
- Ostby Y, Tamnes CK, Fjell AM, Westlye LT, Due-Tønnessen P, Walhovd KB. Heterogeneity in subcortical brain development: a structural magnetic resonance imaging study of brain maturation from 8 to 30 years. J Neurosci. 2009;29:11772–11782. doi: 10.1523/JNEUROSCI.1242-09.2009. [DOI] [PMC free article] [PubMed] [Google Scholar]
- Pellicano C, Gallo A, Li X, Ikonomidou VN, Evangelou IE, Ohayon JM, Stern SK, Ehrmantraut M, Cantor F, McFarland HF, Bagnato F. Relationship of cortical atrophy to fatigue in patients with multiple sclerosis. Arch Neurol. 2010;67:447–453. doi: 10.1001/archneurol.2010.48. [DOI] [PubMed] [Google Scholar]
- Pieperhoff P, Hömke L, Schneider F, Habel U, Shah NJ, Zilles K, Amunts K. Deformation field morphometry reveals age-related structural differences between the brains of adults up to 51 years. J Neurosci. 2008;28:828–842. doi: 10.1523/JNEUROSCI.3732-07.2008. [DOI] [PMC free article] [PubMed] [Google Scholar]
- Pierpaoli C, Jezzard P, Basser PJ, Barnett A, Di Chiro G. Diffusion tensor MR imaging of the human brain. Radiology. 1996;201:637–648. doi: 10.1148/radiology.201.3.8939209. [DOI] [PubMed] [Google Scholar]
- Ramasamy DP, Benedict RH, Cox JL, Fritz D, Abdelrahman N, Hussein S, Minagar A, Dwyer MG, Zivadinov R. Extent of cerebellum, subcortical and cortical atrophy in patients with MS: a case-control study. J Neurol Sci. 2009;282:47–54. doi: 10.1016/j.jns.2008.12.034. [DOI] [PubMed] [Google Scholar]
- Rocca MA, Mesaros S, Pagani E, Sormani MP, Comi G, Filippi M. Thalamic damage and long-term progression of disability in multiple sclerosis. Radiology. 2010;257:463–469. doi: 10.1148/radiol.10100326. [DOI] [PubMed] [Google Scholar]
- Sailer M, Fischl B, Salat D, Tempelmann C, Schönfeld MA, Busa E, Bodammer N, Heinze HJ, Dale A. Focal thinning of the cerebral cortex in multiple sclerosis. Brain. 2003;126:1734–1744. doi: 10.1093/brain/awg175. [DOI] [PubMed] [Google Scholar]
- Saito N, Sakai O, Ozonoff A, Jara H. Relaxo-volumetric multispectral quantitative magnetic resonance imaging of the brain over the human lifespan: global and regional aging patterns. Magn Reson Imaging. 2009;27:895–906. doi: 10.1016/j.mri.2009.05.006. [DOI] [PubMed] [Google Scholar]
- Sajja BR, Datta S, He R, Mehta M, Gupta RK, Wolinsky JS, Narayana PA. Unified approach for multiple sclerosis lesion segmentation on brain MRI. Ann Biomed Eng. 2006;34:142–151. doi: 10.1007/s10439-005-9009-0. [DOI] [PMC free article] [PubMed] [Google Scholar]
- Sepulcre J, Goñi J, Masdeu JC, Bejarano B, Vélez de Mendizábal N, Toledo JB, Villoslada P. Contribution of white matter lesions to gray matter atrophy in multiple sclerosis: evidence from voxel-based analysis of T1 lesions in the visual pathway. Arch Neurol. 2009;66:173–179. doi: 10.1001/archneurol.2008.562. [DOI] [PubMed] [Google Scholar]
- Smith SM. Fast robust automated brain extraction. Hum Brain Mapp. 2002;17:143–155. doi: 10.1002/hbm.10062. [DOI] [PMC free article] [PubMed] [Google Scholar]
- Sowell ER, Peterson BS, Thompson PM, Welcome SE, Henkenius AL, Toga AW. Mapping cortical change across the human life span. Nat Neurosci. 2003;6:309–315. doi: 10.1038/nn1008. [DOI] [PubMed] [Google Scholar]
- Tao G, Datta S, He R, Nelson F, Wolinsky JS, Narayana PA. Deep gray matter atrophy in multiple sclerosis: a tensor based morphometry. J Neurol Sci. 2009;282:39–46. doi: 10.1016/j.jns.2008.12.035. [DOI] [PMC free article] [PubMed] [Google Scholar]
- Tovar-Moll F, Evangelou IE, Chiu AW, Richert ND, Ostuni JL, Ohayon JM, Auh S, Ehrmantraut M, Talagala SL, McFarland HF, Bagnato F. Thalamic involvement and its impact on clinical disability in patients with multiple sclerosis: a diffusion tensor imaging study at 3T. AJNR Am J Neuroradiol. 2009;30:1380–1386. doi: 10.3174/ajnr.A1564. [DOI] [PMC free article] [PubMed] [Google Scholar]
- Varga AW, Johnson G, Babb JS, Herbert J, Grossman RI, Inglese M. White matter hemodynamic abnormalities precede sub-cortical gray matter changes in multiple sclerosis. J Neurol Sci. 2009;282:28–33. doi: 10.1016/j.jns.2008.12.036. [DOI] [PMC free article] [PubMed] [Google Scholar]
- Vercellino M, Masera S, Lorenzatti M, Condello C, Merola A, Mattioda A, Tribolo A, Capello E, Mancardi GL, Mutani R, Giordana MT, Cavalla P. Demyelination, inflammation, and neurodegeneration in multiple sclerosis deep gray matter. J Neuropathol Exp Neurol. 2009;68:489–502. doi: 10.1097/NEN.0b013e3181a19a5a. [DOI] [PubMed] [Google Scholar]
- Walhovd KB, Westlye LT, Amlien I, Espeseth T, Reinvang I, Raz N, Agartz I, Salat DH, Greve DN, Fischl B, Dale AM, Fjell AM. Consistent neuroanatomical age-related volume differences across multiple samples. Neurobiol Aging. 2011;32:916–932. doi: 10.1016/j.neurobiolaging.2009.05.013. [DOI] [PMC free article] [PubMed] [Google Scholar]
- Walimuni IS, Hasan KM. Atlas-based investigation of human brain tissue microstructural spatial heterogeneity and interplay between transverse relaxation time and radial diffusivity. Neuroimage. 2011;57:1402–1410. doi: 10.1016/j.neuroimage.2011.05.063. [DOI] [PMC free article] [PubMed] [Google Scholar]