Abstract
Metamaterials are artificial media structured on a size scale smaller than the wavelength of external stimuli, that may provide novel tools to significantly enhance the sensitivity and resolution of the sensors. In this paper, we derive the dispersion relation of hollow cylindrical dielectric waveguide, and compute the resonant frequencies and Q factors of the corresponding Whispering-Gallery-Modes (WGM). A metamaterial sensor based on microring resonator operating in WGM is proposed, and the resonance intensity spectrum curves in the frequency range from 185 to 212 THz were studied under different sensing conditions. Full-wave simulations, considering the frequency shift sensitivity influenced by the change of core media permittivity, the thickness and permittivity of the adsorbed substance, prove that the sensitivity of the metamaterial sensor is more than 7 times that of the traditional microring resonator sensor, and the metamaterial layer loaded in the inner side of the microring doesn’t affect the high Q performance of the microring resonator.
Keywords: sensor, metamaterials, microring
1. Introduction
Metamaterials, which are artificial materials whose permittivity and/or permeability can be designed to continuously change from negative to positive values, have attracted considerable attention for their intriguing electromagnetic properties. Many novel applications have been proposed based on metamaterials, such as perfect lenses, cloaks, concentrators, directive antennae, superscatterers, superabsorbers, transparent devices and so on [1–5]. Recently, a great deal of interest has been devoted to the potential sensing applications of metamaterials. For example, He et al. [6], studied the resonant modes of a 2D subwavelength open resonator, and showed it was suitable for biosensing. Jakšić et al. [7] investigated some peculiarities of electromagnetic metamaterials convenient for plasmon-based chemical sensing with enhanced sensitivity, and it was believed that metamaterial sensor may have potential applications in environmental sensing, homeland security and biosensing. Alù et al. [8] proposed a method of dielectric sensing using ɛ near-zero narrow waveguide channels. Shreiber et al. [9] developed a novel microwave nondestructive evaluation sensor using metamaterial lens for detection of material defects small relative to a wavelength. Zheludev [10] analysed the road ahead for metamaterials, and pointed out that sensor applications are another growth area in metamaterials research. Our team [11–13] has studied the performance of metamaterial sensors, and shown that the sensitivity and resolution of the sensors can be greatly enhanced by metamaterials.
WGM is a morphology-dependent resonance, which occurs when an electromagnetic wave travels in a dielectric medium of circular geometry. After repeated total internal reflections at the curved boundary, the electromagnetic field can close on itself and give rise to resonances [14]. The WGM resonance phenomenon has received increasing attention due to its high potential for the realization of microcavity lasers [15,16], quantum computers [17], sensing applications [18–26], etc. Examples of the applications of WGM sensors include biosensing [21], nanoparticle detection [22], single-molecule detection [23], temperature measurement [24], ammonia detection [25], and TNT detection [26]. However, to the best of our knowledge, there is no report about the metamaterial sensor based on microring resonator operating in WGM.
The purpose of this paper is to investigate the performance of the metamaterial microring resonator sensor and to illustrate how it is different from the traditional microring resonator sensor. We derive the dispersion relation of the hollow cylindrical dielectric waveguide, and compute the resonant frequencies and Q factors of the corresponding WGMs. We then make full wave simulation on the performance of the metamaterial sensor. This study shows that the metamaterial sensor possesses much higher sensitivity than traditional microring resonator sensor, and the mechanism behind this phenomenon is the amplification of evanescent wave.
2. Theoretical Analysis
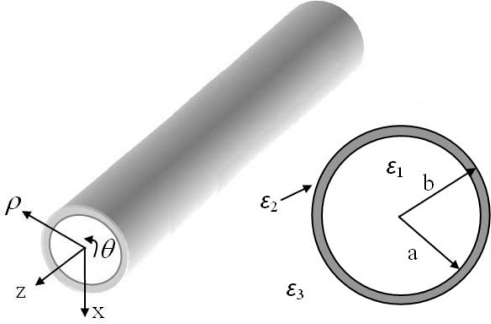
The geometry of a hollow cylindrical dielectric waveguide is shown in Figure 1. A hollow core of relative permittivity ɛ1 = 1 is surrounded by a concentric layer of material having relative permittivity ɛ2. The region exterior to the layer is free-space (ɛ3 = 1). The axial fields in regions 1, 2, and 3 for TM mode [27] are:
| (1a) |
| (1b) |
| (1c) |
where Am, Bm, Cm, and Dm are arbitrary constants.
Figure 1.
(a) Schematic of the cylindrical dielectric waveguide. (b) Cross section of the waveguide with inner radius b and outer radius a. Relative permittivity of each medium are labeled as ɛ1, ɛ2 and ɛ3.
The functions Jm, Ym, and Km are, respectively, the Bessel functions of the first kind, of the second kind, and the modified Bessel function of the second kind. , , and . k1 = n1 ω/c, k2 = n2 ω/c, k3 = n3 ω/c are respectively the wave number of region 1, 2, 3, while n1, n2, n3 are the corresponding reflective index. β is the propagation constant, and m is the angular order. For an infinite hollow cylindrical dielectric waveguide with negligible absorption and no axial component of the propagation constant (β = 0), TM mode degenerates to WGM [28], Equation (1) becomes:
| (2a) |
| (2b) |
| (2c) |
where D′m = (iπ/2)eimπ/2 Dm, is the Hankel function of the first kind. The relation between and Km is Km(−iz) = (iπ/2)eimπ/2 .
Finally, the radial and azimuthal electric fields are derived from the axial electric field using Maxwell’s equations. For TM mode in the cylindrical dielectric waveguide, transverse magnetic fields can be obtained as:
| (3a) |
| (3b) |
For WGM in the cylindrical dielectric waveguide, Equation (3) becomes:
| (4a) |
| (4b) |
The field matching equations at the boundary surface r = a and r = b are expressed as: , , , .Satisfying these conditions gives:
| (5) |
where:
| (6) |
J′m, Y′m, are the derivative of Jm, Ym and . The dispersion equation can be obtained by setting | M = 0|.
| (7) |
In the lossless case, the resonant frequencies at mode number m in the frequency range of 185 to 212 THz are obtained under the condition of a = 2.2 μm, b = 2.5 μm, n1 = n3 = 1, n2 = 3.2, by solving the lowest order radial WGMs of a hollow cylindrical dielectric waveguide. The results are shown in Table 1.
Table 1.
Mode number and resonant frequency.
| m | 25 | 26 | 27 | 28 | 29 |
|---|---|---|---|---|---|
| fr (THz) | 186.274 | 192.332 | 198.388 | 204.441 | 210.493 |
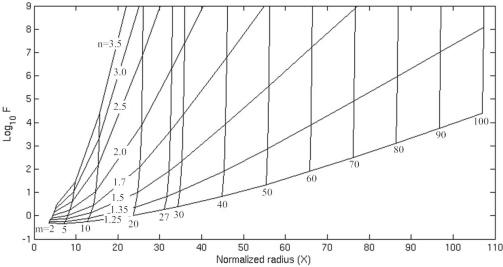
In order to estimate the radiation-loss-limited Q factors of WGMs [28,29], complex frequencies of the resonances ω = ω′ + jω″ were introduced into the dispersion equation. The real part ω′ determines the wavelength of the resonances and the Q factor can be estimated with the expression: Q = ω′ /2ω″. This dimensionless parameter generalizes the imaginary part of the solution space. In order to generalize the real part, a normalized radius is defined as X = n22πb/λ. To solve for the complex roots of the dispersion equation |M|= 0, a global optimization scheme can be used to minimize the absolute value of the equation over two variables: Q and X. Figure 2 displays the radiation-loss-limited finesse (F = Q/m) vs. normalized radius for a variety of azimuthal mode numbers and index ratios. The family of diagonal lines represents varying refractive index contrast (n = n2 /n1). The family of nearly vertical lines corresponds to WGM resonances, each characterized by an azimuthal mode number m. From Figure 2, we can observe that the radiation-loss-limited finesse increases with normalized radius and mode number. Besides, for a give normalized radius and mode number, the radiation-loss-limited finesse increases with the refractive index contrast. These results are beneficial for designing a microring resonator. In the following section, we will simulate the microring resonator and compare its resonant frequencies with the analytical results. Then, the metamaterial sensor constituted by the microring resonator with a layer of metamaterial loaded into its inner side and coupled to a straight waveguide is studied.
Figure 2.
Radiation-loss-limited finesse (F) of the lowest order radial WGMs of a hollow cylindrical dielectric waveguide of index n2 in a medium of index n1 = n3 = 1 plotted against normalized radius (X).
3. Full-Wave Simulations of the Metamaterial Sensor
3.1. Simulation Model
Simulation models of the microring sensor are illustrated in Figure 3. Figure 3(a) shows the conventional microring sensor with a dielectric core. It is denoted as Model A in the following simulation. The width of the ring and the waveguide is w = 0.3 μm. The inner and outer radius of the ring is a = 2.2 μm and b = 2.5 μm. The distance from outer ring to the waveguide is g = 0.232 μm. The refractive index of the ring and the waveguide is n = 3.2. Figure 3(b) shows another simulation scenario, of which the dielectric sample is attached to the inner side of the microring. It is denoted as Model B. Figure 3(c) is the simulation model of the proposed metamaterial sensor that is constituted by the microring with a metamaterial layer attached to the inner side. The dielectric core is colored in grey. It is denoted as Model C. In Figure 3(d), the dielectric sample is attached to the inside of the ring adhere to the metamaterial layer. It is denoted as Model D. The permittivity and permeability of the metamaterial layer is ɛr = μr = −1. In what follows, we will simulate the performance of the traditional microring sensor and the metamaterial sensor with the help of the commercial software COMSOL multiphysics.
Figure 3.
Simulation model of the microring sensor. (a) Conventional microring sensor with a dielectric core (colored in grey). (b) The dielectric sample is attached to the inner side of the microring. (c) A layer of metamaterial (colored in red) is added to the inner side of the microring with a dielectric core. (d) The dielectric sample is attached to the inner side of the microring adhere to the metamaterial layer.
3.2. Results and Discussions
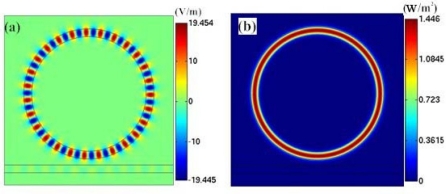
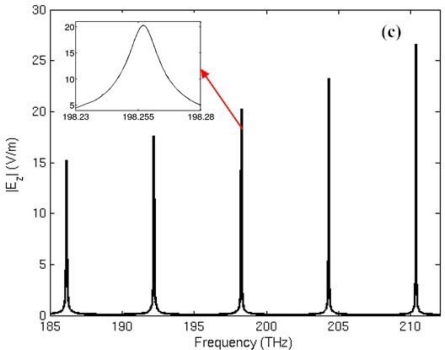
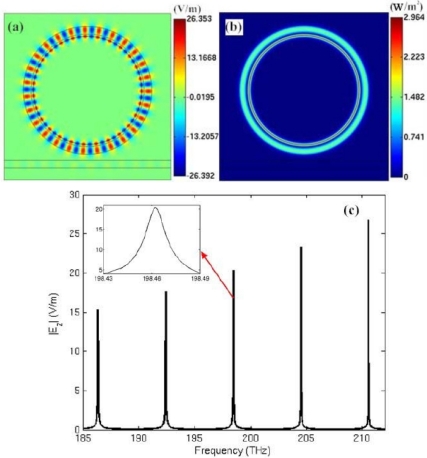
Firstly, the electric field distribution inside the traditional microring sensor (Model A) at the frequency of 198.257 THz is simulated, as shown in Figure 4(a). The field pattern is m = 27 first-order radial waveguide mode, which is formed by the circulation of electromagnetic wave within the microring. Figure 4(b) shows the power flow distribution. It is seen that at the resonant frequency, power flow is confined into the microring. In Figure 4(c), we graphed the spectrum of the microring resonator in the frequency range of 185–212 THz. It is simulated by frequency sweep. The excitation is set at port A of the waveguide.
Figure 4.
(a) Visualization of the steady-state electric field pattern in the air-core microring resonator at the frequency of fr = 198.257 THz (m = 27). (b) Power flow distribution. (c) Resonant frequency spectrum of the microring.
From left to right, the spectral lines represent mode 25, 26, 27, 28 and 29 of the microring resonator. The inset portrays the amplification in the frequency range of 198.23–198.28 THz. The resonant frequency of the microring is calculated and compared with the theoretical results, as shown in Table 2. The good agreement between the simulation results (fs) and the theoretical results (ft) confirms the effectiveness of the numerical simulation.
Table 2.
Comparison of the theoretical resonant frequency (ft) and the simulated resonant frequency (fs) of the microring for mode 25, 26, 27, 28 and 29.
| Mode(m) | 25 | 26 | 27 | 28 | 29 |
|---|---|---|---|---|---|
| ft(THz) | 186.274 | 192.332 | 198.388 | 204.441 | 210.493 |
| fs(THz) | 186.156 | 192.208 | 198.257 | 204.305 | 210.351 |
Next, a layer of metamaterials with thickness of 0.09 μm is loaded into the inner side of an air-core microring to build the simulation model of the metamaterial sensor (Model C). Simulation results of the electric field pattern, power flow and resonant frequency spectrum of the metamaterial sensor are illustrated in panels (a), (b) and (c) of Figure 5. In this case, the maximum electric field is located in the metamaterial layer where the power flow intensity is then rather strong. A comparison between metamaterial sensor and the microring sensor is shown in Table 3. It is seen that a thin layer of metamaterials loaded into the inner side of the microring doesn’t affect the high-Q performance of the microring resonator, and has little influence on the resonant frequency. Since the maximum electric field is permeated into the metamaterial layer, this region will be very sensitive in a dielectric environment. In what follows, we investigate the performance of the metamaterial sensor in a dielectric sensor and compare it with that of the microring sensor.
Figure 5.
(a) Visualization of the steady-state electric field pattern in the metamaterial sensor at the frequency of fr = 198.46THz (m = 27). (b) The power flow distribution. (c) The resonant frequency spectrum.
Table 3.
Simulated Q factor and resonance frequency for Model A and C.
| Mode | 25 | 26 | 27 | 28 | 29 | |
|---|---|---|---|---|---|---|
| Model A | Q | 9279 | 12539 | 16970 | 22600 | 30145 |
| fr(THz) | 186.156 | 192.208 | 198.257 | 204.305 | 210.351 | |
| Model C | Q | 9338 | 12594 | 16952 | 22740 | 30341 |
| fr(THz) | 186.360 | 192.412 | 198.462 | 204.511 | 210.559 | |
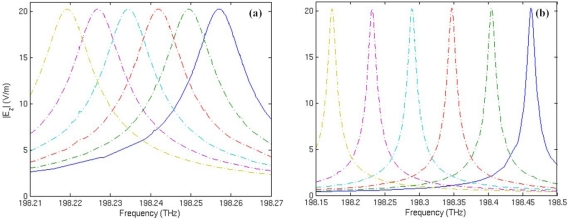
Figure 6 shows the spectrum shift of mode 27 with respect to the change of core medium permittivity ɛs. In the simulation, ɛs is supposed to vary from 1 to 1.1 with an interval of 0.02. It is found that with the increase of the core medium permittivity, the resonant frequency always shifts to the decrescent direction. Comparing Figure 6(a) with Figure 6(b), we can clearly observe that the response to an increase of 0.02 in core medium permittivity is a frequency downshift of 7.58 GHz on average for the traditional microring sensor; for the metamaterial sensor, the average frequency shift is 57.82 GHz. Therefore, sensitivity of the metamaterial sensor is 7.6 times that of the traditional microring sensor for volume sensing.
Figure 6.
Resonant frequency spectrum of mode 27 with respect to the change of core medium permittivity ɛs. From left to right, the curves correspond to ɛs = 1, 1.02, 1.04, 1.06, 1.08 and 1.1, respectively. (a) The traditional microring sensor. (b) The metamaterial sensor.
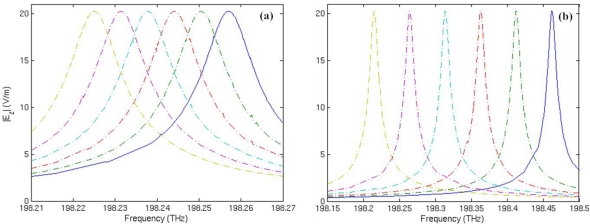
Suppose that a layer of substance with thickness of t = 0.075 μm is adsorbed to the inner side of the microring (Figure 3, Model B), or adhered to the metamaterial layer (Figure 3, Model D), the spectrum shift of mode 27 with respect to the change of substance permittivity ɛs is simulated and shown in Figure 7. Results show that the response to an increase of 0.02 in adsorbed substance permittivity is a frequency downshift of 6.35 GHz in average for the traditional microring sensor; for the metamaterial sensor, the average frequency shift is 49.34 GHz, which is about 7.8 times that of the traditional microring sensor for surface sensing.
Figure 7.
Resonant frequency spectrum of mode 27 with respect to the change of adsorbed substance permittivity ɛs. From left to right, the curves correspond to ɛs = 1, 1.02, 1.04, 1.06, 1.08 and 1.1, respectively. (a) The traditional microring sensor. (b) The metamaterial sensor.
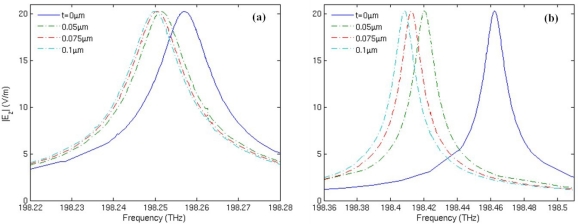
Figure 8 shows the spectrum shift of mode 27 with respect to the increase of substance layer thickness t, which represents the adsorption or attachment of molecules. Permittivity of the substance layer is set to be 1.02 in the simulation. From Figure 8(a), we can see that when t increases from 0 to 0.05 μm, the frequency shift of the traditional microring sensor is 5.53 GHz; the increase of t from 0.05 μm to 0.1 μm with an interval of 0.025 μm results in a frequency downshift of 0.81 GHz in average. For the metamaterial sensor, a frequency shift of 42.18 GHz is induced by the increase of t from 0 to 0.05 μm, as shown in Figure 8(b). Besides, the increase of t from 0.05 μm to 0.1 μm with an interval of 0.025 μm results in a frequency downshift of 5.96 GHz in average, with is about 7.3 times that of the traditional microring sensor. Therefore, the metamaterial sensor possesses much higher sensitivity than the traditional microring sensor.
Figure 8.
Resonant frequency spectrum of mode 27 with respect to the increase of substance layer thickness t. (a) The traditional microring sensor. (b) The metamaterial sensor.
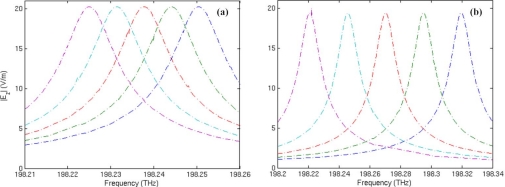
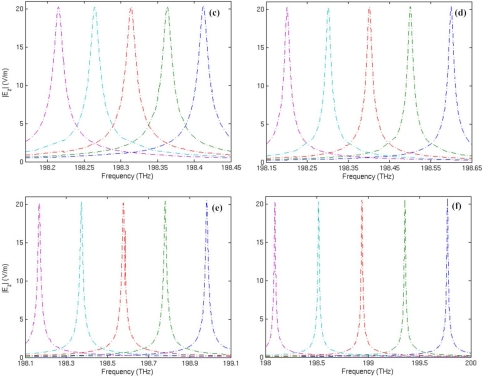
To understand the impact of the metamaterials on the sensitivity of the microring sensor, we assume that the thickness (tm) of the metamaterial layer increases from 0.06 μm to 0.18 μm with an interval of 0.03 μm, and the corresponding resonant frequency spectra of mode 27 with respect to the change of adsorbed substance permittivity ɛs are then simulated as shown in Figure 9. Thickness of the substance layer is t = 0.075 μm. The resonant frequencies fr, Q factors, and frequency shift Δfr calculated from the data in Figure 9 are listed in Table 4. It is seen that the increase of metamaterial layer thickness will induce a larger frequency shift in dielectric sensing, but it doesn’t affect the high Q performance of the resonator.
Figure 9.
Resonant frequency spectrum of mode 27 with respect to the change of adsorbed substance permittivity ɛs. From left to right, the curves correspond to ɛs = 1.02, 1.04, 1.06, 1.08 and 1.1, respectively. (a) The traditional microring sensor. (b–f) show the simulation results of the metamaterial sensor with a metamaterial layer in the thickness of 0.06 μm, 0.09 μm, 0.12 μm, 0.15 μm, and 0.18 μm respectively, attached to the inner side.
Table 4.
Q factor, resonant frequency and frequency shift calculated from Figure 9.
| ɛs | 1.02 | 1.04 | 1.06 | 1.08 | 1.1 | |
|---|---|---|---|---|---|---|
| tm(μm) | ||||||
| 0 | Q | 16896 | 16914 | 16870 | 16868 | 16955 |
| fr(THz) | 198.250 | 198.244 | 198.238 | 198.231 | 198.225 | |
| Δfr(GHz) | 6.0 | 6.0 | 7.0 | 6.0 | ||
| 0.06 | Q | 15502 | 15503 | 15502 | 15501 | 16513 |
| fr(THz) | 198.320 | 198.295 | 198.270 | 198.246 | 198.222 | |
| Δfr(GHz) | 25.0 | 25.0 | 24.0 | 24.0 | ||
| 0.09 | Q | 16758 | 16885 | 16901 | 16890 | 16841 |
| fr(THz) | 198.413 | 198.363 | 198.314 | 198.265 | 198.215 | |
| Δfr(GHz) | 50.0 | 49.0 | 49.0 | 50.0 | ||
| 0.12 | Q | 17006 | 17049 | 16932 | 16915 | 16867 |
| fr(THz) | 198.600 | 198.501 | 198.401 | 198.301 | 198.201 | |
| Δfr(GHz) | 99.0 | 100.0 | 100.0 | 100.0 | ||
| 0.15 | Q | 17151 | 17067 | 17022 | 16914 | 16830 |
| fr(THz) | 198.983 | 198.781 | 198.577 | 198.373 | 198.168 | |
| Δfr(GHz) | 202.0 | 204.0 | 204.0 | 205.0 | ||
| 0.18 | Q | 17470 | 17393 | 17129 | 16948 | 16746 |
| fr(THz) | 199.772 | 199.357 | 198.939 | 198.517 | 198.092 | |
| Δfr(GHz) | 415.0 | 418.0 | 422.0 | 425.0 | ||
For the traditional microring sensor (tm = 0), the response to an increase of 0.02 in adsorbed substance permittivity is a frequency downshift of 6.3 GHz on average. For the metamaterial sensor with a layer of metamaterials in the thickness of 0.06 μm, the frequency downshift is 24.5 GHz on average. When the thickness of the metamaterial layer is increased to 0.09 μm, 0.12 μm, 0.15 μm and 0.18 μm, the corresponding frequency down shift will be 49.5 GHz, 99.8 GHz, 203.7 GHz and 420 GHz on average, respectively. Therefore, sensitivity of the metamaterial sensor can be greatly improved by increasing the thickness of the metamaterial layer attached to its inner side.
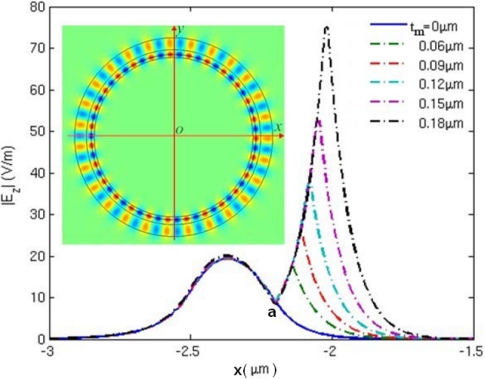
To reveal the mechanism behind these phenomena, we plotted the electric field distribution along the x axis from −3 μm to −1.5 μm for mode 27, as shown in Figure 10. Point “a” in Figure 10 is the inner boundary of the microring resonator. When the metamaterial layer is loaded onto the inner side, inner boundary of the metamaterial sensor shifts to the right side and shown at the peak of the dashed lines in Figure 10. Permittivity and thickness of the adsorbed substance is set to be ɛs = 1.02, t = 0.075 μm. It is seen that the electric field intensity increases with metamaterial layer thickness (tm). The inset shows the electric field distribution of the metamaterial sensor of tm = 0.12 μm. From Figure 10, we can clearly observe that the stronger electric field of evanescent wave penetrates into the detecting region when the thickness of metamaterial layer increases. Therefore, the amplification of evanescent wave is the essence for the improvement of sensitivity.
Figure 10.
Electric field distribution along x axis from −3 μm to −1.5 μm for the metamaterial sensor operating in mode 27. The inset shows the electric field distribution of the sensor of tm = 0.12 μm.
4. Conclusions
We have theoretically analyzed here the WGMs of a hollow cylindrical dielectric waveguide by solving the Maxwell equations with the corresponding boundary conditions. The resonant frequencies in the frequency range of 185 to 212 THz are obtained analytically, and the results reveal good agreement with full wave simulation. The metamaterial sensor constituted by a microring resonator loaded with a layer of double negative metamaterial is proposed, and considering the excitation of WGMs, its performance is simulated numerically and compared with the traditional microring sensor. We show that the metamaterial sensor possesses a higher sensitivity than the traditional microring sensor, due to the amplification of evanescent waves. Moreover, the sensitivity will be further improved by increasing the thickness of the metamaterial layer. It is expected that with the development of metamaterial technology, metamaterial sensors based on the microring resonator can be realized, and will contribute to more applications in dielectric sensing in fields where high sensitivity is required.
Acknowledgments
The authors thank the training Program of Yunnan Province for Middle-aged and Young Leaders of Disciplines in Science and Technology (Grant No. 2008PY031), the Research Foundation from Ministry of Education of China (Grant No. 208133), the National Natural Science Foundation of China (Grant No. 60861002), and NSFC-YN (Grant No.U1037603) for financial support.
References
- 1.Pendry JB. Negative refraction makes a perfect lens. Phys. Rev. Lett. 2000;85:3966–3969. doi: 10.1103/PhysRevLett.85.3966. [DOI] [PubMed] [Google Scholar]
- 2.Pendry JB, Schurig D, Smith DR. Controlling electromagnetic fields. Science. 2006;312:1780–1782. doi: 10.1126/science.1125907. [DOI] [PubMed] [Google Scholar]
- 3.Alitalo P, Tretyakov S. Electromagnetic cloaking with metamaterials. Materialstoday. 2009;12:22–29. [Google Scholar]
- 4.Jiang WX, Chin JY, Cui TJ. Anisotropic metamaterial devices. Materialstoday. 2009;12:26–33. [Google Scholar]
- 5.Dubinov AE, Mytareva LA. Invisible cloaking of material bodies using the wave flow method. Phys.-Usp. 2010;53:455–479. [Google Scholar]
- 6.He S, Jin Y, Ruan ZC, Kuang JG. On subwavelength and open resonators involving metamaterials of negative refraction index. New J. Phys. 2005;7:210. [Google Scholar]
- 7.Jakšić Z, Jakšić O, Djuric Z, Kment C. A consideration of the use of metamaterials for sensing applications:field fluctuations and ultimate performance. J. Opt. A: Pure Appl. 2007;9:S377–S384. [Google Scholar]
- 8.Alù A, Engheta N. Dielectric sensing in ɛ-near-zero narrow waveguide channels. Phys. Rev. B. 2008;78:045102. [Google Scholar]
- 9.Shreiber D, Gupta M, Cravey R. Comparative study of 1-D and 2-D metamaterial lens for microwave nondestructive evaluation of dielectric materials. Sens Actuat A: Phys. 2010 doi: 10.1016/j.sna.2010.12.004. [DOI] [Google Scholar]
- 10.Zheludev NI. The road ahead for metamaterials. Science. 2010;328:582–583. doi: 10.1126/science.1186756. [DOI] [PubMed] [Google Scholar]
- 11.Huang M, Yang JJ, Sun J, Shi JH, Peng JH. Modelling and analysis of Ω-shaped double negative material-assisted microwave sensor. J. Infrared Milli. Terahz. Waves. 2009;30:1131–1138. [Google Scholar]
- 12.Yang JJ, Huang M, Xiao Z, Peng J. H. Simulation and analysis of asymmetric metamaterial resonator-assisted microwave sensor. Mod. Phys. Lett. B. 2010;24:1207–1215. [Google Scholar]
- 13.Huang M, Yang JJ. In: Microwave Sensor Using Metamaterials. Petrin A, editor. Intech Press; Vienna, Austria: 2011. pp. 13–36. [Google Scholar]
- 14.Quan H, Guo Z. Simulation of whispering-gallery-mode resonance shifts for optical miniature biosensors. J. Quant. Spectrosc. Radiat. 2005;93:231–243. [Google Scholar]
- 15.Sandoghdar V, Treussart F, Hare J, Lefèvre-Seguin V, Raimond JM, Haroche S. Very low threshold whispering-gallery-mode microsphere laser. Phys. Rev. A. 1996;54:R1777–R1780. doi: 10.1103/physreva.54.r1777. [DOI] [PubMed] [Google Scholar]
- 16.Yang L, Armani DK, Vahala KJ. Fiber-coupled erbium microlasers on a chip. Appl. Phys. Lett. 2003;83:825–826. [Google Scholar]
- 17.Ladd TD, Jelezko F, Laflamme R, Nakamura Y, Monroe C, O’Brien JL. Quantum computers. Nature. 2010;464:45–53. doi: 10.1038/nature08812. [DOI] [PubMed] [Google Scholar]
- 18.Vahala KJ. Optical microcavities. Nature. 2003;424:839–846. doi: 10.1038/nature01939. [DOI] [PubMed] [Google Scholar]
- 19.Armani DK, Kippenberg TJ, Spillane SM, Vahala KJ. Ultra-high-Q toroid microcavity on a chip. Nature. 2003;421:925–928. doi: 10.1038/nature01371. [DOI] [PubMed] [Google Scholar]
- 20.Hunt HK, Soteropulos C, Armani AM. Bioconjugation strategies for microtoroidal optical resonators. Sensors. 2010;10:9317–9336. doi: 10.3390/s101009317. [DOI] [PMC free article] [PubMed] [Google Scholar]
- 21.Vollmer F, Arnold S. Wispering-gallery-mode biosensing: Labelfree detection down to single molecules. Nat. Methods. 2008;5:591–596. doi: 10.1038/nmeth.1221. [DOI] [PubMed] [Google Scholar]
- 22.Zhu J, Ozdemir SK, Xiao XF, Li L, He L, Chen DR, Yang L. On-chip single nanoparticle detection and sizing by mode splitting in an ultrahigh-Q microresonator. Nat. Photonic. 2010;4:46–49. [Google Scholar]
- 23.Armani AM, Kulkarni RP, Fraser SE, Flagan RC, Vahala KJ. Label-free, single-molecule detection with optical microcavities. Science. 2007;317:783–787. doi: 10.1126/science.1145002. [DOI] [PubMed] [Google Scholar]
- 24.Ma Q, Rossmann T, Guo Z. Whispering-gallery mode silica microsensors for cryogenic to room temperature measurement. Meas. Sci. Technol. 2010;21:025310. [Google Scholar]
- 25.Passaro VMN, Dell’Olio F, De Leonardis F. Ammonia optical sensing by microring resonators. Sensors. 2007;7:2741–2749. doi: 10.3390/s7112741. [DOI] [PMC free article] [PubMed] [Google Scholar]
- 26.Orghici R, Lützow P, Burgmeier J, Koch J, Heidrich H, Schade W, Welschoff N, Waldvogel S. A microring resonator sensor for sensitive detection of 1,3,5-Trinitrotoluene (TNT) Sensors. 2010;10:6788–6795. doi: 10.3390/s100706788. [DOI] [PMC free article] [PubMed] [Google Scholar]
- 27.Yeh C, Shimabukuro F. The Essence of Dielectric Waveguides. Springer; New York, NY, USA: 2008. pp. 165–167. [Google Scholar]
- 28.Heebner J, Grover R, Ibrahim T. Optical Microresonators: Theory, Fabrication, and Applications. Springer; New York, NY, USA: 2008. pp. 39–41. [Google Scholar]
- 29.Zamora V, Díez A, Andrés MV, Gimeno B. Cylindrical optical microcavities: Basic properties and sensor applications. Photon Nanostruct. 2010 doi: 10.1016/j.photonics.2010.09.007.. [DOI] [Google Scholar]


