

Abstract
Case-control studies suggest that African Americans with genetic variants in both copies of APOL1 have increased risk for hypertension-attributable ESRD and focal segmental glomerulosclerosis. Here, we tested these risk variants in the Dallas Heart Study to ascertain the prevalence of APOL1-associated renal disease in a large population-based study and to estimate the contribution of APOL1 risk variants to disparities in renal disease. We determined the genotype of 1825 African Americans and 1042 European Americans. Among participants without diabetes, we identified microalbuminuria in 2.3% of European Americans, 6.0% of African Americans with no or one APOL1 risk allele, and 16.5% of African Americans with two risk alleles. In addition, the proportions of participants with estimated GFR < 60 ml/min per 1.73 m2 was 1.5% for nondiabetic European Americans, 1.7% for African Americans with no or one APOL1 risk allele, and 6.7% for African Americans with two risk alleles. The APOL1 genotype did not associate with any differences in rates of CKD for study participants with diabetes. Our data suggest that more than 3 million African Americans likely have the high-risk genotype and are at markedly increased risk for nondiabetic CKD. In contrast, African Americans without the risk genotype and European Americans appear to have similar risk for developing nondiabetic CKD.
African Americans develop ESRD at rates 4 to 5 times higher than European Americans.1 Recently, sequence variants in the APOL1 gene on chromosome 22 were associated with large increases in renal disease risk in African Americans.2,3 These APOL1 disease-associated variants increase the risk of hypertension-attributed ESRD and focal and segmental glomerulosclerosis (FSGS) by 7- to 10-fold.2 Importantly, these APOL1 variants are coding mutations that change the amino-acid sequence of the ApolipoproteinL1 (ApoL1) protein product and alter the function of ApoL1. One risk allele (G1, consisting of derived variants rs73885319 and rs60910145) encodes two nonsynonymous amino-acid substitutions that are in near-perfect linkage disequilibrium. The second risk allele (G2, rs71785313) encodes a two amino-acid deletion in the same C-terminal domain of the ApoL1 protein as G1. The large increase in renal disease risk is associated with inheritance of risk variants on both chromosomes, although there may be a small increase in risk for individuals with a single risk allele.
The protein product of APOL1, ApoL1, is a secreted lipoprotein with homology to B-cell lymphoma 2 family members.4,5 ApoL1 circulates on HDL3 complexes, the densest HDL fraction, and is expressed in multiple tissue types.4,6–9 It has putative roles in autophagy and apoptosis and plays an important role in the innate immune system as the human trypanolytic factor that protects humans and some other primates from parasites of the trypanosomida family.5,10 Renal risk variants, but not the ApoL1 protein encoded by the low-risk alleles, can kill a subspecies of trypanosome that causes African sleeping sickness, which may explain their high frequency in Africans and African Americans.2
Haplotypes on chromosome 22 containing APOL1 renal risk polymorphisms are likely to account for a significant fraction of the difference in risk for nondiabetic renal disease between African Americans and European Americans.2,3,11,12 These APOL1 variants have not been directly tested for diabetic nephropathy, but closely linked polymorphisms show little13 or no effect11,14 on diabetic renal disease despite their powerful effect on other renal disease phenotypes.
Initial studies identifying APOL1 risk alleles used case-control designs to test genotype-disease associations. Although case-control studies offer a powerful method of establishing links between risk factors and disease, they are susceptible to various biases, such as survival bias and selection bias. Survival bias is especially problematic when studying high-mortality groups such as ESRD patients, in which increased propensity to develop ESRD may be indistinguishable from increased survival on dialysis. Establishing an association with earlier manifestations of the disease, such as chronic kidney disease (CKD) defined by reduced GFR, would confirm that the association is not attributable to an ESRD survival bias. Selection bias occurs when the control group is not representative of the population from which the cases were chosen. Population-based studies avoid this source of bias because both cases and controls are selected from the same population. Unlike case-control studies, population-based studies can provide estimates of disease incidence and genotype-relative risks. Furthermore, testing for disease associations in a multiethnic population-based cohort allows for estimates of the proportion of excess risk in African Americans due to APOL1 variants.
The Dallas Heart Study (DHS) is a multiethnic, population-based study started in 2000. The study enrolled >3500 subjects aged 18 to 65, and more than half of these study participants were African American. Participants have subsequently been followed for a wide array of health outcomes and exposures. We studied two of the APOL1 renal risk variants (rs73885319, which defines the G1 haplotype, and rs71785313 [G2]) in this population at study inception to determine their effect on renal disease in diabetic and nondiabetic subjects.
RESULTS
The clinical characteristics of DHS participants are shown in Table 1. The mean (±SD) age of the study population was 44.8 (±10) years. Compared with individuals of European ancestry, African Americans had a higher prevalence of traditional renal disease risk factors such as diabetes (14.6% versus 7.1%), hypertension (41.5% versus 20.1%), and obesity (52.2% versus 36.6%). Whereas African Americans had much higher rates of microalbuminuria (10.5% versus 3.5%; P = 7.7 × 10⁻⁶), they had similar rates of GFR <60 ml/min per 1.73 m2 as European Americans (2.8% versus 2%; P = 0.82 to 0.85) (Table 1). The ethnic differences in the incidence of microalbuminuria were highly significant in nondiabetic subjects (7.5% versus 2.4%; P = 1.7 × 10⁻⁵), but not in participants with diabetes (27.8% versus 17.6%; P = 0.15).
Table 1.
Characteristics of the DHS participants (n = 2867)
| African American (n = 1825) | European American (n = 1042) | P | |
|---|---|---|---|
| Male (%) | 42.2 | 47.9 | 0.003 |
| Age (years) | 44.8 (10.3) | 44.8 (9.9) | 0.87 |
| BMI (kg/m2)a | 31.8 (8.2) | 29.0 (6.6) | 1 × 10⁻¹⁶ |
| Obese (%) | 52.2 | 36.6 | 5.2 × 10⁻¹³ |
| Systolic BP (mmHg)a | 130.1 (20.0) | 120.0 (15.3) | 9.3 × 10−56 |
| Diastolic BP (mmHg)a | 81.0 (10.6) | 75.9 (8.8) | 1.9 × 10−41 |
| Hypertension (%) | 41.5 | 20.1 | 2.1 × 10⁻³⁵ |
| Diabetes (%) | 14.6 | 7.1 | 9.9 × 10⁻¹⁰ |
| ACR (mg/g)b | 3.1 (1.9 to 6.7) | 2.6 (1.7 to 4.1) | 3.2 × 10⁻¹⁰ |
| CKD (%) | |||
| total | 11.9 | 5.1 | 3.4 × 10⁻⁴ |
| nondiabetic | 8.6 | 3.9 | 8.2 × 10⁻⁴ |
| diabetic | 30.9 | 20.3 | 0.17 |
| Microalbuminuria (%) | |||
| total | 10.5 | 3.5 | 7.7 × 10⁻⁶ |
| nondiabetic | 7.5 | 2.4 | 1.7 × 10⁻⁵ |
| diabetic | 27.8 | 17.6 | 0.15 |
| GFR4 < 60 ml/min per 1.73 m2 (%) | |||
| total | 2.8 | 2.0 | 0.82 |
| nondiabetic | 2.2 | 1.5 | 0.78 |
| diabetic | 6.4 | 8.1 | 0.27 |
| GFR6 < 60 ml/min per 1.73 m2 (%) | |||
| total | 3.1 | 1.9 | 0.85 |
| nondiabetic | 2.4 | 1.4 | 0.52 |
| diabetic | 7.1 | 8.1 | 0.36 |
| GFR6 < 30 ml/min per 1.73 m2, n (%) | |||
| total | 0.82 | 0 | 0.002 |
Microalbuminuria defined as ACR ≥ 17 mg/g in men or ≥25 mg/g in women. CKD defined as the presence of microalbuminuria and/or GFR < 60 ml/min per 1.73 m2.
Continuous characteristics are shown as amean (SD) or bmedian (25th to 75th percentile).
We genotyped APOL1 renal risk variants in 1042 nonblack and 1825 African-American subjects in the DHS with successful genotype calls of >98%. In African-American subjects, 22.5% of all chromosomes carry the G1 (rs73885319) risk allele, and 14.6% carry the G2 (rs71785313) risk allele. Because G1 and G2 are too close together to allow for recombination, they are mutually exclusive (i.e., every chromosome is either wild-type, G1, or G2, but never carries both G1 and G2).2 Therefore, 37% of all chromosomes in African-American participants carry an APOL1 renal risk allele. Table 2 shows the genotypes of African-American subjects, with 13% carrying two risk alleles. These risk alleles were absent in study participants of European ancestry. The G1 and G2 risk alleles were identified in a few self-identified Hispanic DHS participants (1.25% and 1.9%, respectively); these Hispanic risk allele carriers had substantial African ancestry on the basis of inferred ancestry score.
Table 2.
Characteristics of African-American participants of DHS by the number of APOL1 risk alleles (n = 1776)
| No or One Allele | Two Alleles | P | P after Adjustment for Ancestryd | |
|---|---|---|---|---|
| n | 1540 | 236 | (n = 1776) | (n = 1681) |
| Male (%) | 41.6 | 44.9 | 0.36 | – |
| Age (years)a | 44.7 (10.4) | 45.4 (9.4) | 0.38 | – |
| BMI (kg/m2)a | 31.9 (8.3) | 31.5 (7.6) | 0.88 | 0.71 |
| Systolic BP (mmHg)a | 129.7 (20.0) | 132.5 (20.3) | 0.034 | 0.07 |
| Diastolic BP (mmHg)a | 80.8 (10.6) | 82.0 (10.6) | 0.078 | 0.21 |
| Hypertension (%) | 40.2 | 49.4 | 0.003 | 0.004 |
| Heart ratea | 76.7 (11.8) | 74.7 (10.3) | 0.042 | 0.014 |
| Glucose (mg/dl)c | 91.1 (11.5) | 90.1 (12.1) | 0.090 | 0.11 |
| HOMA-IR (U)b | 3.0 (1.7 to 4.9) | 2.8 (1.7 to 4.1) | 0.17 | 0.20 |
| Diabetes (%) | 14.9 | 11.9 | 0.21 | 0.086 |
| Uric acid (mg/dl)a | 5.5 (1.5) | 5.7 (1.7) | 0.33 | 0.32 |
| Total cholesterol (mg/dl)a | 179 (41) | 173 (38) | 0.011 | 0.03 |
| LDL (mg/dl)a | 105 (37) | 101 (35) | 0.049 | 0.13 |
| HDL (mg/dl)a | 52 (15) | 53 (15) | 0.84 | 0.96 |
| Triglyceride (mg/dl)b | 86 (62 to 123) | 78 (61 to 124) | 0.18 | 0.27 |
| C-reactive protein (mg/L)b | 3.6 (1.4 to 8.4) | 3.4 (1.5 to 7.6) | 0.49 | 0.66 |
| ACR (mg/g)b | ||||
| total | 3.0 (1.8 to 6.0) | 4.1 (2.1 to 11.2) | 4.8 × 10⁻⁵ | – |
| nondiabetic (n = 1559) | 2.8 (1.7 to 5.2) | 4.0 (2.1 to 10.8) | 1.8 × 10⁻⁵ | – |
| diabetic (n = 266) | 6.1 (2.4 to 27.8) | 7.3 (2.7 to 18.6) | 0.78 | – |
| GFR4 (ml/min per 1.73 m2)b | 101 (88 to 116) | 100 (86 to 115) | 0.29 | – |
| GFR6 (ml/min per 1.73 m2)b | 102 (88 to 117) | 102 (86 to 115) | 0.19 | – |
| CKD (%) | ||||
| total | 10.4 | 19.9 | 5.4 × 10⁻⁵ | 3.8 × 10⁻⁴ |
| nondiabetic (n = 1559) | 6.7 | 19.2 | 4.0 × 10⁻⁷ | 3.3 × 10⁻⁶ |
| diabetic (n = 266) | 31.0 | 25.0 | 0.48 | 0.24 |
| Microalbuminuria (%) | ||||
| total | 9.2 | 17.5 | 0.00025 | 0.0017 |
| nondiabetic (n = 1559) | 6.0 | 16.5 | 7.4 × 10⁻⁶ | 6.0 × 10⁻⁵ |
| diabetic (n = 266) | 27.4 | 25.0 | 0.73 | 0.42 |
| GFR4 < 60 ml/min per 1.73 m2 (%) | ||||
| total | 2.5 | 5.5 | 0.0097 | 0.008 |
| nondiabetic (n = 1559) | 1.7 | 5.8 | 0.001 | 0.001 |
| diabetic (n = 266) | 7.0 | 3.6 | 0.47 | 0.48 |
| GFR6 < 60 ml/min per 1.73 m2 (%) | ||||
| total | 2.6 | 6.4 | 0.002 | 0.002 |
| nondiabetic (n = 1559) | 1.7 | 6.7 | 0.0001 | 0.0001 |
| diabetic (n = 266) | 7.9 | 3.6 | 0.39 | 0.41 |
Microalbuminuria defined as ACR ≥ 17 mg/g in men or ≥25 mg/g in women. CKD defined as the presence of microalbuminuria and/or GFR6 < 60 ml/min per 1.73 m2.
Continuous characteristics are shown as amean (SD) or bmedian (25th to 75th percentile).
cDiabetic individuals excluded from this analysis. P-values were calculated as described under Concise Methods.
dAnalysis limited to those individuals in whom African ancestry had been estimated (n = 1681).
We initially tested each APOL1 variant individually for association with kidney disease risk factors and markers of kidney disease. G1 and G2 variants were associated with a moderate increase in the risk of microalbuminuria, particularly in nondiabetic subjects (odds ratio [OR] = 1.5 per each additional allele; P = 0.01 and 0.02, respectively) (Supplemental Tables S1 and S2). We did not observe any evidence of a relationship between APOL1 genotype and risk of kidney disease among participants with diabetes. G1, but not G2, risk homozygotes had a higher incidence of GFR < 60 ml/min per 1.73 m2, but the difference did not meet our definition of significance (P = 0.025). Neither variant alone was associated with causes of renal disease, including diabetes and hypertension (Supplemental Tables S1 and S2). No association was found between APOL1 genotype and other risk factors for vascular disease, although G1 homozygotes showed a nonsignificant trend toward lower homeostasis model assessment of insulin resistance (HOMA-IR) score, a measure of insulin resistance.
Previous studies have demonstrated that the association of kidney disease with APOL1 variants is strongest under a recessive mode of inheritence model.2 To test a recessive model, we further divided the African-American study population into two groups: individuals having no or one APOL1 risk allele (G1 or G2) and those with two risk alleles. Clinical characteristics of the two groups are shown in Table 2. In the African-American population as a whole, individuals carrying two risk alleles had a higher prevalence of hypertension (OR = 1.7, P = 0.003) and higher albumin excretion levels (median albumin-to-creatinine ratio [ACR]4.1 versus 3.0 mg/g, P = 4.8 × 10⁻⁵) compared with subjects with no or one risk allele. Among nondiabetic subjects, two risk alleles were associated with a 3-fold increase in the rate of microalbuminuria (OR = 2.8, 95% confidence interval [CI] 1.8 to 4.4) and GFR < 60 ml/min per 1.73 m2 (OR = 3.4, 95% CI 1.6 to 7.1 for GFR calculated using the four-variable Modification of Diet in Renal Disease [MDRD] equation [GFR4], and OR = 3.9, 95% CI 1.9 to 7.9 for GFR calculated using the six-variable MDRD equation [GFR6]). Once again, no evidence of a relationship between the number of APOL1 risk alleles and kidney disease was found among study participants with diabetes. There were not enough nondiabetic African-Americans subjects with overt proteinuria (ACR > 300 mg/g, n = 19) to make definitive conclusions, but we did observe a 2.5-fold increased prevalence for African Americans with two risk alleles, consistent with the increase in risk for microalbuminuria (2.8-fold), which did not reach statistical significance. We also compared African Americans with no (n = 684) versus one (n = 856) risk allele for all renal phenotypes and found no differences. Thus, our data support a recessive mode of inheritance model for nondiabetic renal disease associated with G1 and G2.
To confirm that observed associations between APOL1 variants and kidney disease were not a result of differential African ancestry among self-identified African Americans, we repeated the analyses controlling for African ancestry by using percentage African ancestry (as estimated from ancestry-informative genetic markers) as a covariate. Ancestry-informative markers were available for 95% of the study participants (n = 1681). Only four (0.2%) African-American subjects had <40% African ancestry, with a range of 34.5% to 94.6%. The associations between APOL1 renal risk alleles and kidney disease differed only minimally after correction for ancestry (Table 2). Therefore, the associations are not artifacts of hidden population substructure.
We also explored the excess proportion of microalbuminuria and GFR < 60 ml/min per 1.73 m2 in African Americans relative to European Americans that could be attributed to APOL1 variants by comparing rates of these phenotypes in African-American participants with either no or one risk allele or two risk alleles to European-American subjects (Table 3). Among nondiabetic individuals, African Americans with no or one risk allele had a higher rate of microalbuminuria (5.95% versus 2.3%, P = 0.0007), even after adjustment for age, body mass index (BMI), and hypertension, but they were similar to individuals of European ancestry in the proportion of GFR < 60 ml/min per 1.73 m2 (1.7% versus 1.5%, P = 0.53). On the other hand, African Americans with two risk alleles had a markedly increased risk of microalbuminuria (16.5 versus 2.3%, P = 1.3 × 10⁻⁹) and GFR < 60 ml/min per 1.73 m2 (6.7 versus 1.5%, P = 0.0004). There were no genotype-specific differences in the rates of CKD between African and European Americans among diabetic subjects. These results suggest that a large fraction of the excess nondiabetic renal disease in African Americans compared with European Americans is due to APOL1 renal risk variants.
Table 3.
Comparison of microalbuminuria and stage 3 to 5 CKD rates between African Americans with no or one risk allele, two APOL1 risk alleles, and European Americans
| European American No Risk Alleles | African American |
P |
|||
|---|---|---|---|---|---|
| No or One Risk Alleles | Two Risk Alleles | AA (no or one) versus EA | AA (two) versus EA | ||
| Microalbuminuria (%) | |||||
| total | 3.45 | 9.17 | 17.54 | 0.00033 | 1.72 × 10⁻⁸ |
| nondiabetic (n = 1559) | 2.31 | 5.95 | 16.50 | 0.00073 | 1.3 × 10⁻⁹ |
| diabetic (n = 266) | 17.57 | 27.35 | 25.00 | 0.167 | 0.592 |
| GFR4 < 60 ml/min per 1.73 m2 (%) | |||||
| total | 2.04 | 2.47 | 5.51 | 0.26 | 0.042 |
| nondiabetic (n = 1559) | 1.57 | 1.68 | 5.77 | 0.48 | 0.0039 |
| diabetic (n = 266) | 8.11 | 6.99 | 3.57 | 0.28 | 0.30 |
| GFR6 < 60 ml/min per 1.73 m2 (%) | |||||
| total | 1.95 | 2.60 | 6.36 | 0.36 | 0.0080 |
| nondiabetic (n = 1559) | 1.47 | 1.68 | 6.73 | 0.53 | 0.00039 |
| diabetic (n = 266) | 8.11 | 7.86 | 3.57 | 0.39 | 0.30 |
Finally, although the number of events was small, we compared the rates of ESRD in European Americans, African Americans with no or one APOL1 risk allele, and African Americans with two risk alleles (Supplemental Table S3). One European-American participant reported ESRD. Five of 1535 (0.32%) African Americans participants with no or one risk allele had ESRD, whereas 5 of 231 (2.12%) with two risk alleles had ESRD, a 6.6-fold increase (OR = 6.63, 95% CI 1.51 to 29.1, P = 0.006). For nondiabetic African-American participants, 3 of 1308 (0.23%) with no or one risk allele had ESRD, compared with 5 of 203 (2.4%) with two risk alleles, a risk increase of over 10-fold (OR = 10.7, 95% CI 2.1 to 69.4, P = 0.0018).
DISCUSSION
ESRD rates in the United States are rising rapidly, and a disproportionate number of these patients are African American.1 Coding variants in APOL1, found exclusively in individuals with recent African ancestry, are a major genetic contributor to nondiabetic renal disease and appear to explain a substantial fraction of the overall risk disparity. Here, we analyze the role of these renal risk variants in a large population-based study.
Determining the population frequency of alleles such as G1 and G2 with very large effects on disease risk from case-control studies is difficult. Previous estimates from African-American controls alone, potentially affected by exclusion criteria and misclassification, indicated that the allele frequency for G1 is 21% and for G2 is 13%, with 12% of individuals having two risk alleles.2 In the geographically distinct DHS, those proportions are 22.1%, 14.5%, and 13%, respectively, corresponding closely to a control population from the southeastern United States. Previous data from a case-control series suggested that two renal risk alleles confer a 7-fold increase in hypertension-attributed ESRD and a 10-fold increase in biopsy-proven FSGS.2 Although these variants have not been previously tested for diabetic renal disease, case-control studies for diabetic nephropathy using single nucleotide polymorphisms (SNPs) linked to APOL1 risk variants suggested no effect on disease risk11,14 or a very small risk compared with nondiabetic renal disease.13 In theory, a case-control design could lead to confounded results (e.g., if these “risk” alleles affected survival on dialysis, changed the risk of diabetes, or interacted in unexpected ways with diabetes to alter mortality). The DHS provided a population-based survey to assess the effects of APOL1 risk alleles.
We focused on microalbuminuria and impaired kidney function, as estimated by GFR < 60 ml/min per 1.73 m2, because of the relatively few subjects during the initial DHS survey with hard end points such as macroalbuminuria or dialysis dependence. Although opinion in the field is divided regarding the precise significance of microalbuminuria, urinary albumin levels are easily and accurately quantifiable and have been associated with CKD progression and ultimately ESRD.15,16 For impaired renal function, we used a definition of GFR (by the MDRD equation) <60 ml/min per 1.73 m2, a widely used value to define clinically relevant CKD. This threshold avoids documented inaccuracies of estimating GFR >60 ml/min per 1.73 m2 and the difficulty of distinguishing between normal and mildly impaired (GFR 60 to 90 ml/min per 1.73 m2) kidney function.17,18
We found an association between prevalence of microalbuminuria and the presence of two APOL1 renal risk alleles. This difference was marked in subjects without diabetes, and no differences were noted in those subjects with diabetes. Follow-up data from DHS2 should ultimately help clarify the prognostic significance of microalbuminuria in renal disease associated with APOL1 genotype. We also found a strong association between CKD and the presence of two APOL1 renal risk variants. Here, the 2.5-fold elevated risk in the cohort as a whole increased to nearly 4-fold when nondiabetics were considered separately, consistent with previous case-control studies. Subjects with two APOL1 risk alleles and diabetes (rather than having an increase in CKD risk) in fact tended to have a lower CKD risk, but this difference was nonsignificant. This lack of apparent association with diabetic nephropathy despite the major effect on nondiabetic renal disease has several potential explanations.
First, APOL1 renal risk alleles may alter the risk of diabetes itself, although our diabetes prevalence data from this study suggest that this type of confounding could not explain the striking difference between diabetic and nondiabetic renal disease. Second, individuals with diabetes and two APOL1 renal risk alleles may be at markedly higher risk for vascular events and consequently not survive to clinically apparent CKD. Arguing against this interpretation are the trends toward more favorable lipid and insulin resistance parameters associated with APOL1 renal risk alleles and no significant change in the fraction of the population with two risk variants when categorized by age (data not shown). Third, APOL1 risk alleles and diabetes may act through some common pathway, or diabetes may overshadow the effects of the APOL1 risk genotype.
Our preliminary data regarding ESRD from the DHS, albeit with too few events to define narrow CIs, suggest a 10-fold difference in nondiabetic ESRD risk for African Americans with two APOL1 renal disease alleles. These population-based data are consistent with our previous case-control data.
Of particular interest is the similarity of nondiabetic CKD rates in European-American compared with African-American participants with no or one APOL1 risk allele and the large increase in renal disease in African-American subjects with two risk alleles. This comparison suggests that APOL1 risk alleles explain a major fraction of the difference in nondiabetic kidney disease risk between European Americans and African Americans. A more inclusive definition of nondiabetic CKD combining GFR < ml/min per 1.73 m2 or microalbuminuria indicates rates of 3.9% for European Americans, 6.7% for African Americans without the risk genotype, and 19.2% for African Americans with the risk genotype. Although it is certain that other genetic factors and environmental exposures remain important, the APOL1 genotype appears to be a major component in any explanation of renal disease disparity in the United States.
In the future, clinicians may be able to risk-stratify individuals more accurately by APOL1 risk allele status than by race. We will need more longitudinal data about the lifetime risk of kidney disease for individuals with the APOL1 high-risk genotype in the general population. Follow-up data for this same cohort (DHS2) will begin to provide information about ESRD rates and the rate of decline of renal function on the basis of APOL1 genotype. At present, clinical studies are needed to address whether APOL1 genotyping can help improve outcomes in the transplant setting or whether the APOL1 genotype predicts the response to particular drugs (e.g., angiotensin-converting enzyme inhibitors or angiotensin receptor blockers).
Despite the very large effect on CKD and ESRD risk in African Americans, the biologic basis of APOL1-mediated renal disease remains obscure. With 13% of African Americans (>3.5 million individuals) carrying two risk alleles, understanding the molecular mechanisms and environmental factors that together drive this disease process is crucial for addressing the growing epidemic of ESRD.
CONCISE METHODS
Subjects
The DHS is a multiethnic population-based probability sample of Dallas county residents aged 18 to 65 years that was designed to include equal numbers of black and nonblack subjects. The sampling design and recruitment procedures have been described previously in detail.19 The Institutional Review Board of the University of Texas Southwestern Medical Center at Dallas approved the study, and written informed consent was obtained from all subjects.
A total of 3551 study participants (52% African Americans, self-identified as black; 29% individuals of mixed European descent, self-identified as white; 17% Hispanics, self-identified as Hispanic; and 2% other ethnicities) completed an extensive household interview and provided in-home fasting venous blood and urine samples. The ethnicity was self-assigned according to a list of categories used in the Third National Health and Nutrition Examination Survey.20 A subgroup of subjects (n = 3071) also underwent multiple imaging studies during a clinic visit. Only the individuals of self-reported African and European ancestry (n = 2867) were included in the study presented here. Several participants (n = 111) were excluded from the analysis of microalbuminuria because of missing data on urine albumin and creatinine.
Five BP measurements were taken using an automatic oscillometric device (Welch Allyn, series no. 52,000, Arden, NC) while subjects were in seated position. The average of the third through fifth measurements was used in the analysis. Hypertension was defined as systolic BP ≥ 140 mmHg, diastolic BP ≥ 90 mmHg, or a self-reported diagnosis or treatment for hypertension. Diabetes status was assigned based on a self-reported physician diagnosis of diabetes (except during pregnancy), use of insulin or glucose-lowering medication, or a fasting glucose value of ≥126 mg/dl. The HOMA-IR score was calculated from fasting values of insulin and glucose.21
Measures of Kidney Function.
Urine albumin and creatinine were measured from the first morning void urine samples, and the ACR was calculated in milligrams per gram for each subject. Urine albumin was determined by the turbidimetric method. Serum and urine creatinine levels were measured using an alkaline picrate assay.22 GFR (in ml/min per 1.73 m2 of body surface area [BSA]) was determined using the four- and six-variable MDRD equations:23,24
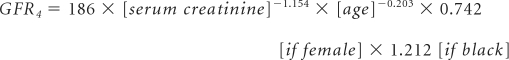 |
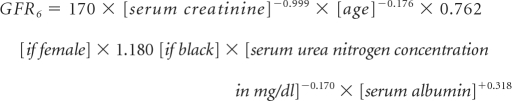 |
CKD was defined as the presence of microalbuminuria (ACR ≥ 17 mg/g in men and ≥25 mg/g in women25) and a GFR ≥ 60 ml/min per 1.73 m2 BSA (stage 1 to 2), or a GFR < 60 ml/min per 1.73 m2 BSA (stage 3 to 5), according to the National Kidney Foundation Guidelines.26,27
Estimated Ancestry.
The amount of racial admixture was estimated using STRUCTURE28 with 2270 ancestry-informative SNPs29 in 3302 participants (including 1726 self-identified African Americans) who had been genotyped using high-density oligonucleotide arrays (Perlegen Sciences, Mountain View, CA). We used percentage African ancestry (estimated from the ancestry-informative SNPs) as a covariate in our models to rule out false associations due to population substructure.
Genotyping.
Genomic DNA was extracted from circulating leukocytes. Genotypes for APOL1 polymorphisms were determined using a predesigned TaqMan AD assay (Applied Biosystems) in all DHS participants who had provided a blood sample. A total of 3544 participants were genotyped. Genotype call rates were 98.3% for rs73885319 and 99.2% for rs71785313.
Statistical Methods.
The relationship between continuous characteristics and APOL1 genotypes and other subgroups was assessed using linear regression with adjustment for age and gender. Additional covariates included BMI, systolic BP, presence of diabetes, and use of antihypertensive medication, as appropriate. Variables that were moderately skewed (e.g., BMI, BP, HOMA-IR, and plasma lipid levels) were log-transformed before analysis. For those traits in which the distribution departed more severely from normal (ACR and GFR), nonparametric methods were used to test the association (Wilcoxon rank-sum test and Jonckheere-Terpstra test for trend). The P values from rank-based tests were reported after checking the consistency of estimates with a linear model analysis. The prevalence of diabetes, hypertension, and CKD among genotype groups was compared using Fisher's exact test and logistic regression with adjustment for age, gender, and other covariates. To estimate the effect of APOL1 variants on kidney disease attributed to diabetes and to other causes, the analyses of renal function were stratified by diabetes status. P < 0.01 was considered statistically significant. All statistical analyses were performed using the R statistical language software package (http://www.R-project.org).
DISCLOSURES
D.J.F., G.G., M.R.P., and the Beth Israel Deaconess Medical Center have filed for patents related to APOL1.
Supplementary Material
Acknowledgments
We thank the DHS participants for their invaluable contribution. We also thank Dr. Helen Hobbs and the McDermott Center for Human Growth and Development at the University of Texas Southwestern Medical Center in Dallas, Texas for facilitating this study, and we thank Dr. Amit Khera for helpful discussion. The National Institutes of Health National Institute of Diabetes and Digestive and Kidney Diseases supported this work with grants DK54931 (to M.R.P.) and DK076868 (to D.J.F.).
Footnotes
Published online ahead of print. Publication date available at www.jasn.org.
See related editorial, “Apolipoprotein L1 and the Genetic Basis for Racial Disparity in Chronic Kidney Disease,” on pages 1955–1958.
Supplemental information for this article is available online at http://www.jasn.org/.
REFERENCES
- 1. U.S. Renal Data System: USRDS 2009 Annual Data Report: Atlas of Chronic Kidney Disease and End-Stage Renal Disease in the United States, Bethesda, MD, National Institute of Health, National Institute of Diabetes and Digestive and Kidney Disease, 2009 [Google Scholar]
- 2. Genovese G, Friedman DJ, Ross MD, Lecordier L, Uzureau P, Freedman BI, Bowden DW, Langefeld CD, Oleksyk TK, Uscinski Knob AL, Bernhardy AJ, Hicks PJ, Nelson GW, Vanhollebeke B, Winkler CA, Kopp JB, Pays E, Pollak MR: Association of trypanolytic ApoL1 variants with kidney disease in African Americans. Science, 329: 841–855, 2010 [DOI] [PMC free article] [PubMed] [Google Scholar]
- 3. Tzur S, Rosset S, Shemer R, Yudkovsky G, Selig S, Tarekegn A, Bekele E, Bradman N, Wasser WG, Behar DM, Skorecki K: Missense mutations in the APOL1 gene are highly associated with end stage kidney disease risk previously attributed to the MYH9 gene. Hum Genet 128: 345–350, 2010 [DOI] [PMC free article] [PubMed] [Google Scholar]
- 4. Duchateau PN, Pullinger CR, Orellana RE, Kunitake ST, Naya-Vigne J, O'Connor PM, Malloy MJ, Kane JP: Apolipoprotein L, a new human high density lipoprotein apolipoprotein expressed by the pancreas. Identification, cloning, characterization, and plasma distribution of apolipoprotein L. J Biol Chem 272: 25576–25582, 1997 [DOI] [PubMed] [Google Scholar]
- 5. Wan G, Zhaorigetu S, Liu Z, Kaini R, Jiang Z, Hu CA: Apolipoprotein L1, a novel Bcl-2 homology domain 3-only lipid-binding protein, induces autophagic cell death. J Biol Chem 283: 21540–21549, 2008 [DOI] [PMC free article] [PubMed] [Google Scholar]
- 6. Duchateau PN, Pullinger CR, Cho MH, Eng C, Kane JP: Apolipoprotein L gene family: Tissue-specific expression, splicing, promoter regions; discovery of a new gene. J Lipid Res 42: 620–630, 2001 [PubMed] [Google Scholar]
- 7. Horrevoets AJ, Fontijn RD, van Zonneveld AJ, de Vries CJ, ten Cate JW, Pannekoek H: Vascular endothelial genes that are responsive to tumor necrosis factor-alpha in vitro are expressed in atherosclerotic lesions, including inhibitor of apoptosis protein-1, stannin, and two novel genes. Blood 93: 3418–3431, 1999 [PubMed] [Google Scholar]
- 8. Monajemi H, Fontijn RD, Pannekoek H, Horrevoets AJ: The apolipoprotein L gene cluster has emerged recently in evolution and is expressed in human vascular tissue. Genomics 79: 539–546, 2002 [DOI] [PubMed] [Google Scholar]
- 9. Page NM, Butlin DJ, Lomthaisong K, Lowry PJ: The human apolipoprotein L gene cluster: Identification, classification, and sites of distribution. Genomics 74: 71–78, 2001 [DOI] [PubMed] [Google Scholar]
- 10. Vanhamme L, Paturiaux-Hanocq F, Poelvoorde P, Nolan DP, Lins L, Van Den Abbeele J, Pays A, Tebabi P, Van Xong H, Jacquet A, Moguilevsky N, Dieu M, Kane JP, De Baetselier P, Brasseur R, Pays E: Apolipoprotein L-I is the trypanosome lytic factor of human serum. Nature 422: 83–87, 2003 [DOI] [PubMed] [Google Scholar]
- 11. Kao WH, Klag MJ, Meoni LA, Reich D, Berthier-Schaad Y, Li M, Coresh J, Patterson N, Tandon A, Powe NR, Fink NE, Sadler JH, Weir MR, Abboud HE, Adler SG, Divers J, Iyengar SK, Freedman BI, Kimmel PL, Knowler WC, Kohn OF, Kramp K, Leehey DJ, Nicholas SB, Pahl MV, Schelling JR, Sedor JR, Thornley-Brown D, Winkler CA, Smith MW, Parekh RS: MYH9 is associated with nondiabetic end-stage renal disease in African Americans. Nat Genet 40: 1185–1192, 2008 [DOI] [PMC free article] [PubMed] [Google Scholar]
- 12. Kopp JB, Smith MW, Nelson GW, Johnson RC, Freedman BI, Bowden DW, Oleksyk T, McKenzie LM, Kajiyama H, Ahuja TS, Berns JS, Briggs W, Cho ME, Dart RA, Kimmel PL, Korbet SM, Michel DM, Mokrzycki MH, Schelling JR, Simon E, Trachtman H, Vlahov D, Winkler CA: MYH9 is a major-effect risk gene for focal segmental glomerulosclerosis. Nat Genet 40: 1175–1184, 2008 [DOI] [PMC free article] [PubMed] [Google Scholar]
- 13. Freedman BI, Hicks PJ, Bostrom MA, Comeau ME, Divers J, Bleyer AJ, Kopp JB, Winkler CA, Nelson GW, Langefeld CD, Bowden DW: Non-muscle myosin heavy chain 9 gene MYH9 associations in African Americans with clinically diagnosed type 2 diabetes mellitus-associated ESRD. Nephrol Dial Transplant 24: 3366–3371, 2009 [DOI] [PMC free article] [PubMed] [Google Scholar]
- 14. Behar DM, Rosset S, Tzur S, Selig S, Yudkovsky G, Bercovici S, Kopp JB, Winkler CA, Nelson GW, Wasser WG, Skorecki K: African ancestry allelic variation at the MYH9 gene contributes to increased susceptibility to non-diabetic end-stage kidney disease in Hispanic Americans. Hum Mol Genet 19: 1816–1827, 2010 [DOI] [PMC free article] [PubMed] [Google Scholar]
- 15. Kronenberg F: Emerging risk factors and markers of chronic kidney disease progression. Nat Rev Nephrol 5: 677–689, 2009 [DOI] [PubMed] [Google Scholar]
- 16. Tangri N, Stevens LA, Griffith J, Tighiouart H, Djurdjev O, Naimark D, Levin A, Levey AS: A predictive model for progression of chronic kidney disease to kidney failure. JAMA 305: 1553–1559, 2011 [DOI] [PubMed] [Google Scholar]
- 17. Bauer C, Melamed ML, Hostetter TH: Staging of chronic kidney disease: Time for a course correction. J Am Soc Nephrol 19: 844–846, 2008 [DOI] [PubMed] [Google Scholar]
- 18. Lamb EJ, Tomson CR, Roderick PJ: Estimating kidney function in adults using formulae. Ann Clin Biochem 42: 321–345, 2005 [DOI] [PubMed] [Google Scholar]
- 19. Victor RG, Haley RW, Willett DL, Peshock RM, Vaeth PC, Leonard D, Basit M, Cooper RS, Iannacchione VG, Visscher WA, Staab JM, Hobbs HH: The Dallas Heart Study: A population-based probability sample for the multidisciplinary study of ethnic differences in cardiovascular health. Am J Cardiol 93: 1473–1480, 2004 [DOI] [PubMed] [Google Scholar]
- 20. Third National Health and Nutrition Examination Survey Questionnaire, Hyattsville, MD, Centers for Disease Control and Prevention, National Center for Health Statistics [Google Scholar]
- 21. Wallace TM, Levy JC, Matthews DR: Use and abuse of HOMA modeling. Diabetes Care 27: 1487–1495, 2004 [DOI] [PubMed] [Google Scholar]
- 22. Kramer H, Toto R, Peshock R, Cooper R, Victor R: Association between chronic kidney disease and coronary artery calcification: The Dallas Heart Study. J Am Soc Nephrol 16: 507–513, 2005 [DOI] [PubMed] [Google Scholar]
- 23. Coresh J, Astor BC, Greene T, Eknoyan G, Levey AS: Prevalence of chronic kidney disease and decreased kidney function in the adult US population: Third National Health and Nutrition Examination Survey. Am J Kidney Dis 41: 1–12, 2003 [DOI] [PubMed] [Google Scholar]
- 24. Levey AS, Bosch JP, Lewis JB, Greene T, Rogers N, Roth D: A more accurate method to estimate glomerular filtration rate from serum creatinine: A new prediction equation. Modification of Diet in Renal Disease Study Group. Ann Intern Med 130: 461–470, 1999 [DOI] [PubMed] [Google Scholar]
- 25. Mattix HJ, Hsu CY, Shaykevich S, Curhan G: Use of the albumin/creatinine ratio to detect microalbuminuria: Implications of sex and race. J Am Soc Nephrol 13: 1034–1039, 2002 [DOI] [PubMed] [Google Scholar]
- 26. K/DOQI clinical practice guidelines for chronic kidney disease: Evaluation, classification, and stratification. Am J Kidney Dis 39: S1–S266, 2002 [PubMed] [Google Scholar]
- 27. Levey AS, Eckardt KU, Tsukamoto Y, Levin A, Coresh J, Rossert J, De Zeeuw D, Hostetter TH, Lameire N, Eknoyan G: Definition and classification of chronic kidney disease: A position statement from Kidney Disease: Improving Global Outcomes (KDIGO). Kidney Int 67: 2089–2100, 2005 [DOI] [PubMed] [Google Scholar]
- 28. Falush D, Stephens M, Pritchard JK: Inference of population structure using multilocus genotype data: Linked loci and correlated allele frequencies. Genetics 164: 1567–1587, 2003 [DOI] [PMC free article] [PubMed] [Google Scholar]
- 29. Smith MW, Patterson N, Lautenberger JA, Truelove AL, McDonald GJ, Waliszewska A, Kessing BD, Malasky MJ, Scafe C, Le E, De Jager PL, Mignault AA, Yi Z, De The G, Essex M, Sankale JL, Moore JH, Poku K, Phair JP, Goedert JJ, Vlahov D, Williams SM, Tishkoff SA, Winkler CA, De La Vega FM, Woodage T, Sninsky JJ, Hafler DA, Altshuler D, Gilbert DA, O'Brien SJ, Reich D: A high-density admixture map for disease gene discovery in African Americans. Am J Hum Genet 74: 1001–1013, 2004 [DOI] [PMC free article] [PubMed] [Google Scholar]
Associated Data
This section collects any data citations, data availability statements, or supplementary materials included in this article.