The role of retinal pericytes in diabetic retinopathy was not clear. This study demonstrated a novel role of retinal pericytes, suggesting that their immunoregulatory activity could contribute to the pathogenesis of diabetic retinopathy.
Abstract
Purpose.
To test the hypothesis that retinal pericytes (RPCs) are immunosuppressive; therefore, their loss of function under hyperglycemic conditions favors retinal inflammation and contributes to the pathogenesis of diabetic retinopathy (DR).
Methods.
Isolated mouse and human RPCs were tested in T cell function assays to evaluate their capability of inhibiting T cell responses. To elucidate the underlying mechanisms, transwell systems, blocking mAbs against PD-L1 and IL-10 were used. The efficacy of RPCs in protecting retinal endothelial cells (RECs) from inflammation-induced apoptosis was assessed by apoptosis detection staining. Finally, to test whether hyperglycemic conditions impair the immunomodulatory activity of RPCs, RPCs pre-incubated in high glucose or methylglyoxal (MGO) were evaluated using the T cell proliferation assays.
Results.
RPCs profoundly inhibited activated T cell proliferation and inflammatory cytokine production. The T cell inhibitory activity of RPCs was decreased, but was not abolished, in transwell experiments. RPCs express PD-L1, and blocking PD-L1 reduced RPCs' efficacy of T cell inhibition. RPCs also produce IL-10, and neutralization of IL-10 reduced their immunosuppressive activity. There were significantly reduced numbers of inflammation-induced apoptosis-detected RECs in the presence of RPCs. Incubation of RPCs with either high glucose or MGO reduced the activity of RPCs to inhibit activated T cell proliferation.
Conclusions.
RPCs are highly immunosuppressive and they protected RECs from inflammation-mediated apoptosis. Hyperglycemic conditions impaired the T cell inhibitory activity of RPCs. These results reveal a new function of RPCs, and its regulation under hyperglycemic conditions. This may represent a novel mechanism by which RPCs contribute to preservation of retinal integrity in diseases, including DR.
Pericytes are critical for maintaining vessel stability and controlling endothelial cell proliferation.1,2 The retina has the most abundant pericyte density in the entire body.3 The loss of retinal pericytes (RPCs) is considered a hallmark of early-stage diabetic retinopathy (DR) in patients and animal studies.4 Although mice lacking pericytes die as a result of microvascular leakage and hemorrhage,5,6 mice with reduced numbers of pericytes developed microvascular lesions consistent with DR.7 Despite all these intriguing discoveries, the underlying mechanism by which RPCs contribute to retinal health and integrity remains poorly understood.
Inflammation increases vascular permeability and induces edema, tissue destruction, and neovascularization, features shared by DR.8,9 Inflammation has been implicated in the pathogenesis of DR.10 In retina/vitreous of patients/animals with retinopathy, levels of inflammatory cytokines (e.g., IFN-γ and TNF-α) are increased,11,12 levels of adhesion molecules (e.g., ICAM-1) that facilitate attachment and infiltration of leukocytes are increased,13 and activated monocytes and granulocytes are identified.14 All of this mounting evidence suggests that inflammation and the immune system are integrally involved in the development of DR.
In this report, using isolated human and mouse RPCs, we demonstrated, for the first time, that RPCs are immunosuppressive. These cells profoundly inhibited T cell proliferation and reduced inflammatory cytokine production. Both the cell surface proteins and released soluble factors were integrally involved in the process. Incubation with high glucose or methylglyoxal (MGO) significantly impaired the T cell inhibitory activity of RPCs, suggesting that loss of the immunosuppressive activity of RPCs under chronic hyperglycemic conditions could contribute to retinal inflammation and the development of DR.
Materials and Methods
Human and Mouse RPC Isolation
Mouse RPCs and retinal endothelial cells (RECs) were isolated from genetically engineered mice (Immortomice; Charles River Laboratories, Wilmington, MA) expressing a temperature-sensitive simian virus (SV) 40 large T antigen (Charles River Laboratories), and characterized as previously described by Scheef et al.15 and Su et al.16 Human RPCs were isolated from eyes of one nondiabetic donor (45 years of age; Cleveland Eye Bank) and characterized as previously described by Miller et al.17
T Cell Proliferation Assays
A conventional carboxyfluorescein succinimidyl ester (CFSE)–based T cell proliferation assay was used to test the T cell inhibitory activity of RPCs using previously described methods, with minor modifications.18 For mouse-activated T cell proliferation assays, naive C57BL/6 mouse spleen cells were first labeled by incubating them with 0.3 μM of CFSE (Invitrogen, Carlsbad, CA) at 37°C for 8 minutes. After washing, 2.0 μg/mL of anti-CD3 mAb (BD Biosciences, San Jose, CA) was added to the CFSE-labeled spleen cells to activate T cells. The CFSE-labeled, anti-CD3 mAb-activated cells were then aliquoted into wells of a 96-well plate at a concentration of 0.4 × 10⁶ cells/well, and incubated with different numbers of RPCs (RPCs/T cell ratio: 0, 1:10, 1:20, 1:40, and 1:80) in triplicate. After 3 days of incubation, T cell proliferation was assessed by measuring CFSE dilution using flow cytometry, gating on CD4+ T cells, and by checking under a microscope the numbers and sizes of cell clusters formed by the proliferating cells. The human-activated T cell proliferation assays were performed in a similar fashion. In brief, T cells in freshly prepared human peripheral blood mononuclear cells (PBMCs; Stem Cell Facility at Case Western Reserve University, Cleveland, OH) were activated by incubation with anti-CD3/CD28 polystyrene spherical beads (Dynabeads; Invitrogen) following the manufacturer's provided protocols. After 96 hours of incubation, the cells were analyzed by flow cytometry, gating on CD4+ T cells. For PD-L1 (programmed death ligand 1) blocking experiments, 5 μg/mL of a function-neutralizing anti–PD-L1 mAb (sodium azide–free, clone MIH5; eBioscience, Inc., San Diego, CA) or its isotype control was added into the cocultures; for IL-10 neutralization experiments, 2 μg/mL of a function-neutralizing anti–IL-10 mAb (sodium azide–free, clone JES5-16E3; eBioscience) or its isotype control was used.
PD-L1 Expression Assays
Mouse RPC (1 × 10⁵) were incubated without and with different stimuli (100 ng/mL IFN-γ, 300 ng/mL IL-6, 300 ng/mL IL-17, or 500 ng/mL lipopolysaccharide [LPS]) for 24 hours at 37°C, then the expression levels of PD-L1 were assessed by flow cytometry.
IFN-γ, TNF-α, and IL-10 ELISAs
Concentrations of IFN-γ, TNF-α, and IL-10 in the culture supernatants were measured by standard ELISAs using respective ELISA kits (BD Biosciences), following the manufacturer's provided protocols.
REC Apoptosis Assay
Murine RECs16 were cultured in wells of a 24-well plate (1 × 10⁵/well). In each well, a culture insert (0.4 μM pore size; BD Biosciences) containing anti-CD3–activated T cells (4 × 10⁶/well) and different numbers of murine RPCs were cocultured with the RECs in wells of a 24-well plate. After 48 hours, the RECs at the bottom of the wells were stained using an apoptosis detection kit (Annexin V; BD Biosciences) and analyzed by flow cytometry following the manufacturer's provided protocol.
Glycation of RPCs
RPCs were cultured in complete Dulbecco's modified Eagle's medium (DMEM) with low or high glucose (5 or 30 mM, respectively; Invitrogen) for a week with daily medium changes, or pre-incubated with 50 μM of MGO in complete DMEM for 16 hours at 37°C. After being washed, the T cell inhibitory activity of these cells was assessed in the same T cell proliferation assays as described earlier.
Statistical Analysis
All experiments were repeated at least twice with similar results. The data were analyzed using an independent t-test. Probability values of 0.05 were considered to be significant.
Results
RPCs Inhibit T Cell Responses
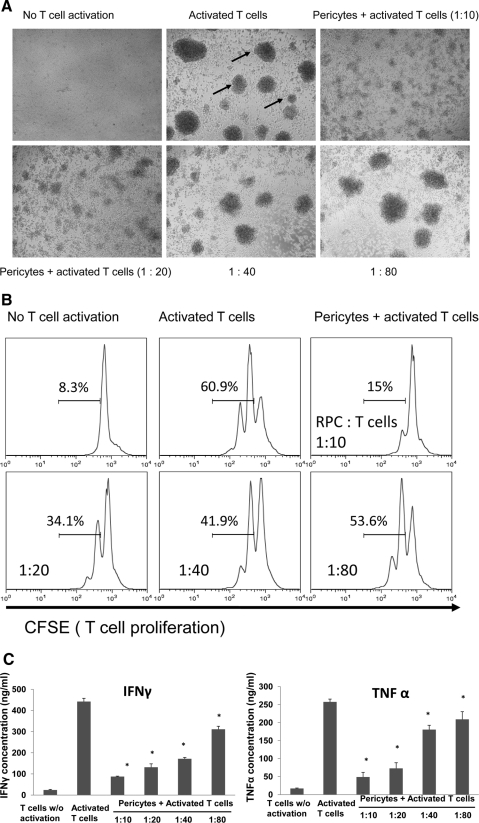
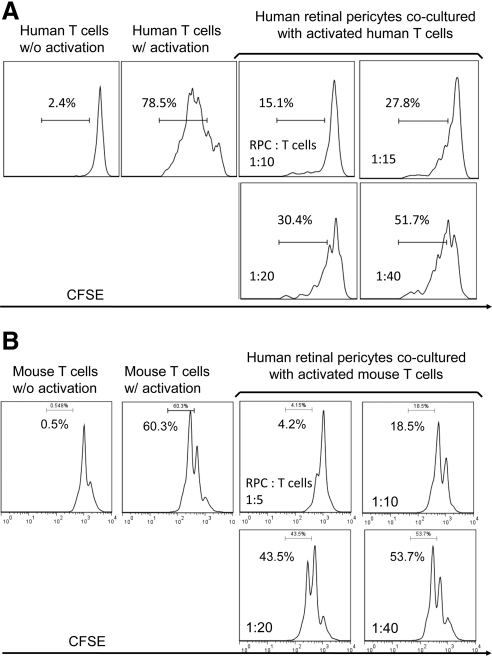
To test whether mouse RPCs inhibit T cell responses, we cocultured different numbers of mouse RPCs with anti-CD3 mAb-stimulated T cells, then assessed T cell proliferation by analyzing the proliferating T cell–formed clusters directly under a microscope, and by measuring CFSE dilution using a flow cytometer. Microscopic analysis (Fig. 1A) showed that RPCs inhibit T cell proliferation in a dose-dependent manner. At a ratio of 1:10, RPCs almost completely inhibited T cell proliferation, as indicated by the sizes and numbers of the formed cell clusters. The inhibitory effects of RPCs weaned down at the ratio of 1:80, at which the size and numbers of activated T cell clusters were comparable to those of controls. Flow cytometry analysis of CFSE-labeled T cells showed the same pattern: compared with 60.9% proliferating T cells in cultures without RPCs, the number was reduced to 15% when RPCs were cocultured with T cells at a ratio of 1:10, 34.1% at a ratio of 1:20, 41.9% at a ratio of 1:40, and 53.6% at a ratio of 1:80 (Fig. 1B). In accordance with these results, ELISA experiments showed that levels of IFN-γ and TNF-α in the culture supernatants were significantly reduced in the presence of RPCs in a dose-dependent manner (Fig. 1C). To verify that human RPCs have the same T cell inhibitory activity as that of mouse RPCs, we repeated the same T cell proliferation assays using isolated primary human RPCs. These assays showed that human RPCs inhibited both human (Fig. 2A) and mouse (Fig. 2B) activated T cell proliferation. In light of this result, we kept using mouse RPCs in the following studies to explore the potential underlying mechanisms.
Figure 1.
Mouse RPCs inhibit mouse T cell responses. (A) Mouse RPCs inhibited activated mouse T cell proliferation as assessed under a microscope (arrows: clusters formed from proliferating T cells). Splenocytes from naive C57BL/6 mice were labeled with CFSE and incubated with different numbers of RPCs in the presence of 2 μg/mL anti-CD3 IgG to activate T cells. Representative images were taken under a microscope. (B) Mouse RPCs inhibited activated mouse T cell proliferation as assessed by flow cytometry. Cells from the above-described cocultures were analyzed by flow cytometry, gating on CD4+ T cells. Numbers indicate percentages of proliferated T cells. (C) Mouse RPCs inhibited production of inflammatory cytokines. Supernatants from the above-described cocultures were analyzed by standard IFN-γ and TNF-α ELISAs.
Figure 2.
Human RPCs inhibit both human (A) and mouse (B) T cell response. Isolated primary human RPCs were tested in similar CFSE-based T cell proliferating assays as described above. For human T cell proliferation assays, T cells in the freshly prepared human PBMC were activated by anti-CD3/CD28 polystyrene spherical beads following the manufacturer's provided protocol, and incubated with different numbers of RPCs for 96 hours. Cells from the above-described cocultures were analyzed by flow cytometry, gating on CD4+ T cells. Effects of human RPCs on mouse T cells were assessed following the same protocol described above. Numbers indicate percentages of proliferated T cells. Results are representative from three independent experiments performed in duplicate.
T Cell Inhibitory Activity of RPCs Requires Both Cell Surface Molecules and Soluble Factors
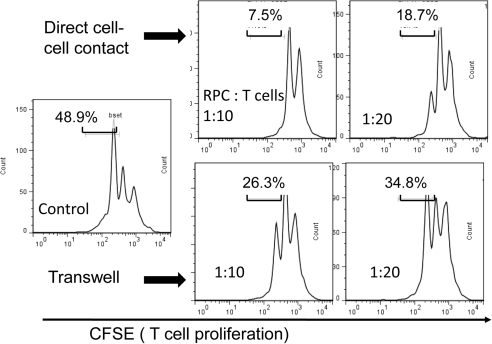
We next tried to explore the mechanisms by which RPCs inhibit T cell proliferation using a transwell system. We cultured RPCs in inserts (0.4 μM pore size; BD Biosciences) and had the activated T cells in the lower wells, in which direct cell–cell contact is not allowed, but soluble factors can be freely exchanged. These assays (Fig. 3) showed that the activity of RPCs to inhibit T cells was reduced without direct cell–cell contact (7.5% vs. 26.3% at the ratio of 1:10; 18.7% vs. 34.8% at the ratio of 1:20), but was not abolished (48.9% when no RPCs were present), indicating that both cell surface molecules and soluble factors produced by RPCs are required for efficient T cell inhibition.
Figure 3.
Both cell–cell contact and soluble factors are involved in RPC-mediated T cell inhibition. The same CFSE-based T cell proliferation assays were performed, except that RPCs were cultured in the inserts, physically separated from the activated T cells in the bottom wells. After 3 days of culture, T cell proliferation was assessed by flow cytometry. Results are representative from three independent experiments performed in duplicate.
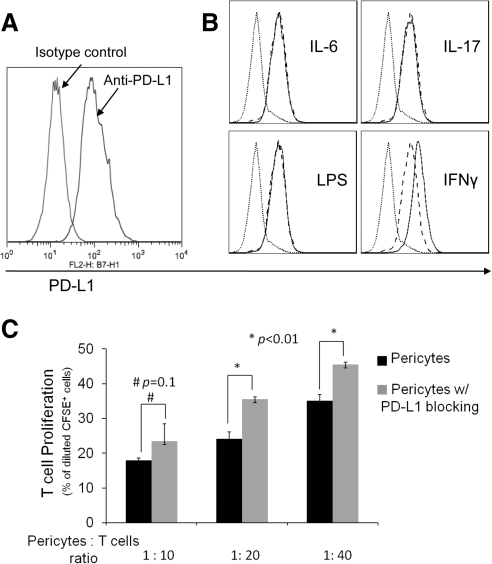
Because PD-L1 has been implicated in the immunosuppressive activity of many cells, we examined whether RPCs express PD-L1. Flow cytometry analysis showed that RPCs constitutively express PD-L1 on the cell surface (Fig. 4A). To test the effects of inflammatory stimuli on PD-L1 expression in RPCs, we treated RPCs with IL-6, IL-17, LPS, or IFN-γ for 24 hours and compared the levels of PD-L1 again by flow cytometry. These assays showed that at the time of detection, IL-6, IL-17, and LPS had no significant effect on PD-L1 levels on RPCs, whereas IFN-γ upregulated PD-L1 expression (Fig. 4B). To test the role of PD-L1 in the T cell inhibitory activity of RPCs, we repeated the T cell proliferation assays after blocking the function of PD-L1 using its neutralizing mAb. These assays (Fig. 4C) showed that at ratios of 1:20 and 1:40, blocking PD-L1 reduces the efficacy of T cell inhibition, indicating that PD-L1 is at least one of the cell surface molecules responsible for the T cell inhibitory activity of RPCs.
Figure 4.
Role of PD-L1 in RPC-mediated T cell inhibition. (A) RPCs express PD-L1. RPCs (0.5 × 10⁶) were stained with 5 μg/mL PE-labeled anti-PD-L1 IgG or matched isotype control, then analyzed by flow cytometry. (B) PD-L1 on RPCs is upregulated by IFN-γ. RPCs (1 × 10⁵/mL) were incubated without and with IL-6, IL-17, LPS, or IFN-γ for 24 hours. After washing, levels of PD-L1 were assessed by flow cytometry (dotted line, isotype control; dashed line, without treatment; thin line, with stimuli). (C) Blocking PD-L1 activity reduces the efficacy of RPCs in inhibiting T cells. The same CFSE-based T cell proliferation assays were performed using activated T cells and different numbers of RPCs in the presence of 5 μg/mL anti-PD-L1 IgG or isotype controls (azide free).
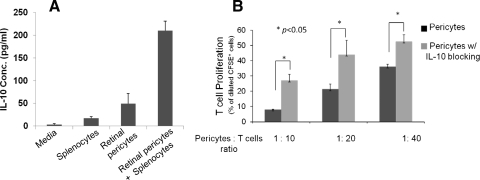
To begin to determine the potential soluble factors that are involved in the T cell inhibitory activity of RPCs, we examined whether IL-10, a potent immunosuppressive cytokine, is produced by the RPCs using standard ELISA. These assays showed that IL-10 is produced by RPCs (Fig. 5A). We then repeated the T cell inhibition assays in the presence of an IL-10 neutralization mAb. These assays (Fig. 5B) showed that blocking the activity of IL-10 significantly allowed T cell proliferation in the presence of RPCs, indicating that IL-10 is an important soluble factor that contributes to the T cell inhibitory activity of RPCs.
Figure 5.
Role of IL-10 in RPC-mediated T cell inhibition. (A) RPCs produced IL-10 in interaction with activated T cells. Supernatants were collected from cultures of 0.6 × 10⁶ splenocytes, 0.6 × 10⁵ RPCs, and cocultures of 0.6 × 10⁶ splenocytes and 0.6 × 10⁵ RPCs; then IL-10 levels were measured using standard ELISA. (B) Blocking IL-10 activity reduced the efficacy of RPCs in inhibiting T cells. The same CFSE-based T cell proliferation assays were performed using activated T cells and different numbers of RPCs in the presence of 2 μg/mL anti-IL-10 IgG or isotype controls (azide free). Results are representative of three independent experiments performed in duplicate. Data are mean value ± SD; *P < 0.01.
RPCs Protect RECs from Inflammation-Induced Apoptosis
To determine whether RPCs protect RECs from inflammation-induced injury, we cultured RECs with culture inserts containing activated T cells and different numbers of RPCs, and assessed REC apoptosis by detection staining (Annexin V). These assays (Fig. 6) showed that activated T cells induce apoptosis of RECs, and that RPCs protect RECs from the T cell–mediated attack in a dose-dependent manner.
Figure 6.
RPCs protect RECs from activated T cell–induced apoptosis. Mouse RECs were cultured in wells of a 24-well plate (5 × 10⁵ per well), together with a culture insert containing 4 × 10⁶ of anti-CD3–activated T cells and different numbers of RPCs. RPCs cultured alone and cultured with quiescent T cells were included as controls. In 48 hours, apoptosis of the RECs was assessed by apoptosis detection kit staining. Representative results of two individual experiments are shown.
Hyperglycemia Impairs the T Cell Inhibitory Activity of RPCs
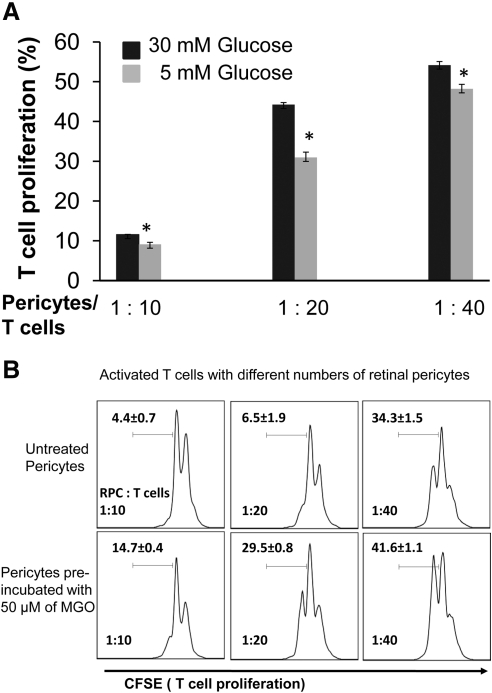
We finally tested whether hyperglycemia or glycating conditions could impair the T cell inhibitory activity of RPCs. We cultured RPCs in medium containing both low and high concentrations of glucose for 7 days (with daily medium changes), then assessed their efficacies in inhibiting T cell proliferation. These assays showed that high-glucose culturing conditions reduced the T cell inhibitory activity of RPCs by 20.9%, 30.2%, and 11.0% at ratios of 1:10, 1:20, and 1:40, respectively (Fig. 7A). We next pre-incubated RPCs with 50 μM MGO in complete media for 16 hours at 37°C, then repeated the T cell proliferation assays. These studies (Fig. 7B) showed that compared with 4.4%, 6.5%, and 22.5% proliferating T cells at different ratio settings, pre-incubating RPCs with 50 μM MGO resulted in 14.7%, 29.5%, and 41.6% of proliferating T cells. These data indicate that glycating conditions found in diabetic patients can significantly impair the T cell inhibitory activity of RPCs.
Figure 7.
Hyperglycemic conditions impair the efficacy of RPCs in inhibiting T cells. (A) RPCs were cultured in complete DMEM medium with low (5 mM) and high (30 mM) glucose for 7 days, with daily medium changes, and then tested in the CFSE-based T cell proliferation assays. (B) RPCs were pre-incubated with 50 μM MGO in complete DMEM medium for 16 hours and then tested in the same T cell proliferation assays. Results are representative from three independent experiments performed in duplicate. Data are mean value ± SD.
Discussion
Here we demonstrated, for the first time, that RPCs are highly immunosuppressive. RPCs inhibited T cell responses through both cell surface molecules including PD-L1, and through soluble factors including IL-10. RPCs protected RECs from inflammation-mediated attack, and hyperglycemic conditions significantly impaired the T cell inhibitory activity of RPCs.
The eye is an immunoprivileged organ. In addition to the physical blood–retinal barrier, there are other mechanisms by which ocular inflammation is controlled to preserve vision, which is usually vital for host survival. One of the mechanisms is that local retinal cells, including retinal pigmented epithelial cells (RPEs), are able to inhibit immune responses.19,20 The result that RPCs are highly immunosuppressive suggests that in addition to RPEs, RPCs could also contribute to the immunoprivileged status of the eye under normal conditions.
The loss of RPCs, which is the extreme of the loss of their function, is considered a hallmark of early-stage DR.4,21 Although pericytes have been shown to be critical in maintaining the integrity of blood vessels, the underlying mechanisms by which RPCs contribute to DR are poorly understood. Mounting evidence suggests that inflammation is integrally involved in the development of DR.10 The result that RPCs protect RECs from inflammation-induced apoptosis suggests a novel mechanism by which RPCs might preserve the retinal vasculature in DR. Hyperglycemic conditions in patients and animals contribute to the pathogenesis of DR; in addition, MGO formed under hyperglycemic conditions behaves as an advanced glycation end product (AGE) precursor, which forms adducts on proteins and inhibits normal protein functions. The results that MGO glycation or hyperglycemia impairs the immunosuppressive activity of RPCs suggest an association between the novel immunoregulatory role of RPCs and the development of DR. Based on these insights, we propose that under physiological conditions, RPCs inhibit immune responses by direct cell–cell contact and by releasing immunosuppressive factors including IL-10, which contribute to the immunoprivileged status of the eye. In diabetic patients, hyperglycemic conditions impair the immunosuppressive activity of RPCs, perhaps independent of RPC death, which contributes to chronic, undercontrolled inflammation in the retina and, eventually, the development of DR.
Acknowledgments
The authors thank Ram Nagaraj, Department of Ophthalmology, Case Western Reserve University for providing purified primary human RPC. The authors declare no potential conflicts of interest relevant to this article.
Footnotes
Supported in part by National Institutes of Health Grants EY020956 (FL), NS052471 (FL), and EY21357 (NS), and American Diabetes Association Research Award 1-10-BS-160 (NS).
Disclosure: Z. Tu, None; Y. Li, None; D.S. Smith, None; N. Sheibani, None; S. Huang, None; T. Kern, None; F. Lin, None
References
- 1. Darland DC, Massingham LJ, Smith SR, Piek E, Saint-Geniez M, D'Amore PA. Pericyte production of cell-associated VEGF is differentiation-dependent and is associated with endothelial survival. Dev Biol. 2003;264:275–288 [DOI] [PubMed] [Google Scholar]
- 2. Antonelli-Orlidge A, Saunders KB, Smith SR, D'Amore PA. An activated form of transforming growth factor beta is produced by cocultures of endothelial cells and pericytes. Proc Natl Acad Sci USA. 1989;86:4544–4548 [DOI] [PMC free article] [PubMed] [Google Scholar]
- 3. Sims DE. The pericyte—a review. Tissue Cell. 1986;18:153–174 [DOI] [PubMed] [Google Scholar]
- 4. Yafai Y, Iandiev I, Wiedemann P, Reichenbach A, Eichler W. Retinal endothelial angiogenic activity: effects of hypoxia and glial (Muller) cells. Microcirculation. 2004;11:577–586 [DOI] [PubMed] [Google Scholar]
- 5. Hellstrom M, Kalen M, Lindahl P, Abramsson A, Betsholtz C. Role of PDGF-B and PDGFR-beta in recruitment of vascular smooth muscle cells and pericytes during embryonic blood vessel formation in the mouse. Development. 1999;126:3047–3055 [DOI] [PubMed] [Google Scholar]
- 6. Lindahl P, Johansson BR, Leveen P, Betsholtz C. Pericyte loss and microaneurysm formation in PDGF-B-deficient mice. Science. 1997;277:242–245 [DOI] [PubMed] [Google Scholar]
- 7. Hammes HP, Lin J, Renner O, et al. Pericytes and the pathogenesis of diabetic retinopathy. Diabetes. 2002;51:3107–3112 [DOI] [PubMed] [Google Scholar]
- 8. Wellen KE, Hotamisligil GS. Inflammation, stress, and diabetes. J Clin Invest. 2005;115:1111–1119 [DOI] [PMC free article] [PubMed] [Google Scholar]
- 9. Antonetti DA, Barber AJ, Bronson SK, et al. Diabetic retinopathy: seeing beyond glucose-induced microvascular disease. Diabetes. 2006;55:2401–2411 [DOI] [PubMed] [Google Scholar]
- 10. Tang J, Kern TS. Inflammation in diabetic retinopathy. Prog Retin Eye Res. 2011;30:343–358 [DOI] [PMC free article] [PubMed] [Google Scholar]
- 11. Krady JK, Basu A, Allen CM, et al. Minocycline reduces proinflammatory cytokine expression, microglial activation, and caspase-3 activation in a rodent model of diabetic retinopathy. Diabetes. 2005;54:1559–1565 [DOI] [PubMed] [Google Scholar]
- 12. Abu el Asrar AM, Maimone D, Morse PH, Gregory S, Reder AT. Cytokines in the vitreous of patients with proliferative diabetic retinopathy. Am J Ophthalmol. 1992;114:731–736 [DOI] [PubMed] [Google Scholar]
- 13. Joussen AM, Poulaki V, Le ML, et al. A central role for inflammation in the pathogenesis of diabetic retinopathy. FASEB J. 2004;18:1450–1452 [DOI] [PubMed] [Google Scholar]
- 14. Schroder S, Palinski W, Schmid-Schonbein GW. Activated monocytes and granulocytes, capillary nonperfusion, and neovascularization in diabetic retinopathy. Am J Pathol. 1991;139:81–100 [PMC free article] [PubMed] [Google Scholar]
- 15. Scheef EA, Sorenson CM, Sheibani N. Attenuation of proliferation and migration of retinal pericytes in the absence of thrombospondin-1. Am J Physiol Cell Physiol. 2009;296:C724–C734 [DOI] [PMC free article] [PubMed] [Google Scholar]
- 16. Su X, Sorenson CM, Sheibani N. Isolation and characterization of murine retinal endothelial cells. Mol Vis. 2003;9:171–178 [PubMed] [Google Scholar]
- 17. Miller AG, Smith DG, Bhat M, Nagaraj RH. Glyoxalase I is critical for human retinal capillary pericyte survival under hyperglycemic conditions. J Biol Chem. 2006;281:11864–11871 [DOI] [PubMed] [Google Scholar]
- 18. Lalli PN, Strainic MG, Lin F, Medof ME, Heeger PS. Decay accelerating factor can control T cell differentiation into IFN-gamma-producing effector cells via regulating local C5a-induced IL-12 production. J Immunol. 2007;179:5793–5802 [DOI] [PMC free article] [PubMed] [Google Scholar]
- 19. Ke Y, Sun D, Jiang G, Kaplan HJ, Shao H. PD-L1(hi) retinal pigment epithelium (RPE) cells elicited by inflammatory cytokines induce regulatory activity in uveitogenic T cells. J Leukoc Biol. 2010;88:1241–1249 [DOI] [PMC free article] [PubMed] [Google Scholar]
- 20. Sugita S, Horie S, Yamada Y, Mochizuki M. Inhibition of B-cell activation by retinal pigment epithelium. Invest Ophthalmol Vis Sci 51:5783–5788 [DOI] [PubMed] [Google Scholar]
- 21. Cogan DG, Toussaint D, Kuwabara T. Retinal vascular patterns. IV. Diabetic retinopathy. Arch Ophthalmol. 1961;66:366–378 [DOI] [PubMed] [Google Scholar]


