Abstract
Background and the purpose of the study
Many factors have been reported that contribute to the wide intra- and inter-patient variability of Busulfan (Bu) disposition. The purpose of this study was to develop a population pharmacokinetic model and to determine the covariates affecting the pharmacokinetics (PK) of Bu in Iranian adult patients who received oral high-dose as a conditioning regimen before Hematopoietic Stem Cell Transplantation (HSCT).
Methods
A population PK analysis was performed in 30 patients who received an oral Bu and cyclophosphamide regimen before HSCT. Bu was given orally according to the protocol of the institution. In order to prevent seizures caused by Bu, phenytoin was administered orally one hour before each dose of Bu.A total of 180 blood samples were analyzed by HPLC and PK parameters were estimated by the non-linear mixed effect model by MONOLIX 3.1 program. A one-compartment model with an additive error model was used to describe the concentration-time profile of Bu.
Results
Patients’ disease and weight was found to be the determinant factors for clearance (CL) and the volume of distribution (Vd) according to Monolix analysis. The covariate entered in final model followed by these equations:
In this limited study, the age (15–43 years) had no significant effect. For a patient weighting 60 kg, the typical CL and Vd were estimated to be 13.4 l/hr and 42.6 L, respectively. The interindividual variability of CL and Vd were 13.6 and 6.3%, respectively. There was no significant metabolic induction in these four days as is evident by comparing the trough levels of Bu. However it should be mentioned that, one tailed t-test p-values of the days of two and three, two and four and three and four were 0.083, 0.069 and 0.388, respectively.
Major conclusions
Results of this study showed that the type of disease was a determinant of CL and the weight of patient was a determinant of Vd for Bu population PK parameters. A reliable PK parameters and Css, estimated from only one plasma concentrations (5 hrs after the first dose), were validated. Since these methods require few sampling and are easy to be used, the limited sampling methods might be advantageous in the routine clinical practice.
Keywords: MONOLIX, Phenytoin self-induction, TDM sampling, Hematopoietic stem cell transplantation.
INTRODUCTION
Busulfan (Bu), in combination with cyclo-phosphamide, is widely used in high doses as part of the myeloablative conditioning regimen prior to both allogeneic and autologous bone marrow transplantation (1). BU is mainly eliminated through the liver where it is converted into inactive metabolites by a glutathione-reductase-dependent mechanism involving glutathion-S-transferase enzymes (2). Renal elimination of Bu is limited and only 2% of the unchanged drug is excreted in urine (3). Similar to most alkylating agents, BU has a narrow therapeutic window. The dose-limiting toxicity of BU in Hematopoietic Stem Cell Transplantation (HSCT) regimens is hepatic Veno Occlusive Disease (VOD), a liver toxicity with an incidence varying from 0 in children with a genetic disease up to 50% in adults with hematological malignancies (4).
Population pharmacokinetic (PK) analysis is helpful to identify factors that affect PKs or to explain the variability of PKs in a target population (5, 6). Because Bu shows large individual variability in its PK in children, it would be useful to develop a population PK model that integrates the currently available data. Such a model may incorporate several factors that cause interindividual variability of PKs and should be useful as a tool to predict plasma concentration-time profiles for patients with different backgrounds. In the present study, a population PK model for oral Bu in adult Iranian patients was developed based on a large pool of data obtained during therapeutic drug monitoring.
Patients and methods
A total of 30 Iranian patients (21 male, 9 female), who underwent HSCT in the Hematology-Oncology and Bone Marrow Transplantation Research Center/Tehran University of Medical Sciences (Shariati hospital) between Dec 2007 and July 2008 entered the study. The patients were treated for acute myelogenous leukemia (6 patients), chronic myelogenous leukemia (4 patients), acute lymphocytic leukemia (15 patients) and non-malignant disorders (5 patients) with Bu in combination with one or two other chemotherapeutic agents (cyclophosphamide, melphalan, thiotepa, etoposide, fludarabine). The patients’ demographic data are given in table 1. Bu was given orally three times a day for 4 days according to the following protocol: in Thalassemia (3.5 mg/kg/day); Hematologic malignancies (4 mg/kg/day); Fanconi Anemia (1 mg/kg/day). It should be mentioned that, Bu was administered at 8 a.m., 16 p.m. and 21 p.m (not exactly every 8 hrs). In order to prevent seizure caused by high dose of Bu, phenytoin at the dose of 5 mg/kg/day was administered orally for seven days, from the day before starting of the administration of Bu.
Table 1.
Characteristics of 30 patient under study.
| Gender | |
|---|---|
| Male | 21 |
| Female | 9 |
| Age (year) | |
| Mean±SD | 26.2±8.1 |
| Minimum-maximum | 15–43 |
| Weight (kg) | |
| Mean±SD | 63.9±11.8 |
| Minimum-maximum | 22–80 |
| Dose (mg/day) | |
| Mean±SD | 233.80±64.22 |
| Minimum-maximum | 14–296 |
| Disease | |
| Malignant diseases | 25 |
| Other | 5 |
| Number of sampling | 240 |
SD, standard deviation; AST, aspartate aminotransferase;
Specimen collection and storage
Patient specimens were collected for analysis at the following times: 1, 3, 5, 24, 48, 72 and 75 hrs after the first dose of Bu. Plasma was separated immediately and frozen at −20°C until analysis.
Plasma Bu concentration measurement
Bu was analyzed by a minor modification in a reported method trough high performance liquid chromatography (HPLC) equipped with a fluorescence detector and derivatization using 2-naphthalenethiol (NAT) (7).
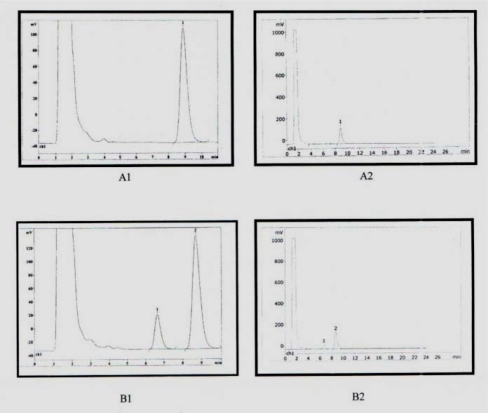
Plasma (1 ml) and 20 µl of an internal standard solution (bis [methanesulfonyloxy] pentane 1µg/ml) were pipetted into a tube and treated with 3 ml of dichloromethan. The mixture was vigorously shaken for 30 min and centrifuged at 4000×g for 15 min. The upper aqueous phase was discarded and the organic phase was evaporated. The residue was dissolved in 0.5 ml of acetone and 20 µl of NAT Solution (0.1 M) and treated with 25 µl of 0.1 NaOH and then the mixture was heated at 65°C for one hour. After cooling, 20 µl of the resulting solution was injected to the HPLC system which was a Choromolith PR-18e instrument equipped with fluorescence detector. The mobile phase consisted of methanol/water (87.5/12.5, v/v), with a flow rate of 1.5 ml/min and detector was operated at an excitation wavelength of 350 nm and emission wavelength of 430 nm. Under these conditions, the retention times of Bu and the internal standard were 6.6 and 8.6 minutes, respectively (Fig. 1).
Figure 1.
Chromatograms of A1 and A2 are for 1 µg/ml internal standard and B1 and B2 are plasma sample with 1 µg/ml internal standard and 400 ng/ml. Retention time for Bu and internal standard were 6.6 and 8.6 min respectively.
Calibration standards for Bu covering the range of 40–800 ng/ml were prepared in 1 ml of drug-free plasma and exposed to the above extraction and derivation procedure. The LOQ (Limit Of Quantification) of the method was 40 ng/ml and the LOD (Limit Of Detection) was 10 ng/ml. The calibration graph was obtained by plotting the peak-area ratio of the drug and internal standard versus the nominal concentration of Bu, (Y=0.0006x–0.0054 R2=0.9993). The accuracy and precision of the method of analysis is shown in table 2, the inter-day and intra-day coefficients of variation were below 10%.
Table 2.
Accuracy and precision of the method of analysis.
| Nominal Concentration (ng/ml) | Obtained concentration (mean±SD) | Accuracy (%) | Precision (%) |
|---|---|---|---|
| Intra-assay (n=5) | |||
| 40 | 45.00±3.46 | −12.50 | 7.68 |
| 160 | 159.33±0.75 | 0.42 | 0.47 |
| 400 | 427.67±2.17 | −6.92 | 0.51 |
| Inter-assay (n=3) | |||
| 40 | 46.33±1.15 | −15.83 | 2.49 |
| 160 | 161.55±3.03 | −0.97 | 1.87 |
| 400 | 426.11±2.14 | −6.53 | 0.50 |
Population pharmacokinetic statistic analysis
A population pharmacokinetic model was developed and fitted to the Bu concentration-time data by using MONOLIX (version 3.1). The minimum value of the objective function (MOF) was used to choose suitable models during the model-building process. Because of the difference in MOF between one model other models approximates, and χ2 distribution with the degree of freedom of the number of parameters, there were two parameters in the model-building process and6.63 for one degree of freedom difference in MOF (P<0.01) was considered statistically significant (8).
Base population pharmacokinetic model
One-compartment model with first-order elimination was used to describe the data. Both zero- and first-order absorption models with and without an absorption lag time were tested. A two-compartment model was also tested. The base pharmacokinetic parameters were CL/F (L/hr) and Vd/F (l). The inter-patient variability in the three fundamental PK Parameters (CL/F, Vd/F, and ka) were modeled with proportional error according to the equation: Pj = P'j (1+ ?j (where P'j represents the mean population parameters (CL/F, Vd/F, and ka), Pj represents the individual parameters for patients j, and ?j is an independently distributed random variable with mean zero and variance ω2.The residual variability was also modeled with additive error according to the following equation:Cij = Cmij + ɛij, where Cij is the measured plasma concentration collected at time i from patient j; Cmij is the corresponding predicted plasma concentration by the model and ɛij is the residual variability term, representing independent identically distributed statistical error with mean zero and variance σ2 for plasma concentrations.
Final pharmacokinetic model
The influences of the following covariates were investigated consecutively: age, weight, height, gender, BSA, Body Mass Index (BMI), serum Serum Aspartate Aminotransferase (AST) and the kind of disease (malignant or non-malignant).
To select the final model, the change in the minimum objective function (MOF) as a goodness of fit parameter was used, and the values before and after a covariate to the model were compared. A decrease in the MOF of more than 6.63 (log likelihood ratio test) was considered as a significant improvement to the model (P<0.01). In addition, improvement in the fit of the data was determined by the precision of the parameter estimates (standard errors) and by a visual inspection of plots of data against the population model and the individual predictions as well as plots of the data against the weighted residuals.
Sparse sampling strategy
Since rich sampling is not only a risk for the patient but also time- and money-consuming, a sparse sampling strategy was evaluated. The time point of 5 hours which was considered to cover the major part of the concentration-time profile after administration of the initial dose was used.
RESULTS
Base population pharmacokinetic model
One-compartment model was found to describe the concentration-time data adequately. A two-compartment model improved the fit of the data but gave unacceptable precision and inconsistencies in model parameters. The use of an absorption lag time or dependent absorption models did not increase the goodness-of-fit. Due to the lack of enough data in the absorption phase, absorption constant ka was fixed to 1.5 1/hr. Parameters of the base model are listed in Table 3.
Table 3.
Estimates for the base, and final model and their Relative Standard Errors (RSE).
| Parameter | Base model MOF=2764.06 Units [Estimate (RSE%)] | relative final model MOF=2756.64 Units [Estimate (RSE%)] |
|---|---|---|
| Pharmacokinetic parameters | ||
| CL (l/hr) | 13.9 (7.0) | 13.40 (6.0) |
| Vd (l) | 41.0 (6.3) | 42.60 (7.2) |
| Interpatient variability | ||
| ωCL (%) | 32.5 (16) | 18.2 (18) |
| ωVd (%) | 20.0 (34) | 15.8 (15) |
| Residual variability | ||
| σ2 (%) | 39 | 32.1 |
| Covariates | ||
| CLθDIS | 0.14(7.2) | |
| VdθWT | 0.01(29) | |
θ: Estimate of covariates
ω: inter patient variability
Final population pharmacokinetic model
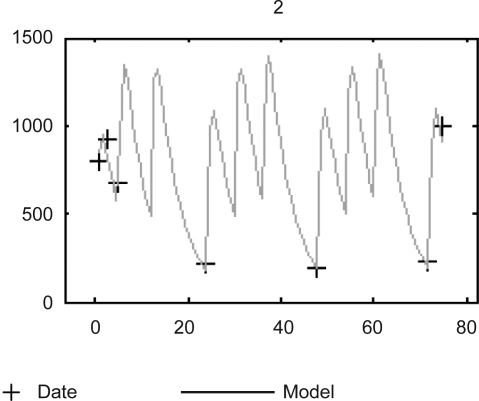
The final PK parameters were Cl/F =13.40 L/hr, and Vd/F = 42.60 L. The estimated population PK parameters of BU are shown in table 2. The inter-individual variabilities in C/L and Vd were 32.5 and 20.0, respectively; and the residual variability was 12.1% as the coefficient of variation. Plot of the observed Bu concentrations versus the concentrations predicted by the final models in a patient is shown in figure 2.
Figure 2.
Measured plasma concentrations data versus time. Individual model predictions (Model) of the final population model for one representative patient (ID 2).
The CL parameter was found to be significantly correlated with type of disease, whereas actual body weight was a covariate that influenced Vd of Bu.PK parameters were not found to be correlated to other covariates such as age, gender, BSA, BMI, and AST level. Population CL and Vd were described by the following equations in the final model:
These equations indicate that patients with malignant diseases have lower CL/F than others.
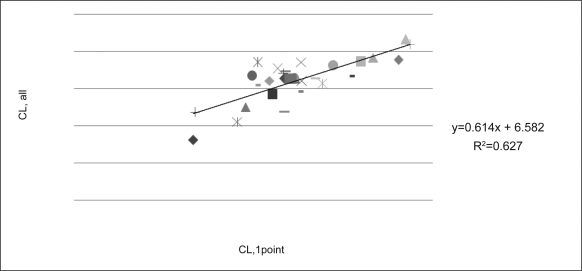
Even though the individual CL was estimated from all available samples, but the best result was with sample which obtained 5 hr after the initial dose in which CL was estimated 13.6 1/hr compared to 13.27.
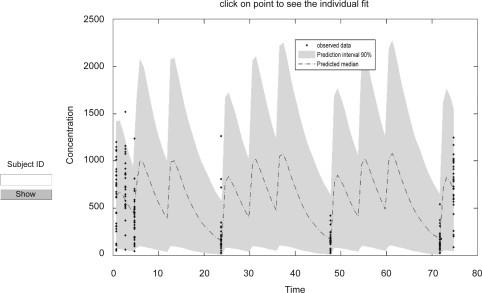
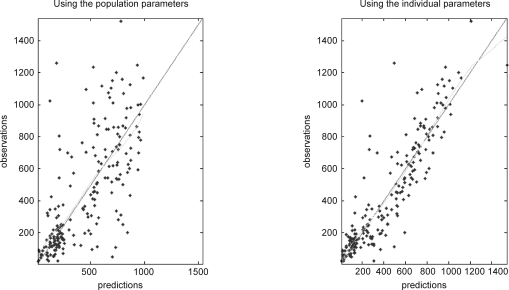
The correlations between the initial CL/F predicted from the one sample 5 hrs after the initial dose and CL/F of all samples are shown in figure 3. Finally the concentration-time profile in final model is shown in figure 4 and dosing scheme with unequal dose interval is demonstrated. Population model predicted vs. observed and individual model predicted vs. observed Bu concentration are shown in figure 5a, b.
Figure 3.
Predicted individual CL based on one-sample (5 hrs after the first dose, CL,1point) versus CL based on the full samples (CL, all).
Figure 4.
The concentration-time profile in final model.
Figure 5.
5a. Population model predicted vs. observed. 5b. Individual model predicted Bu concentration vs. observed.
Effect of phenytoin
To examine the role of phenytoin as potential inducers of liver enzymes, the values of Bu concentrations on days of 2, 3, and 4 were compared using the paired t- test. There were no statistically significant difference in the values of concentrations between day 2 and day 3(P=0.083), day 2 and day 4 (P=0.069), and day 3 and day 4 (P=0.388). In the patient group treated with phenytoin, model predicted concentrations are shown in table 4.
Table 4.
The values for Bu through concentrations at 24 hrs, 48 hrs and 72 hrs to determine the phenytoin induction effect at different time interval. One tailed t-test p-values of 24 hrs and 48 hrs, 24 hrs and 72 hrs and 48 hrs and 72 hrs were 0.083, 0.069 and 0.388, respectively.
| Concentration (ng/ml) | Mean±standard deviation |
|---|---|
| Conc. 24 hr (trough1) | 231±260.02 |
| Conc. 48 hr (trough2) | 169±92.19 |
| Conc. 72 hr (trough3) | 163±163.21 |
DISCUSSION
The Bu population analysis in Iranian adult patients was carried out, and the effect of covariates on PK parameters was investigated. The type of disease and the weight were determinants of CL and Vd respectively. Malignant disorders were a negative influencing factor for CL/F when compared with an inherited disorder. It has been demonstrated that CL/F is approximately 42% higher in children with inherited disorders as compared with those with leukemia (9). Also, malignant diseases were found to be a negative influencing factor for CL/F in another study (10). Since patients with malignant diseases usually receive chemotherapy before transplantation; the physical status of the patients is likely to be weakened by previous chemotherapy. Important factors were the severity of chemotherapy and/or the grade of liver function damage (10).Phenytoin is an inducer of CYP 3A4, a major isoenzyme of the CYP 450 system that is responsible for the biotransformation of Bu to an inactive metabolite (11). phenytoin increases the clearance of Bu by 15% or higher, possibly due to the induction of glutathione-S-transferase (12). In the present study, all patients received phenytoin as seizure prophylaxis and therefore comparative analysis was impossible but there were no statistically significant differences in Bu concentration value between days of 2 and 3, days of 2 and 4 and days of 3 and 4 in patients treated with phenytoin. This result is similar to the study of Embree et al (14) but inconsistent with two other studies that showed phenytoin rapidly induced the activity of the CYP3A family of isoenzymes, and its effects appeared within 48 hrs after the initiation of phenytoin therapy where there was a significantly higher clearance, a lower area under the concentration-time curve, and a shorter elimination half-life for the last dose of Bu as compared with the first dose (13–15). It seems another anticonvulsant drug with fewer enzyme inductive properties may be more appropriate for these incongruous results.
In this study, it was found that CL/F was not affected by either age or AST in adult patients aged from 15 to 43 years; whereas in another study, the population pharmacokinetics in young Japanese children aged from 2 months to 11 years showed that oral Bu clearance was correlated with age as well as with serum AST (10). Clearance is lower at early infancy, and then increases to a maximum at approximately 2 years of age, and decreases thereafter. Since rich sampling is not only a risk for the patient but also time- and money-consuming, a limited sampling strategy using Bayesian methodology was developed. Sandstrom et al. have reported that the time points of 2, 4 and 5 hrs after the administration of the initial dose of Bu were chosen as limited sampling (15). Takamatsu suggested a test dose with five blood samples in their studies (16). In this study, reliable PK parameters and Css estimated from one plasma concentration (5 hrs after the first dose) were validated. Using this method requires few samples and is easy to use, so the limited sampling methods are attractive in the routine clinical practice.
ACKNOWLEDGMENTS
We acknowledge the personnel of Shariati Hospital BMT ward-1 for their contributions to this study. The research was conducted in Hematology-Oncology and SCT Research Center/Tehran University of Medical Sciences, Tehran, Iran. This institution also granted it.
REFERENCES
- 1.Copelan EA, Biggs JC, Thompson JM, Crilley P, Szer J, Klein JP, Kapoor N, BR Avalos BR, Cunningham I, Atkinson K. Treatment for acute myelocytic leukemia with allogeneic bone marrow transplantation following preparation with BuCy2. Blood. 1991;78:838–843. [PubMed] [Google Scholar]
- 2.Czerwinsky M, Gibbs JP, Slattery JT. Busulfan conjugation by glutathione S-transferases alpha, mu, and pi. Drug Metab Dispos. 1996;24:1015–1019. [PubMed] [Google Scholar]
- 3.Hassan M, Oberg G, Ehrsson H, Ehrnebo M, Wallin I, Smedmyr B, Tötterman T, Eksborg S, Simonsson B. Pharmacokinetic and metabolic studies of high-dose busulphan in adults. Eur J Clin Pharmacol. 1989;36:520–530. doi: 10.1007/BF00558081. [DOI] [PubMed] [Google Scholar]
- 4.McDonald GB, Hinds MS, Fisher LD, Schoch HG, Wolford JL, Banaji M, Hardin BJ, Shulman HM, Clift RA. Venoocclusive disease of the liver and multiorgan failure after bone marrow transplantation: a cohort study of 355 patients. Ann Intern Med. 1993;118:255–267. doi: 10.7326/0003-4819-118-4-199302150-00003. [DOI] [PubMed] [Google Scholar]
- 5.Takama H, Tanaka H, Nakashima D, Ueda R, Takaue Y. Population pharmacokinetics of intravenous busulfan in patients undergoing hematopoietic stem cell transplantation. Bone Marrow Transplantation. 2006;37:345–351. doi: 10.1038/sj.bmt.1705252. [DOI] [PubMed] [Google Scholar]
- 6.Nguyen L, Leger F, Lennon S, Puozzo C. Intravenous busulfan in adults prior to haematopoietic stem cell transplantation: a population pharmacokinetic study. Cancer Chemother Pharmacol. 2006;57:191–198. doi: 10.1007/s00280-005-0029-0. [DOI] [PubMed] [Google Scholar]
- 7.Hara S, Tsuchie M, Tsujioka R, Kimura M, Fuji M, Kuroda T, Ono N. High-performance liquid chromatographic quantification of busulfan in human serum after fluorescence derivatization by 2-naphthalenethiol. Anal Science. 2000;16:287–291. [Google Scholar]
- 8.Johnsson EN, Karlsson MO. Xpose-an S-PLUS based population pharmacokinetic-pharmacodynamic model building aid for NONMEM. Comp Meth Prog Biomed. 1999;58:51–64. doi: 10.1016/s0169-2607(98)00067-4. [DOI] [PubMed] [Google Scholar]
- 9.Hassan M, Oberg G, Bjorkholm M, Wallin I, Lindgren M. Influence of prophylactic anticonvulsant therapy on high-dose busulphan kinetics. Cancer Chemother Pharmacol. 1993;33:181–186. doi: 10.1007/BF00686213. [DOI] [PubMed] [Google Scholar]
- 10.Nakamura H, Sato T, Okada K, Miura G, Ariyoshi N, Nakazawa K, Kitada M. Population pharmacokinetics of oral busulfan in young Japanese children before hematopoietic stem cell transplantation. Ther Drug Monit. 2008;30:75–83. doi: 10.1097/FTD.0b013e3181621cde. [DOI] [PubMed] [Google Scholar]
- 11.Chan KW, Mullen CA, Worth LL, Choroszy M, Koontz S, Tran H, Slopis J. Lorazepam for seizure prophylaxis during high-dose busulfan. Bone Marrow Transplantation. 2002;29:963–965. doi: 10.1038/sj.bmt.1703593. [DOI] [PubMed] [Google Scholar]
- 12.Eberly A, Anderson GD, Bubalo S, J, McCune J. Optimal Prevention of Seizures Induced by High- Dose Busulfan. Pharmacotherapy. 2008;28:1502–1510. doi: 10.1592/phco.28.12.1502. [DOI] [PubMed] [Google Scholar]
- 13.Fleishaker CJ, Pearson KL, Gary R. Phenytoin causes a rapid increase in 6β-hydroxycortisol urinary excretion in humans-a putative measure of CYP3A induction. Journal of Pharmaceutical Sciences. 1995;84:292–294. doi: 10.1002/jps.2600840305. [DOI] [PubMed] [Google Scholar]
- 14.Embree L, Heggie JR, Knight G. Effect of phenytoin on busulfan pharmacokinetics. Pharm Res. 1997;50:191–198. [Google Scholar]
- 15.Sandstrom M, Karlsson MO, Ljungman P, Hassan Z, Jonsson EN, Nilsson C, Ringden O, Oberg G, Bekassy A, Hassan M. Population pharmacokinetic analysis resulting in a tool for dose individualization of busulphan in bone marrow transplantation recipients. Bone Marrow Transplantation. 2001;28:657–664. doi: 10.1038/sj.bmt.1703229. [DOI] [PubMed] [Google Scholar]
- 16.Takamatsu Y, Sasaki N, Ogata K, Yukawa E, Jimi S, Hara S, Tamura K. Population pharmacokinetic study of a test dose oral busulfan in Japanese adult patients undergoing hematopoietic stem cell transplantation. Cancer Chemother Pharmacol. 2010;65:1203–7. doi: 10.1007/s00280-010-1263-7. [DOI] [PubMed] [Google Scholar]


