A C2 protein from A. thaliana has been crystallized by the hanging-drop vapour-diffusion method and a native data set has been collected at 2.4 Å resolution.
Keywords: C2 proteins, At3g17980, Arabidopsis thaliana
Abstract
An uncharacterized protein from Arabidopsis thaliana consisting of a single C2 domain (At3g17980) was cloned into the pETM11 vector and expressed in Escherichia coli, allowing purification to homogeneity in a single chromatographic step. Good-quality diffracting crystals were obtained using vapour-diffusion techniques. The crystals diffracted to 2.2 Å resolution and belonged to space group P212121, with unit-cell parameters a = 35.3, b = 88.9, c = 110.6 Å. A promising molecular-replacement solution has been found using the structure of the C2 domain of Munc13-C2b (PDB entry 3kwt) as the search model.
1. Introduction
Calcium plays a central role as a second messenger for many extracellular stimuli in plants (Kudla et al., 2010 ▶; White & Broadley, 2003 ▶). It is involved in interpreting many environmental signals such as light, salinity, drought, cold, oxidative stress, anoxia and mechanical perturbation (Poovaiah & Reddy, 1987 ▶; Trewavas & Malhó, 1998 ▶; Bush, 1993 ▶). These stimuli cause a change in the calcium concentration in the cytosol, which is modulated in time and space to produce the so-called ‘calcium signature’ (Webb et al., 1996 ▶). Calcium sensors are calcium-binding proteins that decode this information and activate the appropriate cell response. Thus, the identification and characterization of these domains is crucial in order to understand and ultimately to control the plant cell response to our benefit.
The C2 domain and the EF-hand motif of the calmodulin superfamily are the two most frequently occurring calcium sensors. In the Arabidopsis thaliana genome there are at least 101 and 131 proteins that contain C2 domains and EF-hand motifs, respectively (see http://smart.emblheidelberg.de/). Among the proteins within the EF-hand group, SCaBPs/CBLs (Guo et al., 2001 ▶; Luan et al., 2002 ▶) have been proposed to decode specific calcium signals triggered by a number of extracellular abiotic stress stimuli (Harmon et al., 2000 ▶; Scrase-Field & Knight, 2003 ▶; Sánchez-Barrena et al., 2005 ▶). Among the proteins belonging to the C2 group, the plant synaptotagmin C2 domains participate in the calcium-dependent repair of membranes after a plasma-membrane injury (Schapire et al., 2009 ▶). However, many of the proteins that contain a C2 domain fall into the categories of uncharacterized or uncharacterized putative proteins.
The C2 domains act as calcium-activated modules that are related to membrane-protein targeting and/or vesicle transport. They consist of approximately 130 amino acids that fold as an eight-stranded β-sandwich. Their three-dimensional structure is extremely well conserved despite the low sequence similarity among the members of the family (Shao et al., 1996 ▶; Sutton & Sprang, 1998 ▶; Verdaguer et al., 1999 ▶; Corbalán-García & Gómez-Fernández, 2006 ▶) and they display two lipid-binding sites. The first is placed at the loops connecting the strands of the β-sandwich and is calcium-dependent. The second is located on a concave surface of the domain and its lipid-binding properties are calcium-independent. These different lipid preferences determine their subcellular distributions, and their occupancies determine the orientation of the C2 domain with respect to the membrane (Ausili et al., 2011 ▶).
In this work, we describe the cloning, expression, purification, crystallization and preliminary diffraction data of a previously uncharacterized C2 domain from A. thaliana (At3g17980, AtC2). Interestingly, AtC2 constitutes a single protein in itself; thus, it is expected to display a protein-binding site in addition to the functional lipid-binding sites. We have found that homologous C2 domains can be used as search models for molecular replacement. However, the electron-density maps computed after the first stages of refinement were strongly biased, indicating significant structural differences between AtC2 and these structures. Comparison of the structure of AtC2 with these previously determined C2 domains would be of biological significance in understanding the mechanism of calcium-mediated protein targeting based on intermolecular interactions.
2. Experimental
2.1. Protein expression and purification
The ORF of At3g17980 was amplified by PCR using the clone U89555 (provided by the Arabidopsis Biological Resource Center, Ohio, USA) as template and the following primer pairs: forward, 5′-ACCATGGCAACGGCGTGTCCGGCG-3′, and reverse, 5′-TCATAGACCCTTGGAGCCAGGGA-3′. Subsequently, it was cloned into pCR8/GW/TOPO, excised from this vector using a double NcoI–EcoRI digestion and cloned into pETM11 (EMBL) containing an N-terminal histidine (His) tag linked by a TEV protease site. The full-length At3g17980 cloned into pETM11 was overexpressed in Escherichia coli BL21 (DE3) cells (Stratagene). A single colony was used to inoculate an overnight culture of 30 ml Luria–Bertani (LB) medium containing 35 mg ml−1 kanamycin. 10 ml of the overnight culture was added to a larger volume (800 ml) of 2TY medium (16 g Bacto Tryptone, 10 g yeast extract and 5 g NaCl per litre of solution) supplemented with 35 mg ml−1 kanamycin. The cells were grown at 310 K until an OD600nm of approximately 0.5 was reached. At this point, the temperature was reduced to 291 K and AtC2 protein expression was induced by the addition of isopropyl β-d-1-thiogalactopyranoside (IPTG) to a final concentration of 0.3 mM and left overnight in the shaker incubator. The cells were then harvested by centrifugation and the pellet was resuspended in lysis buffer [20 mM Tris–HCl pH 8.5, 200 mM NaCl, 50 mM imidazole, 1 mM CaCl2, 1%(v/v) glycerol] supplemented with one tablet of Complete EDTA-free Protease Inhibitor cocktail (Roche) per 50 ml. The cells were lysed by sonication on ice for 10 min and the cell lysate was then centrifuged at 17 500g for 45 min. Purification of the AtC2 protein was carried out on a low-pressure system (Lp BioLogic, Bio-Rad) using immobilized nickel-affinity chromatography. The crude extract was filtered (pore diameter 0.45 µm, PALL Acrodisc Syringe Filter) and loaded onto a 5 ml HisTrap FF column (GE Healthcare) pre-equilibrated in lysis buffer. A 50 ml wash step was performed using the same buffer. AtC2 protein was then eluted with a buffer consisting of 20 mM Tris–HCl pH 8.5, 200 mM NaCl, 500 mM imidazole, 1 mM CaCl2, 1%(v/v) glycerol. The eluted fractions enriched in AtC2 protein were pooled and the elution buffer was changed using a PD-10 (GE Healthcare) desalting column previously equilibrated with a buffer composed of 20 mM Tris–HCl pH 8.5, 200 mM NaCl, 0.1 mM CaCl2. The stock protein was concentrated to 8.0 mg ml−1 using an Amicon Ultra centrifugal filter device (Millipore, Bedford) with a 10 kDa molecular-weight cutoff.
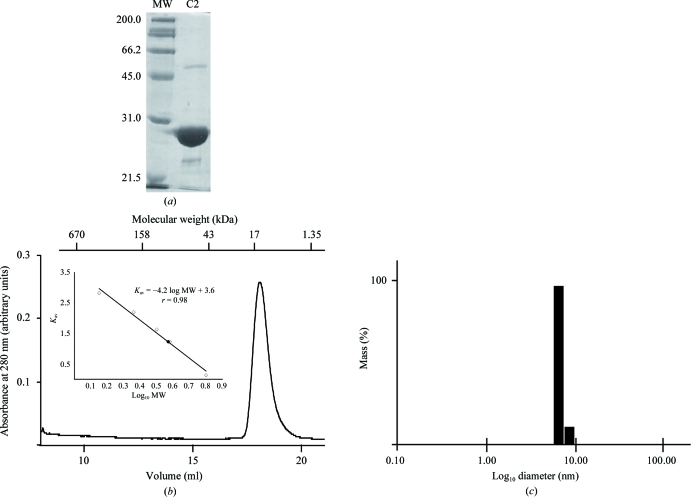
The protein purity was assayed by SDS–PAGE (Fig. 1 ▶ a) and the homogeneity of the sample was verified by gel-filtration (GF) chromatography and dynamic light scattering (DLS). The GF chromatography was carried out on a HiLoad 26/60 Superdex 200 column (GE Healthcare) previously equilibrated with buffer consisting of 20 mM Tris–HCl pH 8.5, 100 mM NaCl, 0.1 mM CaCl2 (Fig. 1 ▶ b). The DLS was performed with a DynaPro Titan Instrument (Wyatt Technology Co.) to measure the hydrodynamic radius and polydispersity of the sample according to the user manual (Fig. 1 ▶ c).
Figure 1.
(a) SDS–PAGE analysis of purified His-fused AtC2 from A. thaliana. The positions of the molecular-weight markers (BioRad Laboratories Inc.) are indicated in kDa. Gels were stained using Coomassie Brilliant Blue. (b) AtC2 size-exclusion chromatography. The lines show the absorbance recorded at 280 nm. Molecular-weight markers (BioRad) are indicated in kDa. The inset corresponds to K versus log(MW). The elution position (V e), column void volume (V 0) and the bed volume of the column (V t) were used to calculate K, which is defined as [(V e − V 0)/(V t − V 0)]. The elution position of recombinant AtC2 is indicated by a black triangle. (c) Monodisperity pattern obtained by dynamic light scattering (DLS) of purified AtC2.
The protein concentration was determined by UV absorption at 280 nm using a NanoDrop spectrophotometer (Innovadyne Technologies Inc.) based on the theoretically calculated absorption molar coefficient of 24 075 M −1 cm−1.
2.2. Crystallization
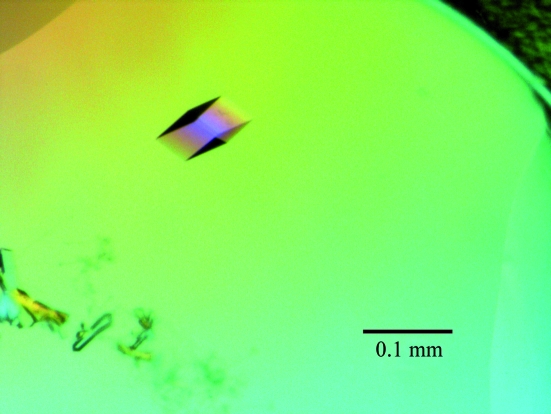
The initial crystallization assays were performed using Crystal Screen 1, Crystal Screen 2, Index and SaltRx from Hampton Research and the PACT Suite and JCSG+ Suite from Qiagen. The experiments were carried out using a NanoDrop robot (Innovadyne Technologies Inc.) by the sitting-drop vapour-diffusion method at 291 K. The drops consisted of 0.5 µl protein solution mixed with 0.5 µl precipitant solution and were equilibrated against 65 µl well solution. Small twinned crystals grew in 24 h in several conditions from the PACT Suite (20% PEG 3350 or 25% PEG 1500, pH 6–7). However, larger prismatic crystals (0.05 mm in the longest dimension) appeared in some of these conditions in two or three weeks. The best diffracting crystals were grown in 0.01 M ZnCl2, 0.1 M HEPES pH 7, 20%(w/v) PEG 3350 (condition No. 36 of the PACT Suite; Fig. 2 ▶)
Figure 2.
AtC2 crystals grown in 0.01 M ZnCl2, 0.1 M HEPES pH 7.0, 20%(w/v) PEG 3350 by the vapour-diffusion method.
The crystals were mounted in a fibre loop, soaked in cryoprotectant consisting of mother liquor containing 20%(w/v) PEG 400 for a few seconds and flash-cooled in liquid nitrogen at 100 K.
2.3. X-ray data collection and processing
Diffraction data were collected using synchrotron radiation on the ID29 beamline at the ESRF, Grenoble, France. The space group was determined to be P212121, with unit-cell parameters a = 35.3, b = 88.9, c = 110.6 Å. All diffraction images were processed using the XDS package (Kabsch, 2010 ▶) and scaled with SCALA from the CCP4 package (Winn et al., 2011 ▶). Data-collection and processing statistics are summarized in Table 1 ▶.
Table 1. Diffraction protocol and data-collection statistics for the AtC2 crystals.
Values in parentheses are for the highest resolution shell.
| Crystal data | |
| Space group | P212121 [No. 19] |
| Unit-cell parameters (Å, °) | a = 35.3, b = 88.9, c = 110.6, α = β = γ = 90.0 |
| Z | 2 |
| VM (Å3 Da−1) | 2.4 |
| Solvent content (%) | 35 |
| Molecules in the asymmetric unit | 2 |
| Diffraction protocol | |
| Radiation source | ID29, ESRF, Grenoble, France |
| Wavelength (Å) | 0.9599 |
| Detector type | PILATUS 6M |
| Crystal-to-detector distance (mm) | 394.180 |
| Temperature (K) | 100 |
| Data-collection statistics | |
| Resolution range (Å) | 46.95–2.40 (2.53–2.40) |
| No. of measured/unique reflections | 166694/14300 |
| Completeness (%) | 100.000 |
| Multiplicity | 11.700 |
| 〈I/σ(I)〉 | 13.3 (5.9) |
| Rmerge | 0.138 (0.500) |
| Rsym† | 0.131 (0.485) |
| Rp.i.m.‡ | 0.041 (0.144) |
R
sym(I) = 
 , where Ii(hkl) is the ith observed amplitude of reflection hkl and 〈I(hkl)〉 is the mean amplitude of the measurements of reflection hkl.
R p.i.m. is the precision-indicating (multiplicity-weighted) R merge (Weiss, 2001 ▶).
3. Results and discussion
In this paper, we report the expression, purification and crystallization of recombinant AtC2 protein from A. thaliana. The purification included a single affinity-chromatography step and the sample purity was at least 95% as monitored by SDS–PAGE (Fig. 1 ▶ a). The protein migrated on the SDS–PAGE gel between 21.5 and 31 kDa; the calculated molecular weight of the His-AtC2 protein is 23.0 kDa.
Prior to crystallization, a GF chromatography step and DLS were used to evaluate the aggregation state and polydispersity of the sample. Both GF and DLS showed that AtC2 appeared to be at least 95% pure and free of aggregates. DLS analysis corresponded to a well behaved monodisperse solution with a hydrodynamic radius of 2.9 nm, compatible with a dimer in solution. In contrast, AtC2 migrated with a calculated molecular weight of around 17 kDa in the GF chromatography. This may be a consequence of some specific interaction of AtC2 with the Superdex 200 bead material. Alternatively, it could be the consequence of a mixture of different effects including the protein concentration, since the sample used for GF chromatography was approximately ten times more concentrated than the sample used for DLS.
Crystals suitable for diffraction experiments were obtained in two weeks using the sitting-drop vapour-diffusion method at 291 K by mixing 0.5 µl protein solution and 0.5 µl reservoir solution and equilibrating against 65 µl reservoir solution. This consisted of 0.01 M ZnCl2, 0.1 M HEPES pH 7, 20%(w/v) PEG 3350.
The crystals displayed good-quality diffraction patterns, diffracted to 2.4 Å resolution and belonged to the orthorhombic space group P212121, with unit-cell parameters a = 35.28, b = 88.92, c = 110.6 Å.
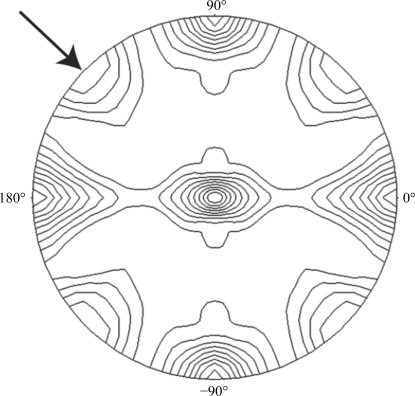
Specific volume calculations (Matthews, 1968 ▶; Kantardjieff & Rupp, 2003 ▶) predicted two molecules of AtC2 in the asymmetric unit, with V M = 1.89 Å3 Da−1 and an estimated solvent content of 35%. We investigated the local symmetry relating the units in the asymmetric unit using the CCP4 package program POLARRFN (Kabsch, 2010 ▶). Several self-rotation functions were computed in the resolution range 15–3.5 Å, with Patterson vectors from 15 to 20 Å radius of integration. Analysis of self-rotation peaks revealed the presence of twofold noncrystallographic symmetry, supporting the presence of two identical copies of AtC2 in the asymmetric unit (Fig. 3 ▶).
Figure 3.
Plot of the self-rotation function of an AtC2 crystal using data between 15.0–4.0 Å resolution and a 15.0 Å radius of integration in the κ = 180° section. The view is down the b axis. The highlighted peak shows a noncrystallographic twofold axis perpendicular to the crystallographic b axis.
A promising molecular-replacement solution (MOLREP; Vagin & Teplyakov, 2010 ▶) was found using the BALBES server (Long et al., 2008 ▶) with the structure of the C2 domain of Munc13-C2b (PDB entry 3kwt; Shin et al., 2010 ▶) as the search model. As expected, the solution included two molecules in the asymmetric unit. However, the electron-density map computed with this model was strongly biased. The sequence identity of the search model (39% for 55 amino acids as calculated using BLAST; Altschul et al., 1990 ▶) may explain this result. Structure refinement is in progress and will be published elsewhere.
Acknowledgments
The authors thank the ESRF for access to the synchrotron-radiation source, Dr David Flot, the local contact at beamline ID29, and Cesar Carrasco for help in collecting the data. This work was funded by grants BFU2008-00368/BMC, BFU2011-25384 and CSD2006-00015 (Factoría de Cristalización) of the Spanish ‘Plan Nacional’ (MICINN) to AA. MD was supported by fellowship SENACYT-IFARHU of Panama–‘Programa de Investigadores’.
References
- Altschul, S. F., Gish, W., Miller, W., Myers, E. W. & Lipman, D. J. (1990). J. Mol. Biol. 215, 403–410. [DOI] [PubMed]
- Ausili, A., Corbalán-García, S., Gómez-Fernández, J. C. & Marsh, D. (2011). Biochim. Biophys. Acta, 1808, 684–695. [DOI] [PubMed]
- Bush, D. S. (1993). Plant Physiol. 103, 7–13. [DOI] [PMC free article] [PubMed]
- Corbalán-García, S. & Gómez-Fernández, J. C. (2006). Biochim. Biophys. Acta, 1761, 633–654. [DOI] [PubMed]
- Guo, Y., Halfter, U., Ishitani, M. & Zhu, J.-K. (2001). Plant Cell, 13, 1383–1400. [DOI] [PMC free article] [PubMed]
- Harmon, A. C., Gribskov, M. & Harper, J. F. (2000). Trends Plant Sci. 5, 154–159. [DOI] [PubMed]
- Kabsch, W. (2010). Acta Cryst. D66, 125–132. [DOI] [PMC free article] [PubMed]
- Kantardjieff, K. A. & Rupp, B. (2003). Protein Sci. 12, 1865–1871. [DOI] [PMC free article] [PubMed]
- Kudla, J., Batistic, O. & Hashimoto, K. (2010). Plant Cell, 22, 541–563. [DOI] [PMC free article] [PubMed]
- Long, F., Vagin, A. A., Young, P. & Murshudov, G. N. (2008). Acta Cryst. D64, 125–132. [DOI] [PMC free article] [PubMed]
- Luan, S., Kudla, J., Rodriguez-Concepcion, M., Yalovsky, S. & Gruissem, W. (2002). Plant Cell, 14, S389–S400. [DOI] [PMC free article] [PubMed]
- Matthews, B. W. (1968). J. Mol. Biol. 33, 491–497. [DOI] [PubMed]
- Poovaiah, B. W. & Reddy, A. S. (1987). Crit. Rev. Plant Sci. 6, 47–103. [DOI] [PubMed]
- Sánchez-Barrena, M. J., Martínez-Ripoll, M., Zhu, J.-K. & Albert, A. (2005). J. Mol. Biol. 345, 1253–1264. [DOI] [PubMed]
- Schapire, A. L., Valpuesta, V. & Botella, M. A. (2009). Trends Plant Sci. 14, 645–652. [DOI] [PubMed]
- Scrase-Field, S. A. & Knight, M. R. (2003). Curr. Opin. Plant Biol. 6, 500–506. [DOI] [PubMed]
- Shao, X., Davletov, B. A., Sutton, R. B., Südhof, T. C. & Rizo, J. (1996). Science, 273, 248–251. [DOI] [PubMed]
- Shin, O.-H., Lu, J., Rhee, J.-S., Tomchick, D. R., Pang, Z. P., Wojcik, S. M., Camacho-Perez, M., Brose, N., Machius, M., Rizo, J., Rosenmund, C. & Sudhof, T. C. (2010). Nature Struct. Mol. Biol. 17, 280–288. [DOI] [PMC free article] [PubMed]
- Sutton, R. B. & Sprang, S. R. (1998). Structure, 6, 1395–1405. [DOI] [PubMed]
- Trewavas, A. J. & Malhó, R. (1998). Curr. Opin. Plant Biol. 1, 428–433. [DOI] [PubMed]
- Vagin, A. & Teplyakov, A. (2010). Acta Cryst. D66, 22–25. [DOI] [PubMed]
- Verdaguer, N., Corbalan-Garcia, S., Ochoa, W. F., Fita, I. & Gómez-Fernández, J. C. (1999). EMBO J. 18, 6329–6338. [DOI] [PMC free article] [PubMed]
- Webb, A. A. R., McAinsh, M. R., Taylor, J. E. & Hetherington, A. M. (1996). Adv. Bot. Res. 22, 45–96.
- Weiss, M. S. (2001). J. Appl. Cryst. 34, 130–135.
- White, P. J. & Broadley, M. R. (2003). Ann. Bot. 92, 487–511. [DOI] [PMC free article] [PubMed]
- Winn, M. D. et al. (2011). Acta Cryst. D67, 235–242.


