Acetate kinase from S. typhimurium was crystallized in two crystal forms that diffracted to 2.70 Å (form I) and 1.90 Å (form II) resolution.
Keywords: Salmonella typhimurium, short-chain fatty acids, tricarboxylic/citric acid cycle, acetate metabolism, acetate kinase, conformational changes
Abstract
Acetate kinase (AckA) catalyzes the reversible transfer of a phosphate group from acetyl phosphate to ADP, generating acetate and ATP, and plays a central role in carbon metabolism. In the present work, the gene corresponding to AckA from Salmonella typhimurium (StAckA) was cloned in the IPTG-inducible pRSET C vector, resulting in the attachment of a hexahistidine tag to the N-terminus of the expressed enzyme. The recombinant protein was overexpressed, purified and crystallized in two different crystal forms using the microbatch-under-oil method. Form I crystals diffracted to 2.70 Å resolution when examined using X-rays from a rotating-anode X-ray generator and belonged to the monoclinic space group C2, with unit-cell parameters a = 283.16, b = 62.17, c = 91.69 Å, β = 93.57°. Form II crystals, which diffracted to a higher resolution of 2.35 Å on the rotating-anode X-ray generator and to 1.90 Å on beamline BM14 of the ESRF, Grenoble, also belonged to space group C2 but with smaller unit-cell parameters (a = 151.01, b = 78.50, c = 97.48 Å, β = 116.37°). Calculation of Matthews coefficients for the two crystal forms suggested the presence of four and two protomers of StAckA in the asymmetric units of forms I and II, respectively. Initial phases for the form I diffraction data were obtained by molecular replacement using the coordinates of Thermotoga maritima AckA (TmAckA) as the search model. The form II structure was phased using a monomer of form I as the phasing model. Inspection of the initial electron-density maps suggests dramatic conformational differences between residues 230 and 300 of the two crystal forms and warrants further investigation.
1. Introduction
The human gastrointestinal tract provides a natural environment for a large and diverse community of microbes which carry out degradation of complex metabolites that cannot be normally digested by the host (Cummings & Macfarlane, 1991 ▶; Miller & Wolin, 1979 ▶). The majority of the microbes in the human gut are anaerobic bacteria, which generate short-chain fatty acids (SCFAs; chain length of up to six C atoms) as metabolic byproducts of fermentation (Cummings & Macfarlane, 1991 ▶). SCFAs have been shown to inhibit bacterial growth and thus can increase host resistance towards these organisms (Barnes et al., 1979 ▶; Bohnhoff & Miller, 1962 ▶; Cherrington et al., 1991 ▶). However, studies on many aerobic bacteria, fungi and anaerobic bacteria such as Escherichia coli and Salmonella typhimurium have shown that these organisms possess pathways for the utilization of SCFAs as a source of carbon and energy (Cummings et al., 1987 ▶; Klein et al., 1971 ▶). The pathways that enable microorganisms to catabolize SCFAs are essential for preventing toxic effects of these compounds on microbes and for increasing their virulence against the host (Rishi et al., 2005 ▶).
The degradation of SCFAs is initiated by their conversion to the corresponding activated SCF acyl-CoA derivatives (Nunn, 1986 ▶). Acetate can enter into multiple metabolic pathways after its conversion to acetyl-CoA. Its entry into the tricarboxylic/citric acid (TCA) cycle leads to the generation of ATP and NADH. Acetyl-CoA is also a precursor for the synthesis of various biomolecules (Nunn, 1986 ▶). In S. typhimurium and E. coli acetate can be converted to acetyl-CoA by reversible tandem reactions catalyzed by acetate kinase (AckA; EC 2.7.2.1) and phosphotransacetylase (Pta; EC 2.3.1.8) (Wolfe, 2005 ▶). AckA catalyzes the reversible transfer of a phosphate group from acetyl phosphate to ADP, generating acetate and ATP, in the presence of a metal ion, while Pta catalyzes the reversible transfer of an acetyl group from acetyl-CoA to a phosphate, resulting in the formation of acetyl phosphate (Fig. 1 ▶).
Figure 1.
Reactions catalyzed by AckA and Pta.
Biochemical reactions involving the transfer of a phosphate group to an acceptor ligand, similar to the AckA reaction (Fig. 1 ▶), are responsible for several indispensable cellular functions such as signal transduction and regulation of cell division (Das et al., 1997 ▶). Although extensive biochemical studies have been carried out on AckA (Fox & Roseman, 1986 ▶; Wanner & Wilmes-Riesenberg, 1992 ▶), the structure of the enzyme (from the thermophilic organism Methanosarcina thermophila) was only reported in 2001 (Buss et al., 2001 ▶). In the present work, we report cloning, overexpression, purification and preliminary X-ray crystallographic studies of AckA from the mesophilic organism S. typhimurium (StAckA; NCBI reference code NP_461279.1). Unexpected structural differences between two crystal forms of StAckA were observed, warranting further investigations into the significance of the conformational changes.
2. Materials and methods
2.1. Plasmid construction and protein purification
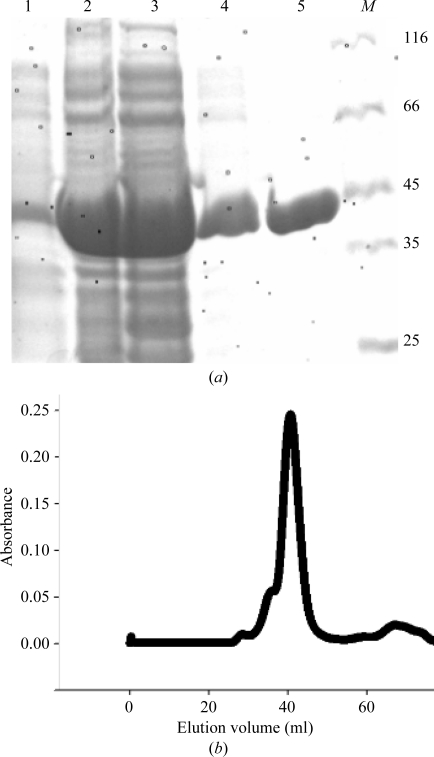
The 1200 bp open reading frame encoding AckA was PCR-amplified from S. enterica serovar Typhimurium strain IFO12529 genomic DNA template and cloned into pRSET C vector (Invitrogen). The final plasmid construct encodes recombinant StAckA with 15 additional amino acids (MRGSHHHHHHGMASH-StAckA) including a hexahistidine tag. The recombinant plasmid was transformed into E. coli BL21 (DE3) pLysS competent cells. The transformed cells were inoculated into 1 l Terrific Broth (HiMedia) containing 4 ml glycerol and allowed to grow at 310 K until the OD at 600 nm reached 0.6. Expression of the recombinant StAckA was then induced by addition of 0.3 mM isopropyl β-d-1-thiogalactopyranoside (IPTG). The culture was further incubated overnight at 293 K. The overexpressed protein was purified using Ni–NTA affinity chromatography followed by gel-filtration chromatography using a Superdex S-200 column (Fig. 2 ▶). The purified enzyme was dialyzed for 24 h against 25 mM Tris buffer pH 8.0 containing 100 mM NaCl and concentrated using a 10 kDa molecular-weight cutoff Centricon (Amicon).
Figure 2.
Purification of the recombinant StAckA. (a) SDS–PAGE analysis of StAckA. Lane 1, crude cell lysate before IPTG induction; lane 2, crude cell lysate after induction with 0.3 mM IPTG; lane 3, soluble fraction of the cell lysate; lane 4, 20 mM imidazole wash; lane 5, purified StAckA; lane M, molecular-mass markers (labelled in kDa). (b) Gel-filtration chromatography of the purified StAckA. The elution volume suggests that the enzyme is a dimer in solution.
2.2. Crystallization and X-ray diffraction
Two distinct crystal forms of StAckA suitable for structural studies were obtained at 298 K using the microbatch method. The crystallization drops consisted of 3 µl 10 mg ml−1 protein and 1 µl crystallization cocktail. In both experiments crystals were observed after two months. Crystals of form I were obtained using polyethylene glycol 4000 as the precipitant, while form II crystals were obtained in the presence of trisodium citrate. Prior to X-ray diffraction data collection, a crystal was briefly exposed to a drop containing crystallization buffer with 20%(w/v) ethylene glycol as a cryoprotectant and flash-cooled at 100 K in a nitrogen-gas stream. A complete three-dimensional X-ray diffraction data set was collected from a form I crystal at a wavelength of 1.5418 Å on a Bruker Microstar Ultra rotating-anode X-ray generator at the X-ray Facility for Structural Biology at the Molecular Biophysics Unit, Indian Institute of Science (IISc). The exposure time and crystal oscillation angles were set to 10 min and 1.0°, respectively. The crystal-to-detector distance was maintained at 200 mm. The crystal diffracted X-rays to 2.70 Å resolution. A total of 247 images were recorded using a MAR 345 image-plate detector. Form II crystals diffracted X-rays to a higher resolution of 2.35 Å at the home source. X-ray diffraction data from a form II crystal were subsequently collected on the BM14 beamline at the European Synchrotron Radiation Facility (ESRF), Grenoble, France at a wavelength of 0.95 Å; the crystal diffracted to 1.90 Å resolution. The crystal-to-detector distance was maintained at 187.25 mm. The exposure time and crystal oscillation angles were set to 15 s and 1.0°, respectively. A total of 210 images were recorded using a MAR 345/Offline FUJI image-plate detector. Both data sets were processed and scaled using the programs DENZO and SCALEPACK, respectively, from the HKL-2000 suite (Otwinowski & Minor, 1997 ▶) and were further analyzed with programs from CCP4 (Winn et al., 2011 ▶).
3. Results and discussion
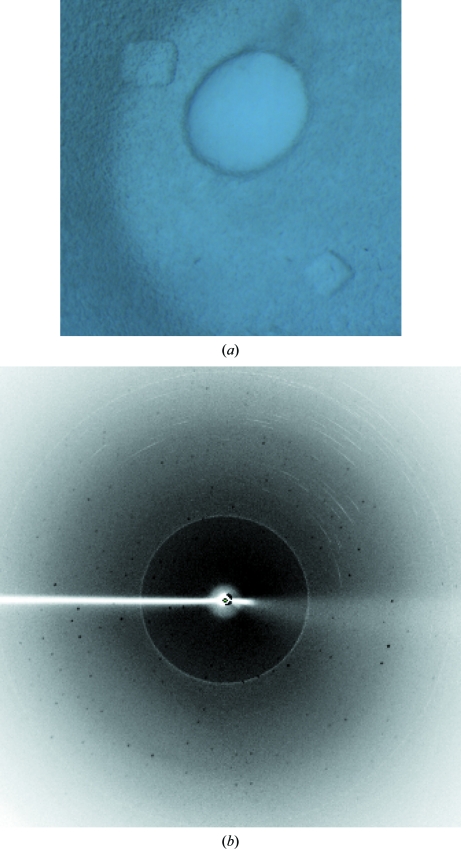
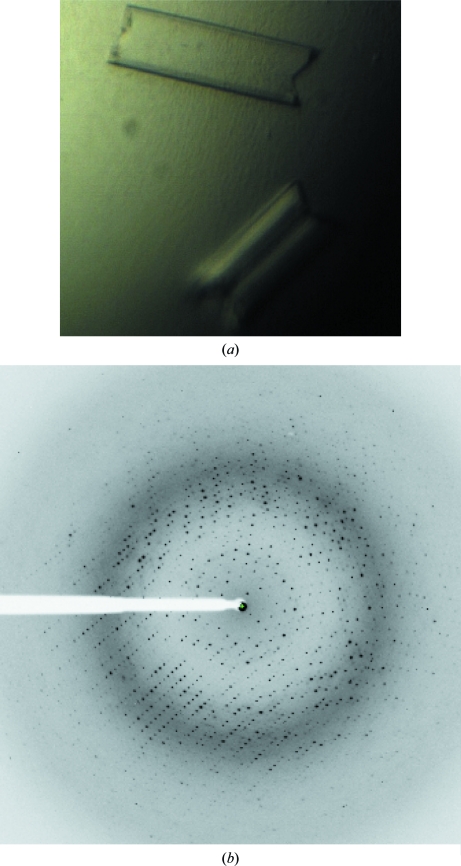
S. typhimurium AckA was cloned in the pRSET C vector (Invitrogen) with an N-terminal hexahistidine tag, overexpressed in E. coli and purified using Ni–NTA affinity-column chromatography. SDS–PAGE analysis revealed a single band with the expected molecular mass of 45 kDa (Fig. 2 ▶ a). Gel-filtration chromatography performed on the purified StAckA indicated that it is in a dimeric form in solution (Fig. 2 ▶ b), which is consistent with observations on other members of the acetokinase family (Buss et al., 2001 ▶; Simanshu et al., 2005 ▶). StAckA crystals were obtained in two forms using the microbatch method. Form I crystals (approximate dimensions of 0.4 × 0.4 × 0.2 mm) of StAckA diffracted X-rays to 2.70 Å resolution and belonged to the monoclinic space group C2, with unit-cell parameters a = 283.16, b = 62.17, c = 91.69 Å, β = 93.57° (Fig. 3 ▶). Form II crystals (approximate dimensions of 0.6 × 0.3 × 0.2 mm) diffracted to 2.35 Å resolution at the home source (Cu Kα radiation, λ = 1.5418 Å; data not shown) and to 1.90 Å resolution when examined on the BM14 beamline at the ESRF, Grenoble at a wavelength of 0.95 Å (Fig. 4 ▶). The form II crystals also belonged to the monoclinic space group C2, but had smaller unit-cell parameters a = 151.01, b = 78.49, c = 97.48 Å, β = 116.37°. Calculation of Matthews coefficients (Matthews, 1968 ▶) suggested the presence of four and two StAckA protomers in the asymmetric units of the form I and form II crystals, respectively. Details of the data-collection and processing statistics for both crystal forms are summarized in Table 1 ▶.
Figure 3.
Crystals and X-ray diffraction pattern of form I StAckA. (a) Form I StAckA crystals used for three-dimensional X-ray diffraction data collection using X-rays from a rotating-anode generator. (b) A typical X-ray diffraction image obtained from a form I StAckA crystal.
Figure 4.
Crystals and X-ray diffraction pattern of form II StAckA. (a) Form II StAckA crystals used for three-dimensional X-ray diffraction data collection using synchrotron radiation on BM14 at the ESRF. (b) A typical X-ray diffraction image obtained from a form II StAckA crystal.
Table 1. Data-collection and processing statistics.
Values in parentheses are for the highest resolution shell.
| Form I | Form II | |
|---|---|---|
| Crystallization conditions | 0.1 M HEPES pH 7.5, 30%(w/v) PEG 4000, 0.2 M calcium chloride | 0.1 M HEPES pH 7.5, 1.4 M trisodium citrate |
| Wavelength (Å) | 1.54 | 0.95 |
| Temperature (K) | 100 | 100 |
| Resolution range | 50.0–2.70 (2.80–2.70) | 50.0–1.90 (1.97–1.90) |
| Space group | C2 | C2 |
| Unit-cell parameters (Å, °) | a = 283.16, b = 62.17, c = 91.69, β = 93.57 | a = 151.01, b = 78.50, c = 97.48, β = 116.37 |
| Observed reflections | 76858 | 153171 |
| Unique reflections | 42614 | 79119 |
| Data completeness (%) | 96.9 (84.5) | 98.6 (90.4) |
| Multiplicity | 2.8 (1.9) | 4.3 (3.4) |
| Mean 〈I/σ(I)〉† | 8.12 (2.06) | 16.0 (2.20) |
| Rmerge‡ (%) | 13.8 (55.8) | 6.2 (78.6) |
| Matthews coefficient (Å3 Da−1) | 2.40 | 2.88 |
| Solvent content (%) | 48.7 | 52.8 |
| Protomers in the asymmetric unit | 4 | 2 |
I is the integrated intensity and σ(I) is the estimated standard deviation of that intensity.
R
merge = 
 , where I
i(hkl) is the ith measurement of the intensity of reflection hkl and 〈I(hkl)〉 is the mean intensity.
Initial phases for form I StAckA diffraction data were determined by molecular replacement using a polyalanine model of the TmAckA (PDB entry 2iir; S. Mukhopadhyay, M. S. Hasson & D. A. Sanders, unpublished work; 46% sequence identity to StAckA) monomer as the search model. The initial solution obtained using Phaser (McCoy et al., 2007 ▶) showed significant values of log-likelihood gain (LLG = 1100) and Z scores for the rotation function (RFZ = 6.9) and translation function (TFZ = 14.8). This initial model was subjected to 25 cycles of rigid-body refinement and 25 cycles of restrained refinement using REFMAC5 (Murshudov et al., 2011 ▶), which resulted in R work and R free values of 38% and 42%, respectively. The refined polyalanine model of form I StAckA was used to determine the structure of the form II crystal. Molecular replacement performed using Phaser (McCoy et al., 2007 ▶) provided an initial solution with an LLG of 1366 and Z scores RFZ = 20.1 and TFZ = 19.4. Rigid-body and restrained refinement of this initial model using REFMAC5 (Murshudov et al., 2011 ▶) resulted in R work and R free values of 32% and 36%, respectively. Inspection of the electron-density map (data not shown) showed unexpectedly large disorder of residues 230–300 (hereafter referred as the variable segment) in both monomers of form II StAckA. Therefore, these residues were deleted from form I and the resulting model was used for re-estimation of the phases by molecular replacement. This led to significant improvements in LLG (5668), Z scores (RFZ = 53.2, TFZ = 32.8) and R factors (R work = 31%, R free = 34%), suggesting that the structure of the variable segment in form II is indeed very different from that in form I. Further refinement and model building are currently in progress and the large structural changes that have been observed in the initial maps and their possible biological implications need to be further investigated.
Acknowledgments
We thank James and Babu of IISc and Dr Hassan Belrhali and Dr Babu Manjasetty of the ESRF for their assistance during X-ray diffraction data collection. MRNM and HSS thank the Department of Science and Technology (DST) and Department of Biotechnology (DBT), Government of India for financial support. SC acknowledges the Council for Scientific and Industrial Research, Government of India for the award of a Research Fellowship.
References
- Barnes, E. M., Impey, C. S. & Stevens, B. J. (1979). J. Hyg. (Lond.), 82, 263–283. [DOI] [PMC free article] [PubMed]
- Bohnhoff, M. & Miller, C. P. (1962). J. Infect. Dis. 111, 117–127. [DOI] [PubMed]
- Buss, K. A., Cooper, D. R., Ingram-Smith, C., Ferry, J. G., Sanders, D. A. & Hasson, M. S. (2001). J. Bacteriol. 183, 680–686. [DOI] [PMC free article] [PubMed]
- Cherrington, C. A., Hinton, M., Mead, G. C. & Chopra, I. (1991). Adv. Microb. Physiol. 32, 87–108. [DOI] [PubMed]
- Cummings, J. H. & Macfarlane, G. T. (1991). J. Appl. Bacteriol. 70, 443–459. [DOI] [PubMed]
- Cummings, J. H., Pomare, E. W., Branch, W. J., Naylor, C. P. & Macfarlane, G. T. (1987). Gut, 28, 1221–1227. [DOI] [PMC free article] [PubMed]
- Das, S., Yu, L., Gaitatzes, C., Rogers, R., Freeman, J., Bienkowska, J., Adams, R. M., Smith, T. F. & Lindelien, J. (1997). Nature (London), 385, 29–30. [DOI] [PubMed]
- Fox, D. K. & Roseman, S. (1986). J. Biol. Chem. 261, 13487–13497. [PubMed]
- Klein, K., Steinberg, R., Fiethen, B. & Overath, P. (1971). Eur. J. Biochem. 19, 442–450. [DOI] [PubMed]
- Matthews, B. W. (1968). J. Mol. Biol. 33, 491–497. [DOI] [PubMed]
- McCoy, A. J., Grosse-Kunstleve, R. W., Adams, P. D., Winn, M. D., Storoni, L. C. & Read, R. J. (2007). J. Appl. Cryst. 40, 658–674. [DOI] [PMC free article] [PubMed]
- Miller, T. L. & Wolin, M. J. (1979). Am. J. Clin. Nutr. 32, 164–172. [DOI] [PubMed]
- Murshudov, G. N., Skubák, P., Lebedev, A. A., Pannu, N. S., Steiner, R. A., Nicholls, R. A., Winn, M. D., Long, F. & Vagin, A. A. (2011). Acta Cryst. D67, 355–367. [DOI] [PMC free article] [PubMed]
- Nunn, W. D. (1986). Microbiol. Rev. 50, 179–192. [DOI] [PMC free article] [PubMed]
- Otwinowski, Z. & Minor, W. (1997). Methods Enzymol. 276, 307–326. [DOI] [PubMed]
- Rishi, P., Pathak, S. & Ricke, S. C. (2005). J. Environ. Sci. Health B, 40, 645–657. [DOI] [PubMed]
- Simanshu, D. K., Savithri, H. S. & Murthy, M. R. N. (2005). J. Mol. Biol. 352, 876–892. [DOI] [PubMed]
- Wanner, B. L. & Wilmes-Riesenberg, M. R. (1992). J. Bacteriol. 174, 2124–2130. [DOI] [PMC free article] [PubMed]
- Winn, M. D. et al. (2011). Acta Cryst. D67, 235–242.
- Wolfe, A. J. (2005). Microbiol. Mol. Biol. Rev. 69, 12–50. [DOI] [PMC free article] [PubMed]


