Summary
During fluorescent live cell imaging it is critical to keep excitation light dose as low as possible, especially in the presence of photosensitizer drugs, which generate free radicals upon photobleaching. During fluorescent imaging, stress by excitation and free radicals induces serious cell damages that may arrest the cell cycle. This limits the usefulness of the technique for drug discovery, when prolonged live cell imaging is necessary. This paper presents a strategy to provide gentle experimental conditions for dynamic monitoring of the proliferation of human lung epithelial carcinoma cells (A549) in the presence of the photosensitizer Polyvinylpyrrolidone-Hypericin. The distinctive strategy of this paper is based on the stringent environmental control and optimizing the excitation light dose by (i) using a low-power pulsed blue light-emitting diode with short pulse duration of 1.29 ms and (ii) adding a nontoxic fluorescent dye called carboxyfluorescein-diacetate-succinimidyl-ester (CFSE) to improve the fluorescence signals. To demonstrate the usefulness of the strategy, fluorescence signals and proliferation of dual-marked cells, during 5-h fluorescence imaging under pulsed excitation, were compared with those kept under continuous excitation and nonmarked reference cells. The results demonstrated 3% cell division and 2% apoptosis due to pulsed excitation compared to no division and 85% apoptosis under the continuous irradiation. Therefore, our strategy allows live cell imaging to be performed over longer time scales than with conventional continuous excitation.
Keywords: CFSE, fluorescence, live cell imaging, photobleaching, phototoxicity, pulsed LED excitation, PVP-Hypericin
Introduction
Among recent technological advances, fluorescent imaging of live cells using light microscope techniques has received considerable attention in recent years due to its properties, which enable researchers to study complex biological processes in great detail (Stephens & Allan, 2003; Nishigaki et al., 2006; Pattison & Davies, 2006; Frigault et al., 2009). These techniques now span all fields of the life sciences and extend to the physical sciences as well (Merryman, 1999; Bovik, 2005). Conventional fluorescence microscopes are operated with a tungsten halogen lamp for bright field or phase contrast illumination and a mercury arc lamp or a laser as an excitation light source for fluorescence (Martin et al., 2005).
Both mercury arc lamp and laser, however, have their disadvantages. A mercury arc lamp produces a lot of heat and harmful ultraviolet light that can damage cells. Alternatively, widening the narrow coherent laser beam in the focal plane results in a nonuniform irradiation pattern called speckles (Martin et al., 2005; Merryman, 1999; Moser et al., 2006). In addition, a commonly used strategy to improve the fluorescence signals is increasing the intensity of excitation light or the concentration of the fluorescent dyes, e.g. fluorescent probes and photosensitizers (Nishigaki et al., 2006). These procedures have significant side effects, however, since cells are intrinsically photosensitive. This is enhanced by the presence of photosensitizer drugs which generate reactive oxygen species (ROS) upon photobleaching (Stephens & Allan, 2003; Connally & Piper, 2008; Frigault et al., 2009; Vandepitte et al., 2010a,b). Cells stressed by excitation and free radicals (photodamage and phototoxicity) quickly stop dividing, round up and soon die (Hoebe et al., 2007). Therefore, only a static, snapshot view of cells is possible. This limits the usefulness of the technique for in vitro drug discovery in photodynamic diagnostic (PDD) and photodynamic therapy (PDT).
In order to reduce photodamage and nonuniformity of excitation light during live cell imaging, it has been suggested to use an alternative light source instead of mercury lamps and lasers. For example, Martin et al. (2005) and Moser et al. (2006) showed that light-emitting diodes (LEDs) operate without producing heat and are excellent light sources for fluorescent microscopy. They also concluded that the wide spectral coverage of LEDs from deep ultraviolet to near infrared range suggests their use in fluorescent microscopy to replace mercury lamps and lasers. The amount of excitation light and phototoxicity can be minimized further in two ways: by optimizing the efficiency of the light path through the microscope, and by using highly sensitive detectors (Nishigaki et al., 2006; Frigault et al., 2009). The unnecessary excitation light dose (light intensity × exposure time) should also be blocked between successive images.
Borlinghaus (2006) and Nishigaki et al. (2006) showed that excitation using a pulsed LED (with high light intensity and short pulse duration) reduces phototoxicity and photobleaching in fluorescence microscopy. More recently, Connally & Piper (2008) suggested a pulsed ultraviolet-LED as a beneficial light source to minimize phototoxicity in time-gated luminescence microscopy for the detection of phosphorescence. Thus the benefits of pulsed LEDs to reduce photobleaching and phototoxicity were demonstrated more than 4 years ago. At the same light intensity, however, imaging of living cells using pulsed excitation are almost always more noisy than imaging using continuous excitation (Goldman & Spector, 2005). This is due to the fact that irradiation exposure time has a smaller value in pulsed excitation. Nevertheless, a noisy image of living cells in which one can see what is absolutely essential is more preferable than a better image of damaged cells. On the other hand, if the dosages of pulsed and continuous excitation are the same, detecting strong fluorescence signals and reducing the noise of images highly depends on the light intensity and concentration of fluorescent dyes, which in general has to be higher for pulsed excitation (Nishigaki et al., 2006; Pawley, 2006). Cell damages and duration of live cell imaging in pulse-driven systems therefore vary depending on the phototoxicity of fluorescent dyes, light intensities and wavelengths used (Herman et al., 2001; Martin et al., 2005; Pawley, 2006). To the best of our knowledge, studying pulsed excitation in live cell imaging is still limited to monitoring fluorescence of dyes with low phototoxicity. This method has not yet been introduced into the field of in vitro PDD and PDT research in presence of a photosensitizer, which generates high amounts of reactive oxygen species (Nishigaki et al., 2006; Vandepitte et al., 2010a,b).
This paper introduces a new strategy for hours-long and high-quality imaging of living A549 cell proliferation in presence of PVP-Hypericin. As a result, the problem of high phototoxicity and photobleaching on the one hand and of low fluorescence signals and noisy images on the other hand is circumvented, see below for details.
Theory
In vitro studies of PDD and PDT effects of PVP-Hypericin, using live cell imaging techniques, are usually performed only over a relatively short duration (at most 1 h; cf. Goldman & Spector, 2005; Kubin et al., 2008; Theodossiou et al., 2009; Vandepitte et al., 2010a,b). This is due to photodamages and phototoxicity, which occur upon fluorescence photobleaching of PVP-Hypericin. Although these studies reveal exciting results, it takes several hours to discover the detailed effects of the photosensitizer on cell damage (Goldman&Spector, 2005; Pawley, 2006).
A commonly used method for fluorescent imaging of live cells is to illuminate the entire field of view continuously by using a halogen lamp and an excitation light source from opposite directions. In the background between marked cells, even a high light dose cannot improve the image quality because of the absence of signal (Hoebe et al., 2007). In addition, in photosensitizer-dense regions (marked cells), most of the time the continuous excitation light dose is higher than necessary and it does not improve the image quality. As a result, a large portion of the excitation light dose in both background and bright marked cells is higher than needed and causes unnecessary photobleaching and phototoxicity not only in the focal plane, but also in the entire light cone above and below the focal plane (Hoebe et al., 2007). Hereby, using a low power pulsed blue LED to excite PVP-Hypericin minimizes the excitation light dose and thus reduces phototoxicity and photobleaching artefacts during live cell imaging (Borlinghaus, 2006; Nishigaki et al., 2006).
Dual-marking of cells with carboxyfluorescein-diacetate-succinimidyl-ester (CFSE, a nontoxic membrane-permeable fluorescent green dye) in addition to PVP-Hypericin, can eliminate the problem of low fluorescence signals and noisy images resulting from pulsed excitation.
Materials and methods
Preparation of cell culture and marking of A549 cells with CFSE and PVP-Hypericin
The human lung carcinoma epithelial cell line (A549) was maintained in RPMI-1640 culture medium (Sigma-Aldrich, Vienna, Austria) with 10% fetal calf serum – all from Cancer Research Institute, Medical University of Vienna, Austria. In a first experiment, the cell line was divided into two groups, consisting of 6.6 × 10⁴ cells per dish each. The first group that comprised the so-called reference cells, was cultured in a 35 mm Petri dish (WillCo-dish™, GWSt-3522, Amsterdam) at 37°C, 5% CO2 and 95% humidity. The cells of the second group were marked with CFSE using a method adapted from Quah et al. (2007). CFSE was diluted to 5 mM in dimethyl sulfoxide and then to 1 µM in phosphate-buffered saline. Then it was added to the cells (in semi-darkness) to give a final concentration of 1 µM. Quah et al. (2007) and Nilsson et al. (2010) found no toxic effects at this dosage of CFSE. After 10 min, dye uptake was prevented by washing twice with ice-cold RPMI. Finally, the cells were cultured in RPMI with 10% fetal calf serum in the 35 mm Petri dish, and they remained at 37°C, 5% CO2 and 95% humidity in darkness. In order to detect any negative effect of CFSE on cells proliferation, 24 h later, CFSE being distributed among parent and daughter cells, both reference and marked cells were monitored and analyzed by a fluorescence microscope for 8 h.
In a second experiment, PVP-Hypericin was added to the cells marked with CFSE, all in darkness. Then, proliferation and fluorescence signals of dual-marked cells were monitored for 5 h. Due to the high photosensitivity of cells in the presence of PVP-Hypericin, the imaging was performed immediately after the addition of photosensitizer. PVP-Hypericin was prepared by a special formulation, combining Hypericin and Polyvinylpyrrolidone (strictly speaking, PVP40) in a ratio of 1:100; cf. Kubin et al. (2008). PVP-Hypericin was diluted in RPMI with 10% fetal calf serum and then was added to the cells to give a final concentration of 50 µM. All experiments described were repeated three times.
Preparation of a controlled cellular environment using a microscope stage chamber
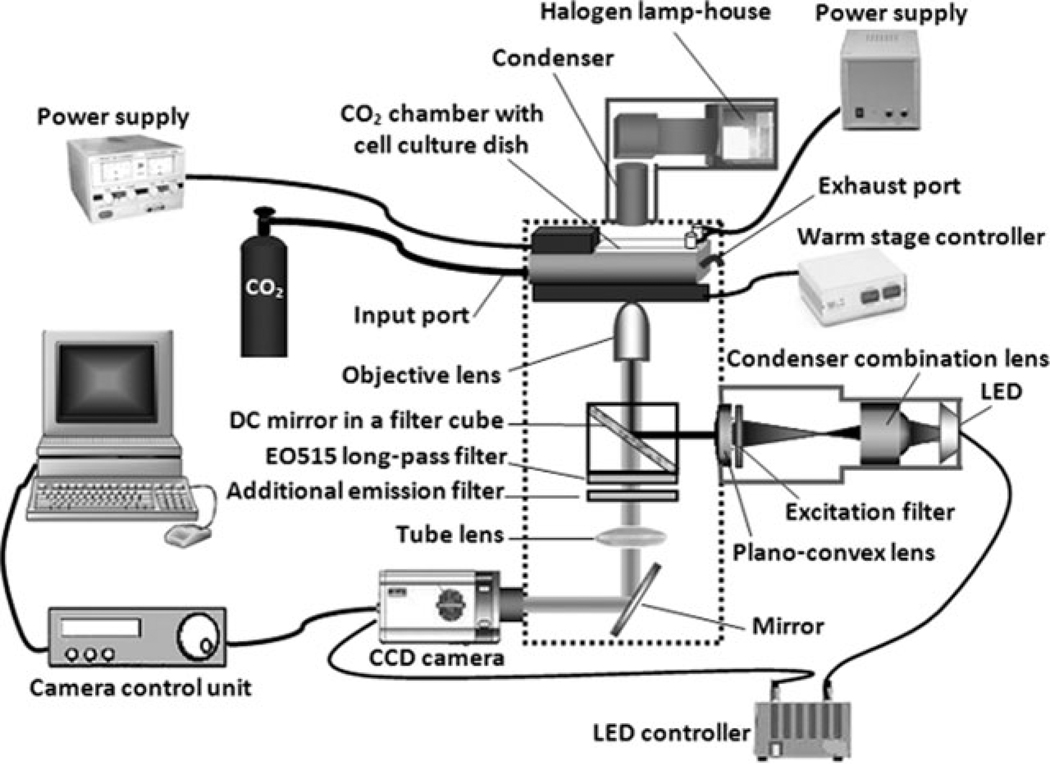
For a successful live cell imaging, cells were kept in a closed chamber with an environment that does not induce stress responses, which would alter the cellular processes of interest. The chamber is designed to accommodate single 35mmPetri dishes and can be fixed to the microscope warm stage. This results in the prevention of focus drift caused by mechanical instability, a common problem during lengthy observations (Stephens & Allan, 2003; Frigault et al., 2009). Inside the chamber, temperature is controlled by warm humid air streaming gently through the chamber and by the chamber metal frame fixed to the microscope warm stage. To avoid changes in osmolarity caused by evaporation of the culture medium, a heated sterile water placed inside the chamber. A heater is embedded underneath the water bath, which maintains optimal humidity of chamber during the whole imaging. A premixed gas (air balanced with 5% CO2) flows into the chamber through an input port and is directed out of the chamber on the other side by using an exhaust port. This results in a precisely directed flow of premixed gas over the cells, which is an advantage compared to open dish type chambers. To avoid water condensation on chamber glass, the glass is heated by two resistors that are attached to the glass surface.
The CO2 concentration inside the chamber is measured by a carbon dioxide sensor (NDIR CO2 TRANSMITTER PCB IRC-TM), which is directly attached to the chamber. The CO2 concentration can be monitored simultaneously and the stabilization of 5% CO2 over long periods of imaging is therefore possible.
Fluorescent imaging setup
Live cell images were collected with an OLYMPUS IMT-2 (inverted fluorescence and phase contrast tissue culture microscope W/DUAL camera ports) connected with a CCD camera (HAMAMATSU C4880, SITe, U.S.A.) and an image analysis software (HiPic 8); see Figure 1. An InGaN blue LED (ROITHNER LASERTECHNIK GmbH, Vienna, Austria) was attached to an aluminum holder and mounted in a FlashCube assembly connected to the rear epifluorescence illumination port of the microscope. Using a combination of a condenser lens and a plano-convex lens, the output beam of the LED was collimated. All lenses are made of crown-glass with antireflector coating for visible range. A 488 nm excitation filter was set up in front of the blue LED. The collimated LED beam was focused onto the experimental sample using a dichroic mirror and a 20× air for phase contrast objective (with a numerical aperture of 0.4 and long working distance), as shown in Figure 1.
Fig. 1.
Schematic diagram of imaging setup that has been modified to include a low power blue LED as an excitation light source and a chamber for preparing a controlled cellular environment. The halogen lamp was only used for imaging of reference cells.
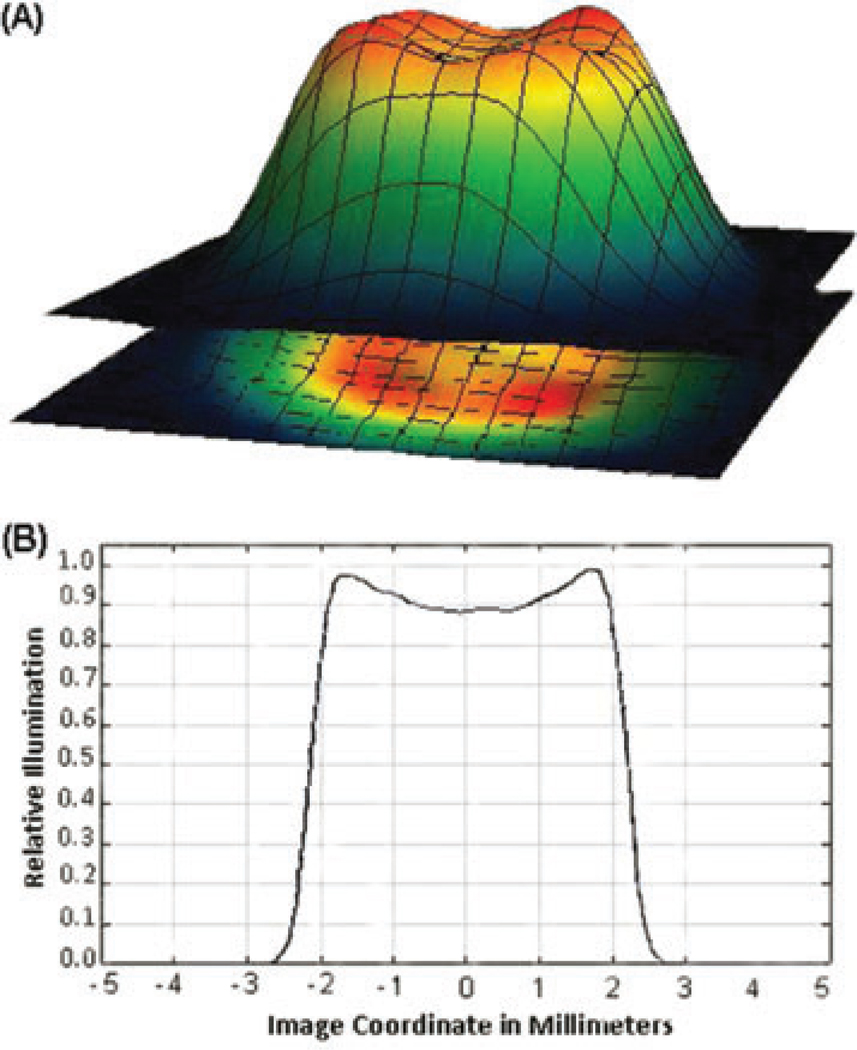
The lens combination produces a semi-flattened Gaussian distribution in the focal plane of the objective lens (Youk&Kim, 2006). In Figure 2 (A), the three-dimensional profile of the beam (spot diameter of about 3.8 mm) in the focal plane of the objective lens and in (B) its intensity-mapped representation are shown. The light reflected from the surface of the sample and the emitted fluorescence were fed back to the objective lens, and propagated in the backward direction. Two emission filters, 535 CWL (band-pass, 515–555 nm) and EO515 (long-pass filter), separated the different fluorescence signals and blocked direct illumination from the LED. They were placed on the recording camera path.
Fig. 2.
The semi-flattened Gaussian distribution of LED beam in the focal plane of the objective lens. (A) Three-dimensional profile of the blue LED beam (spot diameter of about 3.8mm)on the focal plane. (B) The intensity-mapped representation of the focused beam designed by ZEMAX and Wolfram Mathematica 7.0 software.
The LED was controlled by a power supply that provided a maximum direct current of 225 mA operating in either continuous or pulsed mode. The LED pulses were triggered by the CCD camera, the images being taken synchronously. For all time-lapse images, LED power intensity at the focal plane (measured by Ultima LabMaster Power and Energy Dual-Channel Meter) was 9.83 mW cm−2 (with average power of ~1.1 mW) for either continuous or pulsed excitation. For all time-lapse images, the duration of pulse exposure was chosen to be 1.29 ms and the images were taken every 2 min (1.29 × 10⁻³ s / 120 s ≙ 1.1 × 10⁻³ % duty cycle for pulse irradiation). Therefore, the total exposure time in whole 5-h imaging was 193.5 ms (150 × 1.29 ms). The entire experiments were performed in darkness (large plastic black box encloses the whole setup) with the same microscope settings, and the final images were analysed with HiPic 8 software. Finally, to colorize the images, colours were matched to the brightness levels of the images from short to long wavelengths by using a home-made software.
Spectrophotometry and fluorescence spectrometry
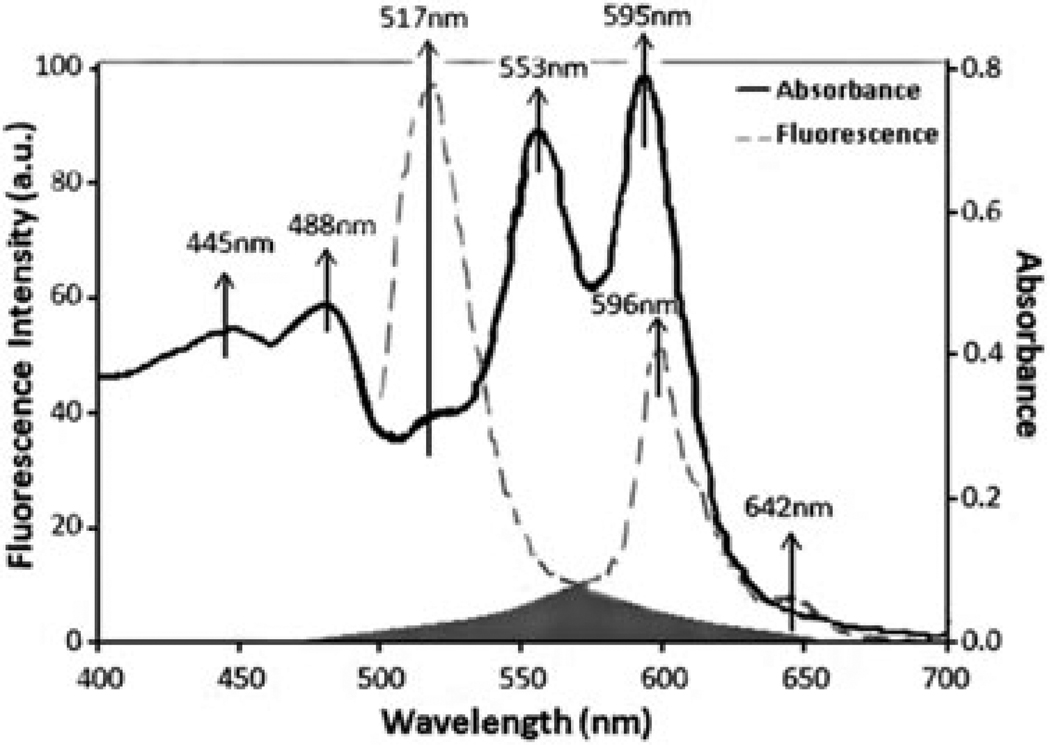
The absorbance and fluorescence emission spectra of A549 cells marked with 1 µM CFSE and 50 µM PVP-Hypericin were measured using an ultraviolet-visible-near infrared spectrophotometer (Hitachi U-3501; Tokyo, Japan) and a fluorescence spectrometer (Perkin Elmer LS-50B; Norwalk, CT, U.S.A.). The fresh cell suspension was centrifuged at 200 g for 4 min and then they were marked with CFSE and PVP-Hypericin, using the same procedure described before. Studies were conducted using a quartz flow cell of 1 cm path length with a volume of 4.5 mL. The cells were repeatedly stirred with a pipette to prevent settling between the measurements. The absorbance spectrum of the marked cells and their fluorescence emission spectrum (488 nm excitation) is shown in Figure 3.
Fig. 3.
Spectral analysis of the dual-marked A549 cells with CFSE and PVP-Hypericin. The black solid line shows the absorbance spectrum, and the grey dashed line indicates the fluorescence emission spectrum at 488 nm excitation wavelength. The broad fluorescence emission spectra of CFSE (around 517 nm) and of PVP-Hypericin (around 596 nm) exhibit considerable overlap in the grey area.
The absorbance spectrum shows five absorbance peaks around 445, 488, 517, 553 and 595 nm consistent with PVP-Hypericin (Kubin et al., 2008) and one absorbance peak around 488 nm consistent with CFSE (Luzyanina et al., 2007; Quah et al., 2007). Therefore, PVP-Hypericin can be excited by the same wavelength (488 nm) as CFSE, but it emits fluorescence at a much longer wavelength than CFSE: The fluorescence spectrum shows an emission band around 517 nm consistent with CFSE (Quah et al., 2007; Nilsson et al., 2010) and two emission peaks around 596 and 642 nm consistent with PVP-Hypericin (Kubin et al., 2008). The grey area shown in Figure 3 indicates that fluorescence emission spectra of CFSE and PVP-Hypericin exhibit considerable overlap.
Results and discussion
During fluorescent imaging of live cells, high amount of excitation light dose can induce serious cell damages that may arrest the cell cycle (Stephens & Allan, 2003; Frigault et al., 2009). This limits usefulness of the technique for drug discovery in PDD and PDT when prolonged live cell imaging is necessary (Walker et al., 2008). In this study we clearly demonstrate the advantages of pulsed excitation for long period fluorescence imaging of A549 cells in the presence of PVP-Hypericin. To eliminate the problem of low fluorescence signals and noisy images due to the pulsed excitation, cells are marked with CFSE in addition to PVP-Hypericin.
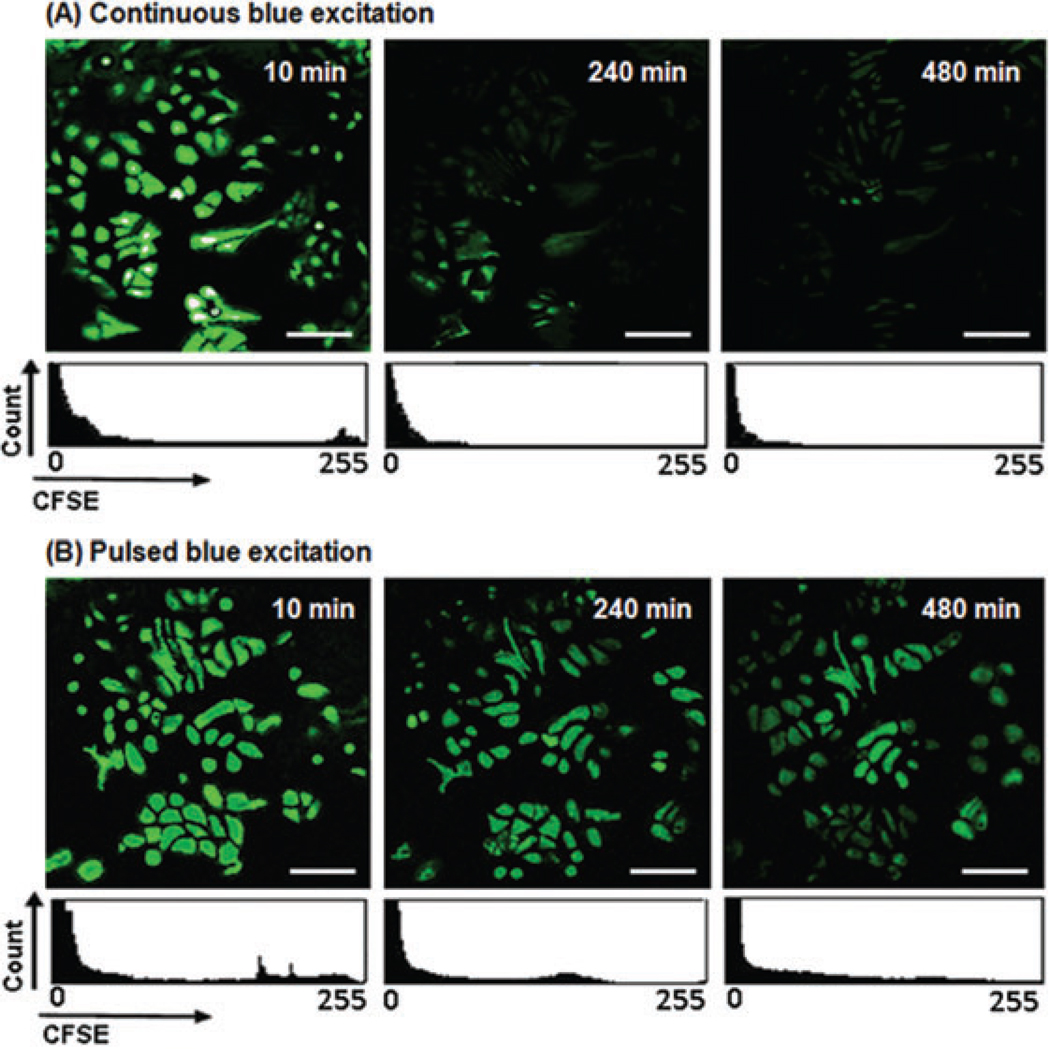
To study any possible negative effect of CFSE on motility of cells, viability (division or apoptosis) of marked cells and fluorescence photobleaching of CFSE, using pulsed or continuous excitation, were compared with nonmarked reference cells. Figure 4 shows the nonmarked reference cells and Figure 5 shows the CFSE green fluorescence signals and proliferation of the marked cells excited by pulsed or continuous irradiation. Figure 5 and the descriptive statistics of Table 1 show the following: After 10 min, the signal-to-noise ratio (SNR; cf. Xie et al., 2006; Xi et al., 2008) of the image is lower with pulsed excitation than with continuous excitation. This is because of the reduction of exposure times. Considering the mean values (the average of fluorescence signals) in Table 1, the fluorescence imaging of cells using continuous excitation reduced the green fluorescence signals by 88% after 8 h, whereas only 56% of the initial fluorescence signals disappeared when pulsed excitation was applied.
Fig. 4.
Eight-hour monitoring of proliferation of nonmarked A549 cells (reference cells) The images were collected with a 20× objective (air for phase contrast) under a halogen lamp. The white scale bars represent 50 µm. Incidentally, nonmarked cells have no auto-fluorescence under pulsed or continuous blue irradiation.
Fig. 5.
An 8-h imaging of A549 cells expressing CFSE green fluorescence. Images were collected with a 20× objective (air for phase contrast). (A) Fluorescence signals and cell proliferation under continuous blue excitation. (B) Fluorescence signals and cell proliferation under pulsed blue excitation. The white scale bars represent 50 µm.
Table 1.
Statistical analysis of carboxyfluorescein-diacetate-succinimidyl-ester (CFSE) green fluorescence signals detecting after continuous or pulsed excitations.
| Time (min) | Mean (CFSE)a | SDb | SNRc | |
|---|---|---|---|---|
| Continuous blue excitation | 10 | 43.94 | 3.85 | 11.41 |
| 240 | 8.75 | 3.80 | 2.27 | |
| 480 | 5.25 | 3.75 | 1.39 | |
| Pulsed blue excitation | 10 | 39.13 | 6.98 | 5.61 |
| 240 | 22.04 | 5.53 | 3.99 | |
| 480 | 17.23 | 4.36 | 3.95 |
Average of CFSE fluorescence signals.
Standard deviation of the noise.
Signal-to-noise ratio: the ratio of mean signal and standard deviation of the noise. It specifies how much a signal is corrupted by noise.
As fluorescence intensity of CFSE is highly dependent on the cell proliferation (Rödel et al.,2005;Pawley,2006;Tuominen-Gustafsson et al., 2006; Luzyanina et al., 2007), the decrease in fluorescence signals could either be due to an increase in cell division or to photobleaching of CFSE. To distinguish the two possibilities, number of cell divisions was counted and compared for continuous and pulsed excitations in Figure 6.
Fig. 6.
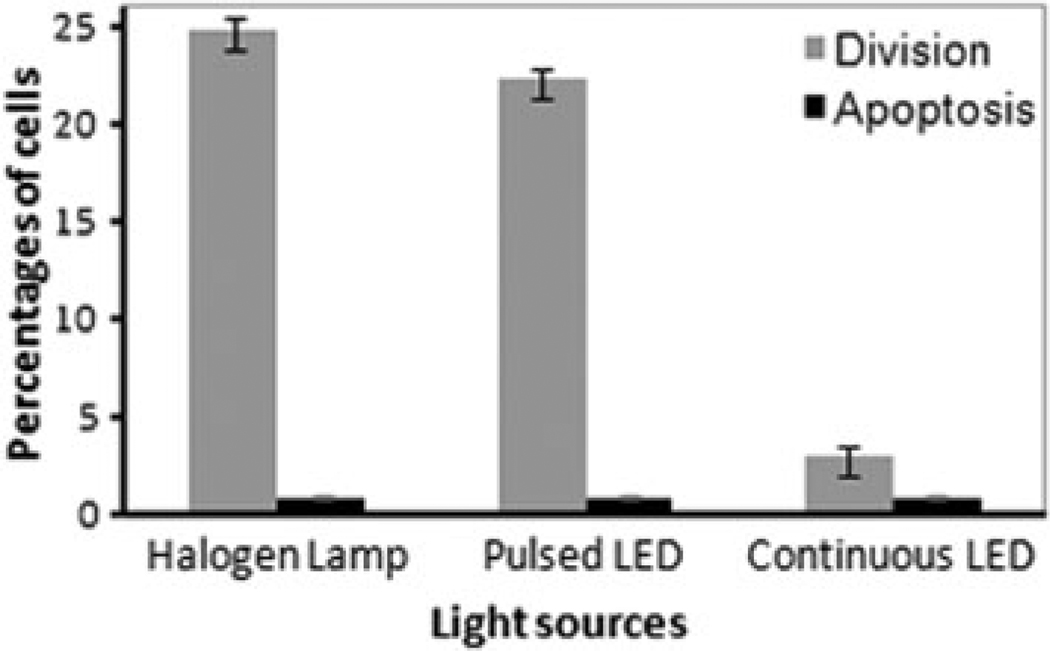
Comparison between the percentages of division and apoptosis in marked cells with CFSE under blue-LED excitation with nonmarked reference cells under the halogen lamp, during 8-h imaging. The experiments were repeated three times, and for each measurement the cell number was counted thrice. Error bars represent the standard deviation.
The experiments were repeated three times, and for each measurement the numbers of apoptotic and divided cells were counted thrice. Thus, in total there were nine countings, the resulting mean values and standard deviations being displayed in Figure 6. This histogram shows that among 89 cells excited by pulsed blue irradiation, 22% underwent cell division and concomitantly reduced their fluorescence within 8-h imaging. Under continuous excitation, cell division declined gradually and among 119 cells only 3% divided. The percentage of division among 104 nonmarked reference cells is about 25%. The generation of apoptotic cells during live cell imaging was the same for both pulsed and continuous excitations.
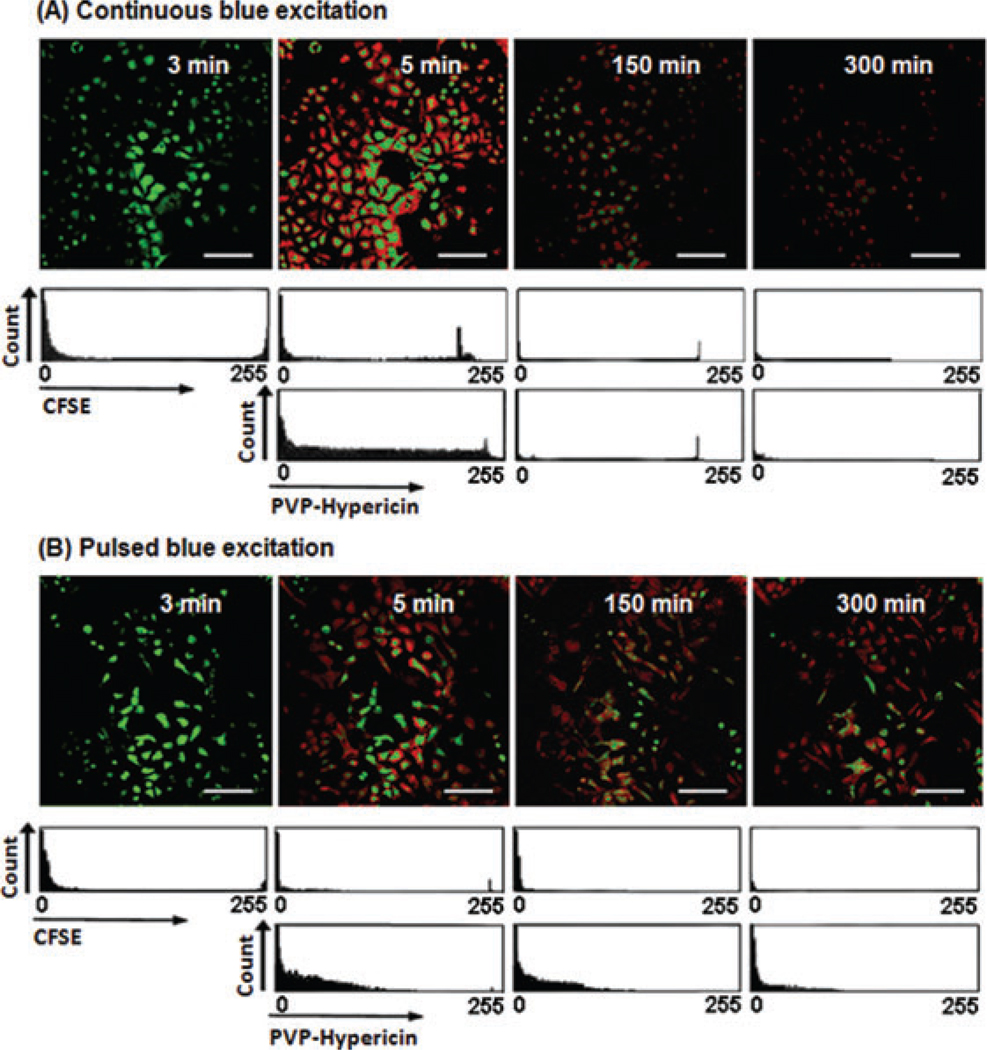
The reduction of phototoxicity and fluorescence photobleaching of PVP-Hypericin due to the pulsed excitation was quantified in the following way: The viability of dual-marked cells and their fluorescence signals due to pulsed excitation during 5-h imaging was compared with those kept under the continuous excitation and with nonmarked reference cells. Figure 7 shows the CFSE and PVP-Hypericin fluorescence signals and proliferation of the dual-marked cells. The images of dual-marked cells after 5 min show the strong green and red fluorescence signals for both kinds of excitation. However, frequency histograms of brightness in Figure 7 and statistical analysis in Table 2 show a higher SNR value with continuous excitation than with pulsed excitation. The descriptive statistics of Table 2 revealed a 95.6% decrease in green fluorescence signals due to continuous excitation and an 82.5% decrease due to the pulsed excitation after 5-h imaging. In comparison with the first experiments (single-marked cells), the photobleaching of CFSE in dual-marked cells increased significantly under both continuous and pulsed excitation.
Fig. 7.
A5-h imaging of the dual-marked A549 cells with CFSE and PVP-Hypericin. Images were collected with a 20× objective (air for phase contrast). (A) Fluorescence signals and cell proliferation under continuous blue excitation. (B) Fluorescence signals and cell proliferation under pulsed blue excitation. The scale bars represent 50 µm.
Table 2.
Statistical analysis of PVP-Hypericin and CFSE fluorescence signals detecting after continuous or pulsed excitations.
| Time (min) |
Mean (CFSE)a |
Mean (PVP-Hypericin)b |
SDc | SNRd | |
|---|---|---|---|---|---|
| Continuous blue excitation | 3 | 22.93 | – | 2.93 | 7.79 |
| 5 | 16.09 | 39.64 | 2.57 | 21.68 | |
| 150 | 1.32 | 5.04 | 3.00 | 2.12 | |
| 300 | 1.01 | 1.78 | 2.63 | 1.10 | |
| Pulsed blue excitation | 3 | 13.20 | – | 3.60 | 3.67 |
| 5 | 8.48 | 17.24 | 2.76 | 9.32 | |
| 150 | 4.90 | 14.14 | 3.68 | 5.17 | |
| 300 | 2.31 | 9.37 | 2.99 | 3.90 |
Average of CFSE fluorescence signals.
Average of PVP-Hypericin fluorescence signals.
Standard deviation of the noise.
Signal-to-noise ratio; cf. Table 1.
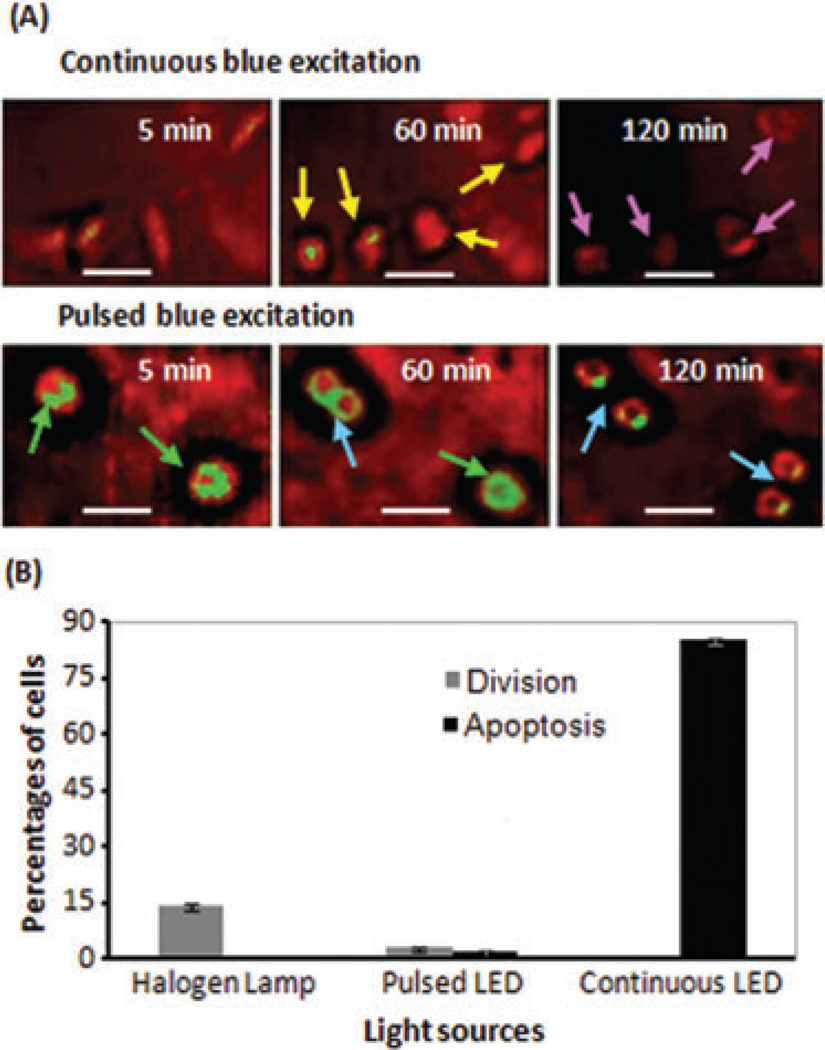
The mean values in Table 2 show that the fluorescence imaging of cells using continuous blue LED reduced total red fluorescence signals by 95.5% after 5 h. When pulsed blue LED was applied, however, only 45.7% of the initial red fluorescence signal disappeared after 5h.A549 cells excited by the continuous irradiation showed blebbing of cell membrane (Hoebe et al., 2007) for the first time after 20 min. After 60 min, most cells were rounded up (yellow arrows in Fig. 8A) and after 120 min most were apoptotic (pink arrows in Fig. 8A). The number of cell divisions and apoptosis was determined and compared for continuous and pulsed excitations; cf. Figure 8(B). This figure shows that during 5-h imaging, among 173 cells excited by the pulsed irradiation 3% underwent cell divisions, whereas among 169 cells excited by continuous blue LED none of the cells divided. The generation of apoptotic cells during live cell imaging was about 2% and 85% for pulsed and continuous blue LED, respectively. For comparison, the percentage of division among 104 nonmarked reference cells during 5-h imaging is about 14% and no apoptotic cell was monitored.
Fig. 8.
(A) Monitoring of apoptotic and divided A549 cells, dual-marked with CFSE and PVP-Hypericin, under continuous and pulsed excitation. Cells excited with continuous blue LED round up (yellow arrows) and after 120 min most cells are apoptotic (pink arrows). By applying pulsed blue LED the photodamages are delayed and even dynamic monitoring of cell division (blue arrows) is possible. (B) Comparison of the percentages of division and apoptosis in dual-marked cells under blue-LED excitation with nonmarked reference cells under the halogen lamp, during 5-h imaging. Error bars represent the standard deviation. The scale bars represent 10 µm.
The results show that fluorescent imaging of live cells using continuous blue excitation reduces division of cells, proliferation rate and fluorescence signals in long-term imaging.
Conclusions
The advantages of using low-power pulsed excitation for dynamic monitoring of live cell proliferation in presence of CFSE and PVP-Hypericin was studied. We demonstrated reduced photobleaching of CFSE and PVP-Hypericin and thus reduced phototoxicity due to the pulsed excitation in comparison with continuous excitation. Using pulsed excitation provides experimental conditions on marked cells gentle enough so that they can be monitored over longer time scales or even during the division. To our knowledge, hours-long imaging of live cell proliferation in the presence of PVP-Hypericin has not previously been possible by fluorescence microscopes equipped with a continuous excitation light source (Theodossiou et al., 2009; Vandepitte et al., 2010a,b). We also clarified that dual-marking of cells with CFSE (a nontoxic fluorescent dye) in addition to PVP-Hypericin, eliminates the problem of low fluorescence signals and noisy images resulting from pulsed excitation. The quality of images and the fluorescence signals of dual-marked cells due to pulsed excitation were comparable with those kept under the continuous excitation with the same light intensity but much higher exposure time.
High-quality imaging of cell proliferation in the presence of a strong photosensitizing drug for hours instead of parts of an hour increases sensitive information for assessing the impact of photosensitizer drug and understanding the processes of interest in PDD and PDT. Therefore, we believe that using the strategy of this paper, low-power pulsed LEDs can replace continuous as well as high-intensity pulsed light sources in future fluorescence live cell imaging studies. The next step is the modification of light dose in pulsed excitation (with optimized light intensity and pulse duration) for live cell imaging. This is the subject of a further paper.
Acknowledgements
The new strategy and imaging setup used in this paper was supported by the Austrian Economy Chamber (http://www.i2b.at) and developed by RISCREEN, granted with First place i2B-Businessplan-2009 AWARD (15.12.2009) and Hochschuljubiläumsfond-project H1971–2006. Authors would like to thank Gottfried Koehler, Martin Knapp, Maria Eisenbauer and Paul Breit for useful discussion.
References
- Borlinghaus RT. MRT letter: high speed scanning has the potential to increase fluorescence yield and to reduce photobleaching. Microsc. Res. Tech. 2006;69:689–692. doi: 10.1002/jemt.20363. [DOI] [PubMed] [Google Scholar]
- Bovik AC. Handbook of Image and Video Processing. 2nd ed. New York: Elsevier Academic Press; 2005. [Google Scholar]
- Connally RE, Piper JA. Time-gated luminescence microscopy. Ann N.Y. Acad Sci. 2008;1130:106–116. doi: 10.1196/annals.1430.032. [DOI] [PubMed] [Google Scholar]
- Frigault MM, Lacoste J, Swift JL, Brown CM. Live-cell microscopy: tips and tools. J. Cell Sci. 2009;122:753–767. doi: 10.1242/jcs.033837. [DOI] [PubMed] [Google Scholar]
- Goldman RD, Spector DL. Live Cell Imaging, a Laboratory Manual. New York: Cold Spring Harbor Laboratory; 2005. pp. 337–338. [Google Scholar]
- Herman P, Maliwal BP, Lin HJ, Lakowicz JR. Frequency-domain fluorescence microscopy with the LED as a light source. J. Microsc. 2001;203:176–181. doi: 10.1046/j.1365-2818.2001.00943.x. [DOI] [PubMed] [Google Scholar]
- Hoebe RA, Van Oven CH, Gadella TWJ, Jr, Dhonukshe PB, Van Noorden CJF, Manders EMM. Controlled light-exposure microscopy reduces photobleaching and phototoxicity in fluorescence live-cell imaging. Nat. Biotechnol. 2007;25:249–253. doi: 10.1038/nbt1278. [DOI] [PubMed] [Google Scholar]
- Kubin A, Loew HG, Burner U, Jessner G, Kolbabek H, Wierrani F. How to make hypericin water-soluble. Pharmazie. 2008;63:263–269. [PubMed] [Google Scholar]
- Luzyanina T, Roose D, Schenke T, Sester M, Ehl S, Meyerhans A, Bocharov G. Numerical modeling of label-structured cell population growth using CFSE distribution data. Theor. Biol. Med. Model. 2007;4:1–15. doi: 10.1186/1742-4682-4-26. [DOI] [PMC free article] [PubMed] [Google Scholar]
- Martin G, Agostini HT, Hansen LL. Light emitting diode microscope illumination for green fluorescent protein or fluorescein isothiocyanate epifluorescence. BioTechniques. 2005;38:204–206. doi: 10.2144/05382BM06. [DOI] [PubMed] [Google Scholar]
- Merryman JI. Effects of ultraviolet C radiation on cellular proliferation in p53−/− keratinocytes. J. Environ. Pathol. Toxicol. Oncol. 1999;18:1–9. [PubMed] [Google Scholar]
- Moser C, Mayr T, Klimant I. Filter cubes with built-in ultrabright light-emitting diodes as exchangeable excitation light sources in fluorescence microscopy. J. Microsc. 2006;222:135–140. doi: 10.1111/j.1365-2818.2006.01581.x. [DOI] [PubMed] [Google Scholar]
- Nilsson SK, Johnston HM, Coverdale JA. Spatial localization of transplanted hemopoietic stem cells: inferences for the localization of stem cell niches. Blood. 2010;97:2293–2299. doi: 10.1182/blood.v97.8.2293. [DOI] [PubMed] [Google Scholar]
- Nishigaki T, Wood CD, Shiba K, Baba SA, Darszon A. Stroboscopic illumination using light-emitting diodes reduces phototoxicity in fluorescence cell imaging. BioTechniques. 2006;41:191–197. doi: 10.2144/000112220. [DOI] [PubMed] [Google Scholar]
- Pattison DI, Davies MJ. Actions of ultraviolet light on cellular structures. EXS. 2006;96:131–157. doi: 10.1007/3-7643-7378-4_6. [DOI] [PubMed] [Google Scholar]
- Pawley JB. Handbook of Biological Confocal Microscopy. 3rd ed. Berlin: Springer Science + Business Media LLC; 2006. pp. 395–396. [Google Scholar]
- Quah BJC, Warren HS, Parish CR. Monitoring lymphocyte proliferation in vitro and in vivo with the intracellular fluorescent dye carboxyfluorescein diacetate succinimidyl ester. Nat. Protocols. 2007;2:2049–2056. doi: 10.1038/nprot.2007.296. [DOI] [PubMed] [Google Scholar]
- Rödel F, Franz S, Sheriff A, et al. The CFSE distribution assay is a powerful technique for the analysis of radiation-induced cell death and survival on a single-cell level. Strahlenther Onkol. 2005;181:456–462. doi: 10.1007/s00066-005-1361-3. [DOI] [PubMed] [Google Scholar]
- Stephens DJ, Allan VJ. Light microscopy techniques for live cell imaging. Science. 2003;300:82–86. doi: 10.1126/science.1082160. [DOI] [PubMed] [Google Scholar]
- Theodossiou TA, Hothersall JS, DeWitte PA, Pantos A, Agostinis P. The multifaceted photocytotoxic profile of Hypericin. Mol. Pharmaceut. 2009;6:1775–1789. doi: 10.1021/mp900166q. [DOI] [PubMed] [Google Scholar]
- Tuominen-Gustafsson H, Penttinen M, Hytönen J, Vilianen MK. Use of CFSE staining of borreliae in studies on the interaction between borreliae and human neutrophils. BMC. Microbiol. 2006;6:1–14. doi: 10.1186/1471-2180-6-92. [DOI] [PMC free article] [PubMed] [Google Scholar]
- Vandepitte J, Cleynenbreugel BV, Hettinger K, Poppel HV, De Witte PAM. Biodistribution of PVP-hypericin and hexaminolevulinate-induced PpIX in normal and orthotopic tumor-bearing rat urinary bladder. Canc. Chemother. Pharmacol. 2010a;66:123–129. doi: 10.1007/s00280-010-1375-0. [DOI] [PubMed] [Google Scholar]
- Vandepitte J, Van Poppel H, De Witte PA. PVP-hypericin as a photodiagnostic and phototherapeutic tool for bladder cancer: a preclinical study. Belg. J. Med. Oncol. 2010b;4:261–263. [Google Scholar]
- Walker EB, Haley D, Petrausch U, et al. Phenotype and functional characterization of long-term gp100-specific memory CD8+ T cells in disease-free melanoma patients before and after boosting immunization. Clin Cancer Res. 2008;14:5270–5283. doi: 10.1158/1078-0432.CCR-08-0022. [DOI] [PMC free article] [PubMed] [Google Scholar]
- Xi P, Andegeko Y, Weisel LR, Lozovoy VV, Dantus M. Greater signal, increased depth, and less photobleaching in two-photon microscopy with 10 fs pulses. Optics Commun. 2008;281:1841–1849. [Google Scholar]
- Xie C, Mu C, Cox JR, Gerton JM. Tip-enhanced fluorescence microscopy of high-density samples. App. Phys. Letters. 2006;89:1–3. [Google Scholar]
- Youk Y, Kim DY. A simple reflection-type two-dimensional refractive index profile measurement technique for optical waveguides. Optics Commun. 2006;262:206–210. [Google Scholar]


