

Abstract
Amnestic mild cognitive impairment (aMCI) is a syndrome associated with faster memory decline than normal aging, and frequently represents the prodromal phase of Alzheimer’s disease. When a person is not actively engaged in a goal-directed task, spontaneous functional magnetic resonance imaging (fMRI) signals can reveal functionally connected brain networks, including the so-called default mode network (DMN). To date, only a few studies have investigated DMN functions in aMCI populations. In this study, group independent component analysis was conducted for resting-state fMRI data, with slices acquired perpendicular to the long axis of the hippocampus, from eight subjects with aMCI and eight normal control subjects. Subjects with aMCI showed increased DMN activity in middle cingulate cortex, medial prefrontal cortex, and left inferior parietal cortex compared to the normal control group. Decreased DMN activity for the aMCI group compared to the normal control group was noted in lateral prefrontal cortex, left medial temporal lobe (MTL), left medial temporal gyrus, posterior cingulate cortex/retrosplenial cortex/precuneus, and right angular gyrus. Although MTL volume difference between the two groups was not statistical significant, decreased activity in left MTL was observed for the aMCI group. Positive correlations between DMN activity and memory scores were noted for left lateral prefrontal cortex, left medial temporal gyrus, and right angular gyrus. These findings support the premise that alterations of the DMN occur in aMCI and may indicate deficiencies in functional, intrinsic brain architecture, that correlate with memory function, even before significant medial temporal lobe atrophy is detectable by structural MRI.
Keywords: default mode network (DMN), amnestic mild cognitive impairment (aMCI), resting-state fMRI, medial temporal lobe (MTL)
Introduction
Connectivity is an important property of the brain’s anatomic-functional integration and consists of sub-systems with tight functional connections that have been detected by spontaneous, synchronous fluctuations in low frequency blood oxygen level-dependent (BOLD) functional MRI (fMRI) signals during resting states (Biswal et al. 1995, Cordes et al. 2000 2001, Grady et al. 2001, Greicius et al. 2003, Fransson 2005, Fox et al. 2005 2006, Damoiseaux et al. 2006, Sorg et al. 2007, Bai et al. 2008, Qi et al. 2010). The default mode network (DMN) is one such sub-system that is presumptively active when a person is left undisturbed to engage in introspective modes of cognition including free thinking, remembering the past, envisioning the future, and mediating the perspectives of others (Shulman, et al. 1997, Mazoyer et al. 2001, Raichle et al. 2001, Buckner and Carroll 2007, Buckner et al. 2008, Andrews-Hanna et al. 2010). The brain regions involved with the DMN are the anterior cingulate cortex (ACC), medial prefrontal cortex (MPFC), lateral prefrontal cortex (LPFC), medial and inferior lateral parietal lobe (MILP), precuneus, posterior cingulate cortex (PCC), and medial temporal lobe (MTL) (Raichle et al. 2001, Buckner and Carroll 2007, Buckner et al. 2008, Andrews-Hanna et al. 2010). An early awareness of the importance of the DMN arose by observation that deactivations of these regions occurred when individuals were performing goal-directed tasks (e.g. Ghatan et al. 1995, Baker et al. 1996). Meta-analyses of prior work (Shulman et al. 1997, Mazoyer et al. 2001) revealed converging evidence regarding the existence of the DMN and lead to vigorous research using resting-state connectivity (e.g. Greicius et al. 2003, Fox et al. 2005, Fransson 2005, Damoiseaux et al. 2006, Vincent et al. 2006) and task evoked deactivations (e.g. Esposito et al. 2006, Greicius and Menon 2004, Harrison et al. 2007, Mckiernan et al. 2003) and activations (Buckner and Carroll 2007, Greicius et al. 2003, Gusnard et al. 2001, Northoff et al. 2006, Pujol et al. 2007). A review of the current understanding of the DMN can be found in Buckner et al. (2008).
A disruption of DMN activities may occur in various central nervous system disorders including Alzheimer’s disease, schizophrenia, and autism (Buckner et al 2008). Given the structural and functional relationship of the DMN to regions important to memory, the study of disrupted DMN activity in Alzheimer’s disease (AD), which is the most common cause of dementia in older adults, is especially compelling. AD is characterized by progressive amnesia, executive and visuospatial dysfunction, as well as language and neuropsychiatric disturbances. Subjects with early AD have been studied using various imaging approaches, including brain glucose metabolism (Reiman et al. 1996, Minoshima et al. 1997, Herholz et al. 2002), brain structural atrophy (Scahill et al. 2002, Thompson et al. 2003), as well as resting-state and task-evoked functional MRI (fMRI) (Lustig et al. 2003, Greicius et al. 2004, Rombouts et al. 2005, Wang et al. 2006). These studies suggest disrupted or altered activities in AD in DMN regions. Interestingly, amyloid deposition, a pathological hallmark of AD, preferentially accumulates in regions associated with the DMN even before symptoms of cognitive dysfunction emerge (Klunk et al. 2004).
Identification of neuropathological or functional changes before the onset of dementia is a crucial step in finding treatments that prevent or slow the onset of disease. The diagnosis of AD is typically preceded by a long prodromal phase during which a person has detectable cognitive deficits (mild cognitive impairment or MCI) but does not meet criteria for dementia (Small et al., 2000; Palmer et al., 2003). Some estimate that the prodromal phase may be as long as 20 years. The development of MCI with an amnestic component (or aMCI) is an important clinical predictor of dementia, with an annual rate of conversion to AD or dementia in the range of 6–25% compared to only 0.5–4% for healthy subjects in similar age groups (Petersen et al 2001).
A few fMRI studies (Rombouts et al. 2005, Sorg et al. 2007, Bai et al. 2008, Qi et al. 2010) have investigated altered DMN functions in aMCI patients. Rombouts et al. (2005) used a visual encoding task and a non-spatial working memory task to investigate the deactivations in DMN for healthy subjects, aMCI subjects, and AD subjects. In general, aMCI subjects showed less deactivation than healthy controls, but more than AD. The deactivation in anterior medial frontal cortex significantly distinguished aMCI from healthy elderly. Combining independent component analysis (ICA) and region of interest (ROI) based correlation, Sorg et al. (2007) investigated resting-state fMRI networks of healthy elderly and aMCI groups. They found that functional connectivity between hippocampi and posterior cingulate cortex (PCC) are absent in aMCI during the resting state. A subsequent resting-state fMRI study (Bai et al. 2008) using ROI-based Kendall’s coefficient of concordance (Kendall and Gibbons 1990) revealed decreased activities in PCC and precuneus and increased activities in right inferior parietal lobe (IPL), right fusiform gyrus, and bilateral putamen in aMCI compared to healthy elderly. Most recently, Qi et al. (2010) found that compared to healthy elderly controls, aMCI subjects exhibited decreased functional activity in DMN regions, including precuneus/PCC, right inferior parietal lobule, and left fusiform gyrus, as well as a trend towards decreased right medial temporal lobe activity. The aMCI subjects also had increased activity found mainly in left prefrontal cortex, left inferior parietal lobule, and left middle temporal gyrus compared to the healthy elderly. These studies demonstrate that there are both consistencies and discrepancies in selective DMN changes in aMCI, which may be due to methodological differences and/or the clinical heterogeneity of aMCI. Additional evidence is necessary to understand the changes of activity in different regions in the DMN that are consistent and potentially reliable indicators of aMCI and future development of AD.
MCI with an amnestic component (aMCI) confers the highest risk for transition to Alzheimer’s disease. As a preliminary study, we examined eight subjects with aMCI and a group of eight normal controls with resting-state fMRI, and we focused data analysis on the functional connectivity of the DMN. We adopted a model-free group approach using ICA (Calhoun et al. 2001) with an imaging protocol that allows acquisition of oblique-coronal slices perpendicular to the long axis of the hippocampus to obtain more specific information for the medial temporal lobe with fewer susceptibility artifacts.
Methods
Subjects
Eighteen subjects (ten with aMCI and eight normal controls) were consented and recruited from the community for participation in this study, which was approved by the Colorado Multiple Institution Review Board. Two subjects with aMCI did not qualify for the fMRI study due to incidental imaging abnormalities (meningioma and arachnoid cyst). All subjects were right-handed and demographic information for those completing the study is shown in Table 1. Of the eight normal control subjects, four were women and four were men with an average age of 60.88±8.31 years. Subjects with aMCI included three women and five men with an average age of 60.63±3.22 years. Screening for vascular-based cognitive impairment (Modified Hachinski Ischemic Scale or HIS) and depression (Center for Epidemiologic Studies Depression Scale or CES-D) was performed to exclude potential stroke-related MCI (excluded for HIS>4) and depression (excluded for CES-D>27). Subjects with a past history of a major psychiatric illness (i.e. schizophrenia, bipolar illness), neurologic disorder (i.e. stroke, Parkinson’s disease) or known structural central nervous system abnormality were excluded, as were those taking acetylcholinesterase inhibitors or medications with mood- or significant arousal-altering potential (e.g. benzodiazepines or stimulants). Diagnosis of amnestic MCI was made using Petersen Criteria (Petersen et. al 2001) following 1) a comprehensive neuropsychological evaluation, 2) a neurologic examination by a neurobehavioral neurologist or neuropsychiatrist, and 3) a diagnostic consensus by the neuropsychologist and the examining physicians. Neuropsychological battery included the mini-mental state examination (MMSE), Boston Naming Test, California Verbal Learning Test (CVLT), Logical Memory I and II of the Wechsler Memory Scale-Revised, Controlled Oral Word Association Task, Animal Naming, Trail Making A and B, Symbol Digit Test, Block Design, and Benton Visual Retention test.
Table 1.
Demographic and neuropsychological test data for subjects
| Normal Control | aMCI | |
|---|---|---|
| Number of subjects | 8 | 8 |
| Female | 4 (50%) | 3 (37.5%) |
| Age (years) | 60.63±8.31 | 60.88±3.22 |
| Education (years) | 16.88±2.10 | 16.88±1.89 |
| Handedness | Right | Right |
| MMSE* | 29.63±0.51 | 28.13±1.13 |
| CDR | 0 | 0.5 |
| Working Memory | 0.5±1.28 | −0.44±1.74 |
| Delayed Recall* | 0.81±0.80 | −0.69±1.46 |
| Learning Efficiency* | 62.00±9.75 | 50.50±11.49 |
MMSE=mini mental state examination.
p<0.05 statistical significance between aMCI subjects and normal controls for Mini Mental State Exam or MMSE (p=0.0041), Delayed Recall (CVLT Long Delayed Recall) (p=0.0233), and Learning Efficiency (CVLT Total) (p=0.0488).
MRI Data acquisition
Echo planar imaging (EPI) was performed in a 3.0T GE HD× MRI scanner (General Electric, Milwaukee, WI) equipped with an 8-channel head coil using the following parameters: ASSET=2, ramp sampling, TR/TE=2sec/30ms, FA= 70deg, FOV=22cm×22cm, thickness/gap=4mm/1mm, 25 oblique-coronal slices perpendicular to the long axis of the hippocampus (see Figure 1), in-plane resolution 96×96 interpolated to 128×128, and 288 time points. Subjects were instructed to rest with eyes closed during EPI. A standard high resolution T2-weighted structural image aligned with the same coronal oblique orientation and coverage of the EPI scans was also collected. Furthermore, standard 3D SPGR T1-weighted high resolution (1mm3) axial structural images were collected.
Figure 1.
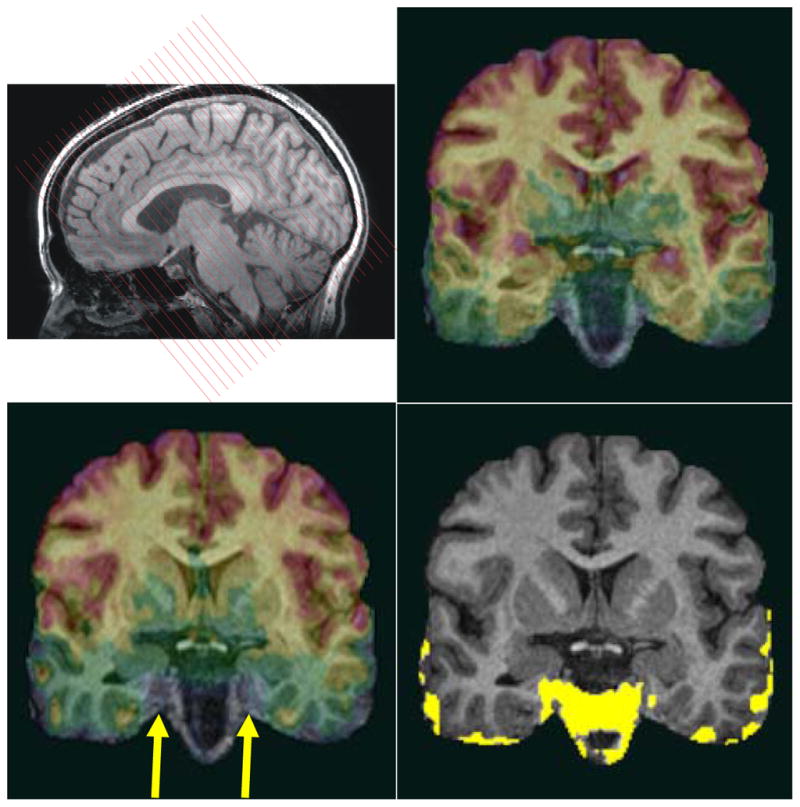
The functional EPIs were acquired perpendicular to the long axis of the hippocampus (top left). To show susceptibility drop-out artifacts of EPIs for different slice directions, we compare EPIs acquired in a coronal oblique orientation (top right) with EPIs acquired in a conventional axial orientation for a particular subject (lower left). All EPIs were co-registered to the same T1 3D-SPGR anatomical image (which serves here as an underlay). The yellow region (lower right) shows the difference of the EPI signal coverage of the coronal oblique and axial acquisition indicating major signal drop-off in anterior MTL regions (right CA1, right subiculum, right and left entorhinal cortex) when EPIs are acquired axially (arrow). All images in this figure are in radiological convention.
For a single subject, we also collected EPIs in an axial orientation with identical imaging parameters to compare the signal drop-out near the sphenoid sinus affecting the anterior portion of the MTL (Figure 1).
MRI data analysis
The first five echo planar volumes were excluded to avoid saturation artifacts. The remaining 283 volumes were pre-processed using SPM5 (http://www.fil.ion.ucl.ac.uk/spm/software/spm5/), including slice timing and motion correction. A mean EPI image was used to co-register the EPI functional images to the high resolution T2-weighted image. Then, both co-registered EPI images and the T2-weighted image were co-registered to the T1-weighted image. Finally, the high resolution T1-weighted anatomical image was used to determine parameters for spatial normalization of the EPIs to the Montreal Neurological Institute (MNI) space. The normalized EPIs were spatially smoothed with a 6 mm FWHM Gaussian kernel.
Spatial independent component analysis (ICA) was performed using the GIFT software v1.3g (http://icatb.sourceforge.net) (Calhoun, et al. 2001). Group ICA was conducted for the aMCI and the normal group, separately. For each group, the dimensionality of the data from each subject was estimated by the minimum description length (MDL) criterion (Calhoun et al. 2001). We used the median of the estimated dimensions of each group, which equaled 40 for both groups, as the number of independent components to be estimated in group ICA. The data from each subject was first reduced using principle component analysis (PCA) and concatenated into an aggregate data set for each group. Forty independent sources were estimated with an independent component analysis (ICA) using the Infomax algorithm (Bell and Sejnowski, 1995) on the aggregate data. Individual subject ICA data sets were then back-reconstructed. More details of group ICA can be found in Calhoun et al. (2001).
The DMN component was identified by selecting the component with the highest spatial correlation to the default network template supplied by the GIFT software. The mask included the lateral posterior parietal cortex, precuneus, posterior cingulate cortex, frontal pole, and occipitotemporal junction, as defined anatomically from the WFU Pickatlas (http://www.fmri.wfubmc.edu). A visual inspection was also conducted to assure that the spatial components selected resemble the DMN. No false selection was found from the automated procedure. The selected DMN components were further analyzed in a second level random effect analysis by using one-sample t-test for individual group and by using two-sample t-test for group differences. To address the multiple comparison problem, a cluster size larger than 272mm3 (corresponding to at least 34 voxels in re-sliced images with 2mm × 2mm × 2mm resolution) was determined by AFNI using AlphaSim (Cox, 1996) to achieve a corrected statistical significance less than p=0.05 with an uncorrected (voxelwise) threshold of p<0.005 for the results. All images in this work were displayed in neurological convention, i.e. the left side of the image corresponds to the left side of the brain, unless otherwise noted.
The MTL volume between two groups was also compared. First, the region including hippocampus, entorhinal cortex, perirhinal cortex, and parahippocampal cortex was delineated slice-by-slice in each subject’s high resolution T2 image by a trained professional using methods developed at UCLA (Zeineh et al., 2000; Ekstrom et al., 2009). To avoid bias, the segmentation was done without knowledge of the group membership of the subjects. The segmentation procedure has been reported to have high intra-rater reliability (>0.9) as measured by an intra-class correlation coefficient (Burggren et al. 2008). Then, the volume of delineated areas of each subject was calculated and input into a two-sample t- test.
To identify the correlation between resting-state activities and neuropsychological test scores for working memory (CVLT Trial 1), delayed recall (CVLT long delayed recall), and learning efficiency (CVLT Total), we adopted linear regression using least squares. The average activity (normalized to the variance of the fluctuation) in 6mm×6mm×6mm cubes, whose central locations were chosen as significant peak group differences in each individual DMN component, were used as dependent variables and the neuropsychological memory test standardized scores were the predictors. The significance of the Pearson correlation coefficient was also calculated. Due to the exploratory nature of this work and the limited number of subjects, the multiple-comparison problem was not addressed in the current correlation analysis and an uncorrected p-value was used to find significant correlations between resting-state activities and neuropsychological test scores.
Results
To show the advantage of using an fMRI imaging protocol with slices acquired in a coronal oblique orientation (perpendicular to the long axis of the hippocampus) over a protocol with a conventional axial slice orientation, we computed the signal drop-out in the anterior part of the MTL (Figure 1). All EPIs were co-registered to the same T1 3D-SPGR anatomical image (which serves in Figure 1 as an underlay). We found that anterior MTL regions (specifically right CA1, right subiculum, right and left entorhinal cortex) have significant signal dropout when the EPIs are acquired axially. This signal drop-out does not occur when the EPIs are acquired in the coronal oblique direction where the slice is perpendicular to the long axis of the hippocampus. Note that all images in Figure 1 were displayed in radiological convention.
Age and education differences between normal control and aMCI subjects were not statistically significant, whereas MMSE differences were significant (p=0.0041). Assessment of memory performance, specifically for delayed recall (CVLT long delayed recall) and learning efficiency (CVLT Total), was significantly different between the two groups, but working memory (CVLT Trial 1) was not. Average CDR score was 0.5 for the aMCI group and 0 for the normal control group (See table 1).
In Figure 2, we show the t-maps (corrected p<0.05) of the control group (A) and the aMCI group (B) for the second level one-sample t-test. Significant resting-state activities for normal controls were found in the following regions: lateral prefrontal cortex (LPFC), left MTL including hippocampus (HC) and parahippocampal gyrus (PHG), left fusiform gyrus (FG), anterior cingulate cortex (ACC), middle cingulate cortex (MCC), posterior cingulate cortex (PCC), retrosplenial cortex (RC), precuneus, and angular gyrus (AG). For aMCI subjects, there were no activities found in left HC/PHG/FG, and left LPFC. Furthermore, activities extended into MCC, in medial prefrontal cortex (MPFC) and right insular cortex were observed for aMCI.
Figure 2.
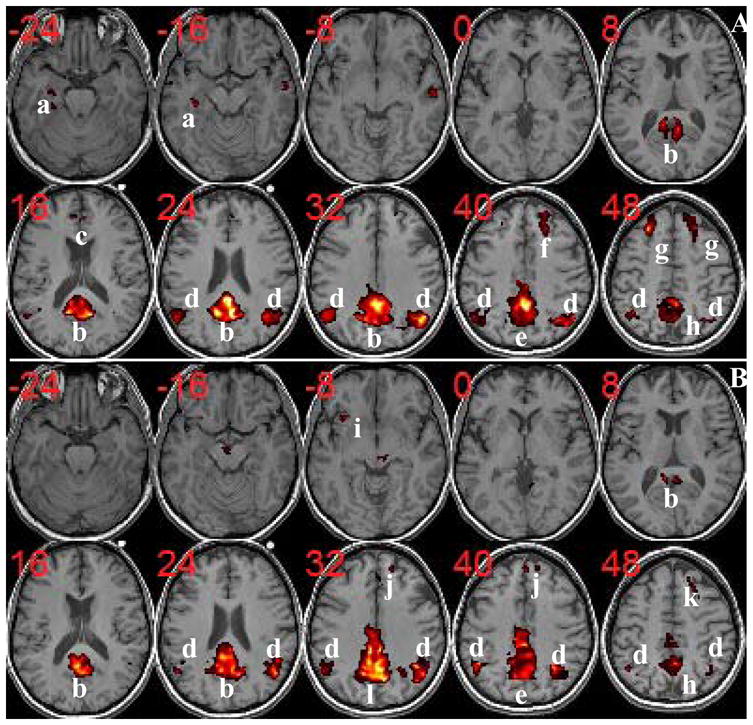
Group DMN components of normal controls (A) and aMCI (B) with corrected p<0.05. Resting-state activities for normal controls are found in: a=Left HC/PHG/FG; b=PCC/RC/Precuneus; c=ACC; d=AG; e=Precuneus/MCC; f=Right LPFC; g=LPFC; h=Precuneus. For aMCI subjects, there are no activities in left HC/PHG/FG (a) and left LPFC (see k=right LPFC). On the other hand, some activities extended into MCC (l=Precuneus/PCC/MCC), in MPFC (j), and in right insular cortext (i) are observed for aMCI. (The t-score range is from 3.5 to 16. ACC=Anterior Cingulate Cortex; AG=Angular Gyrus; FG=Fusiform Gyrus; HC=Hippocampus; LPFC=Lateral Prefrontal Cortex; MCC=Middle Cingulate Cortex; MPFC=Medial Prefrontal Cortex; PCC=Posterior Cingulate Cortex; PHG=Parahippocampal Gyrus; RC=Retrosplenial Cortex.)
The differences between the two groups using the second level two-sample t-test is shown in Figure 3 with corrected p<0.05. In Figure 3A, the group difference is displayed in axial slice view, where hot red color represents decreased activities in aMCI and cold blue color represents increased activities in aMCI. The most prominent decreased activities for aMCI compared to normal controls are in the left MTL (HC/PHG) and left FG along with those in LPFC, PCC/retrosplenial cortex (RC)/Precuneus, left medial temporal gyrus (MTG), and right AG. The decreased activities in left MTL for aMCI are observed consecutively from posterior to anterior slices as shown in coronal view in Figure 3B. On the other hand, the aMCI group shows increased activities mainly in MCC, MPFC, and left inferior parietal lobe (IPL). In Table 2 and 3 we list the peak locations in MNI coordinates as well as the size of clusters of decreased and increased activities for the aMCI group, respectively.
Figure 3.
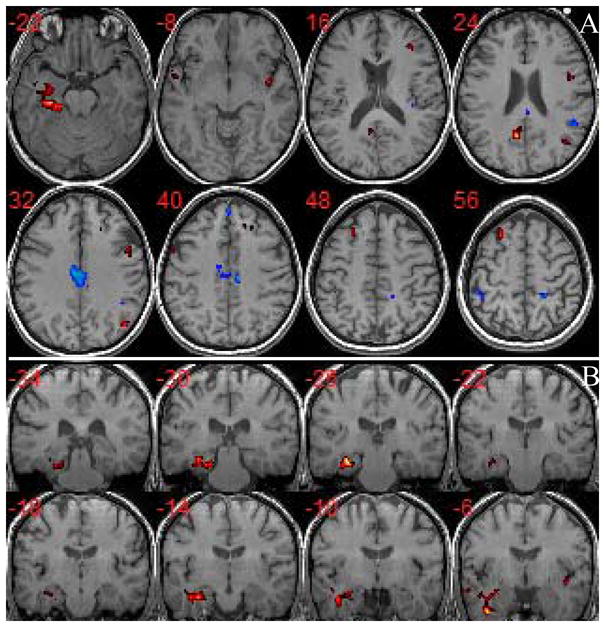
Group difference of DMN components between aMCI and normal controls (corrected p<0.05). (A) Axial view of major differences: hot red color represents decreased activities in aMCI (t score range is from 2.98 to 7.18) and cold blue color represents increased activities in aMCI (t score range is from 2.98 to 5.91); (B) Coronal view of the decreased activities in left MTL for aMCI from posterior to anterior slices. The aMCI subjects show decreased activities in left MTL, LPFC, PCC/retrosplenial cortex (RC)/Precuneus, left medial temporal gyrus (MTG), and right AG, while increased activities in MCC, MPFC, and left inferior parietal lobe (IPL).
Table 2.
Summary of regions in DMN with significantly decreased activity in aMCI compared to normal controls
| Region | L/R | Brodmann area | Peak location MNI coordinates(mm) | t | Cluster Size(Voxel) |
|---|---|---|---|---|---|
| Lateral Prefrontal Cortex | L | 8,9 | −26,18,60 | 6.4755 | 115 |
| Lateral Prefrontal Cortex | R | 8,9 | 26,30,36 | 3.9139 | 79 |
| Hippocampus | L | −30, −12, −22 | 4.1999 | 36 | |
| Parahippocampal Gyrus | L | 36 | −30, −26, −20 | 6.3405 | 58 |
| Fusiform Gyrus | L | 37 | −32, −26, −18 | 7.1757 | 223 |
| Posterior Cingulate Cortex/Retrosplenial Cortex/Precuneus* | B | 23,30 | −6, −60,22 | 5.9241 | 191 |
| Medial Temporal Gyrus | L | 21 | −54, 4, −12 | 5.2713 | 64 |
| Angular Gyrus | R | 39 | 48, −72,30 | 5.5209 | 105 |
L=Left; R=Right; B=Bilateral; MNI=Montréal Neurological Institute.
The peak location is on the left side of posterior cingulate cortex/retrosplenial cortex/precuneus, but the whole cluster spreads on both left and right sides.
Table 3.
Summary of regions in DMN with significantly increased activity in aMCI compared to normal controls
| Region | L/R | Brodmann area | Peak location MNI coordinates (mm) | t | Cluster size(Voxel) |
|---|---|---|---|---|---|
| Medial Prefrontal Cortex* | B | 9 | 8,46,36 | 3.0307 | 35 |
| Inferior Parietal Lobe | L | 40 | −46, −42,54 | 2.9933 | 54 |
| Middle Cingulate Cortex | L | 23 | −2, −30,36 | 2.9832 | 117 |
| Middle Cingulate Cortex | R | 23 | 4, −28,36 | 2.9810 | 155 |
L=Left; R=Right; B=Bilateral; MNI=Montréal Neurological Institute.
The peak location is on the right side of medial prefrontal cortex, but the whole cluster spreads on both left and right sides.
To investigate whether there was a trend of decreased MTL activity bilaterally in aMCI, we lowered the t threshold using uncorrected p<0.03 and cluster size 34 voxels and showed results in Figure 4. At this lowered threshold, bilateral decreased activities (aMCI<normal controls) can be found in MTL.
Figure 4.
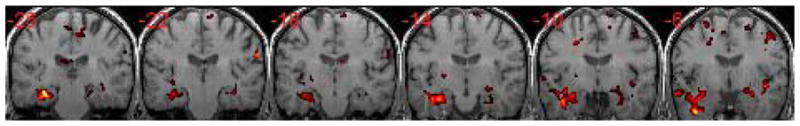
Bilateral decreased activities (aMCI<normal control) can be found in MTL at the lowered threshold (uncorrected p<0.03 and the cluster size ≥ 34).
As shown in Figure 5, the average MTL volume and standard deviation are 8370.44 mm3 and 1404.56 mm3 for normal controls, and 8698.18 mm3 and 1702.49 mm3 for aMCI subjects. The difference is not statistically significant (p=0.68) using a two-sample t-test.
Figure 5.

The medial temporal lobe (MTL) volume comparison between age-matched normal controls (NOM) and aMCI. The MTL region including hippocampus, entorhinal cortex, perirhinal cortex, and parahippocampal gyrus was delineated slice-by-slice in each subject’s high resolution T2 image by a trained professional. The two-sample t-test on the MTL volumes of two groups were not statistically significant (p=0.68).
Using twelve peak locations in Table 2 and Table 3 as centers, we calculated the average activity in 6mm×6mm×6mm cubes from each individual DMN component and regressed them on specific neuropsychological test scores for memory for all subjects. Results are shown in Figure 6 for working memory (CVLT Trial 1) (a), delayed recall (CVLT long delayed recall) (b), and learning efficiency (CVLT Total) (c). In each subplot the abscissa is the test score expressed as a standardized score and the ordinate is the average functional activity. A statistically significant dependence of resting-state activity on memory scores was observed for certain DMN regions (denoted by “*”) for delayed recall and learning efficiency, but not for any DMN regions for working memory scores. Activity within the left lateral prefrontal cortex (L LPFC), left medial temporal gyrus (L MTG), and right angular gyrus (R AG) were positively correlated with memory scores for both delayed recall (b) and learning efficiency (c) with p<0.05. In other words, functional activity decreased as a function of decreasing memory scores in these regions. Other regions close to significance level are left hippocampus (L HC), left parahippocampal gyrus (L PHG), and left fusiform gyrus (L FG) with 0.05<p<0.1 for delayed recall and learning efficiency. Correlation analysis among the three test scores revealed significant linear dependence between delayed recall and learning efficiency (r=0.8443, p=0.000034) and between working memory and learning efficiency (r=0.5210, p=0.0364), but not between working memory and delayed recall (r=0.4663, p=0.0623).
Figure 6.


Relationship between resting-state activities of the DMN and specific memory test scores using least-squares linear regression. Using twelve peak locations in Table 2 and Table 3 as centers, average activity (normalized to variance of the fluctuation) in 6mm×6mm×6mm cubes from each individual DMN component were used as representations of resting-state activities and regressed on neuropsychological test scores for working memory (a), delayed recall (b), and learning efficiency (c), which are expressed as standardized scores. In each subplot, the abscissa is the test score and the ordinate is the average activity. The red dots represent aMCI subjects and the blue dots represent normal control subjects. Significance with uncorrected p<0.05 (as noted by “*” in the plots), was seen for positive correlations between functional activity in the left lateral prefrontal cortex (L LPFC), left medial temporal gyrus (L MTG), and right angular gyrus (R AG) for delayed recall (b) and learning efficiency (c), showing decreasing activity in these regions with decreasing test scores.
Discussion
Comparing the results of our study with previous studies using resting-state fMRI (Sorg et al. 2007, Bai et al. 2008, Qi et al. 2010), there exist consistencies and discrepancies as summarized in Table 4. All studies agree that that activity of the DMN in the posterior cingulate cortex (PCC) is altered in aMCI with all studies revealing decreased activity compared to normal controls. Since the PCC is the posterior hub of the DMN (Buckner et al. 2008, Andrews-Hanna et al. 2010) and the site of early metabolic abnormalities in Alzheimer’s disease (Minoshima et al. 1997), its altered resting-state activity seems to be a meaningful functional hallmark to distinguish aMCI from healthy controls. Both Qi et al. (2010) and the present study found increased activities in medial prefrontal cortex (MPFC), which is an anterior hub of the DMN, and decreased activities in fusiform gyrus (FG), although findings in the lateral frontal lobes, inferior parietal lobe (IPL) and medial temporal gyrus (MTG) are not concordant. The current study also yielded new differences between aMCI and healthy controls in MTL, middle cingulate cortex (MCC), and angular gyrus (AG).
Table 4.
Comparison of major findings in studies of resting-state DMN activity in aMCI groups compared to normal controls
| Present | Sorg2007 | Bai2008 | Qi2010 | |
|---|---|---|---|---|
| Subjects | aMCI | aMCI | aMCI | aMCI |
| Posterior Cingulate Cortex/Precuneus | −B | −L | −B | −B |
| Inferior Parietal Lobe | +L | +R | −R,+L | |
| Medial Temporal Lobe(hippocampus, entorhinal cortex, perirhinal cortex, parahippocampal gyrus) | −L | * | ||
| Fusiform Gyrus | −L | +R | −L | |
| Lateral Prefrontal Cortex | −B | −R | +L | |
| Medial Prefrontal Cortex | +B | +B | ||
| Middle Cingulate Cortex | +B | |||
| Medial Temporal Gyrus | −L | +L | ||
| Angular Gyrus | −R | |||
| Putamen | +B |
“−”= decreased activities in aMCI; “+”= increased activities in aMCI; L=Left; R=Right; B=Bilateral.
In addition to altered activity in DMN discovered by ICA, a ROI correlation analysis revealed that functional connectivity between both sides of hippocampus and left posterior cingulate cortex was absent in aMCI (Sorg et al. 2007).
The internal mentation hypothesis that DMN (Andreasen et al. 1995, Rilling et al. 2004, Saxe & Powell 2006, Buckner & Carroll 2007, Schacter et al. 2008, Andrews-Hanna et al. 2010) is involved in remembering the past, envisioning the future, and mediating the perspectives of others is supported by evidence that the DMN overlaps with regions that are active during episodic memory function (Greicius et al 2004, Buckner et al. 2005, Vincent et al. 2006). Reduced activity in the PCC in AD is attributed to damaged connectivity between the MTL and PCC (Greicius et al 2004, Wang et al. 2006). Greicius et al. (2009) determined the fiber tracts from MTL to RC as well as from PCC to MPFC using DTI tractography and suggested an information flow originating from MTL, through RC to adjacent PCC, and finally ending in MPFC. This hypothesis is consistent with the histological finding that the pathological origin of AD is in MTL (Braak & Braak, 1991). Therefore, the decreased activity in MTL can trigger a cascade of abnormalities in PCC and MPFC. Although reduced PCC activity is consistently observed in prior aMCI studies of the DMN, reduced MTL is not. Interestingly, we found the coexistence of reduced activities in both MTL and PCC, which is in agreement with absent functional connectivity in aMCI discovered by Sorg et al. (2007) using ROI-based correlation analysis (Table 4). We speculate that the abnormal activity in MTL occurs earlier than that in PCC, but may be difficult to detect. In part, our success may have been due to acquisition of oblique-coronal slices perpendicular to the long axis of the hippocampus, which allowed us to obtain more specific information for MTL with fewer susceptibility artifacts. In addition, the non-significant difference in MTL volume between aMCI and controls, despite the resting state functional DMN differences, indicates that the functional abnormalities may occur before structural atrophy is measurable. This is quite different from Sorg et al. (2007), where their aMCI group had statistically significant reduced gray matter volume in MTL and the structural abnormalities were deemed as the cause of reduced functional connectivity. Additional studies will be useful to investigate whether DMN changes in the PCC and MTL, even in the absence of significant MTL atrophy, are reliable indicators of aMCI and/or progression to dementia. It is worthwhile noting that Li et al. (2002) studied functional synchrony of the hippocampus, defined and quantified as the mean of the cross-correlation coefficients of spontaneous low frequency components (COSLOF), in AD, MCI and healthy controls. The COSLOF index in the hippocampus, but not in the primary visual cortex, was significantly different in three testing groups and has potential as a noninvasive marker for the preclinical stage of AD.
In agreement with findings by Qi et al. (2010), aMCI subjects in our study also demonstrated reduced FG activity of the DMN. Although the exact functional meaning of FG fMRI BOLD activity is debated, there is consensus on its importance in memory-related function in recognition, particularly in face recognition (McCarthy et al. 1997). Powell et al. (2004) discovered connections between FG and the parahippocampal gyrus (PHG) using MR tractography techniques. Anatomically, FG is adjacent to the parahippocampal cortex (posterior) and perirhinal cortex (anterior) and can feed information into these two areas, which are connected to the hippocampus through the entorhinal cortex (Preston & Wagner 2007). It should be no surprise that FG serves as a part of the integrated system of memory processes during resting states. Reduced FG activity may be an “accessory” indicator of impaired memory function associated with aMCI.
The finding of increased activities in the DMN in aMCI subjects supports a compensatory hypothesis proposed in aging and AD (Bookheimer et al. 2000, Buckner 2004). Areas recruited in the presence of impaired DMN functions are not likely to be the same for everyone, although regions within the frontal and parietal lobes have been consistently reported (Anderson et al. 2000, Cabeze et al. 2002, Logan et al. 2002, Grady et al. 2002, Pariente et al. 2005, Gould et al. 2006). Consistencies and discrepancies in regions with increased activities for aMCI in different studies are noted in Table 4. For IPL, increased activity was reported on the right side by Bai et al. (2008) but on the left side by Qi et al. (2010) and in the present study. Findings of increased left MTG activity and extended activity into MCC were only found in Qi et al. (2010) and in our study, respectively. Based on these findings, increased DMN activity alone at a focal region may not be adequate to indicate aMCI or progression of abnormal aging, although the inferior parietal lobe deserves further study in this regard.
A major reason for these inconsistent findings may be due to the heterogeneity of aMCI subjects (Petersen 2004). It was suggested by memory studies (Rombouts et al. 2000, Kato et al. 2001, Sperling et al. 2003, Machulda et al. 2003, Dickerson et al. 2004, 2005, Hämäläinen et al. 2007) that initially increased activity occurs in the MTL to compensate for a functional deficiency followed by hypoactivity in the MTL as pathological progression to AD occurs. Other regions of the DMN may show similar pattern of activity changes. Thus, it is conceivable that more consistent conclusions can be found by studying functional activity of the MTL in aMCI groups over several time points with correlation to the degree of memory impairment. This longitudinal study will allow DMN activity to be correlated to the stage of functional impairment to AD and not just to the designation of aMCI. Because the functional impairment of the MTL in aMCI is generally unknown, longitudinal studies with survival analyses would be essential to investigate the course of cognitive degeneration along the aging-MCI-AD progression timeline.
We carried out an additional investigation to shed some light on the question of whether resting-state DMN activities are correlated to the degree of impairment using neuropsychological test scores for all subjects. Our results demonstrate that there is a notable linear dependence of resting-state activity patterns in some regions of the DMN (left lateral prefrontal cortex, left medial temporal gyrus, and right angular gyrus) and memory test scores for delayed recall and learning efficiency, but not for working memory. The lack of statistical significance in some regions may be caused by the small sample size or by a nonlinear relationship between test scores and resting-state activities. In addition, we speculate that resting-state functional activity may provide additional information not captured entirely by memory scores. The complexity of information conveyed by resting-state activities and how it changes with cognition has to be fully investigated before it can be used as a routine imaging marker for monitoring cognitive decline of aMCI. However, aberrant DMN functional patterns using resting-state fMRI has potential as an imaging marker for aMCI and progression to dementia and it has the advantage of being less demanding than task-related fMRI scans and is non-invasive compared with nuclear imaging. Nevertheless, the development of an fMRI imaging marker for diagnosis of aMCI and prediction of AD may rely on cross validation with other imaging modalities, such as structural MRI and PET amyloid beta peptide imaging, as well as cerebrospinal and serum fluid examinations.
Another reason for discrepancies between studies may be the different resting-state fMRI data acquisition methods. The most exceptional finding of the present study is that aMCI showed decreased left MTL activities of the DMN (Figure 3) as well as a trend of bilateral decreased activities in MTL (Figure 4), which implicates that resting-state activity on both sides of the MTL may be affected. Our imaging technique was optimized by using a coronal oblique EPI slice acquisition perpendicular to the long axis of the hippocampus. The advantage of such a slice orientation is that susceptibility artifacts are reduced as shown in Figure 1. Furthermore, we used a fairly long resting-state fMRI sequence (2 sec TR sampling period over more than 9 minutes duration), which may provide a more reliable ICA analysis. Although 5 minutes of scanning time has been suggested to be sufficient with respect to the stability for ROI-based correlation methods (Van Dijk et al. 2010), our experience is that more temporal points will provide more robust resting-state maps using ICA.
A majority of applications of ICA to fMRI use Infomax since the sources of interest in this case are super-Gaussian in nature and the algorithm favors separation of super-Gaussian sources. Correa et al. (2007) compared a number of ICA approaches (Infomax (Bell and Sejnowski, 1995), FastICA (Hyvärinen and Oja, 1997), and JADE (Cardoso and Souloumiac, 1993)) using a task related paradigm. Their comparison study showed that all ICA algorithms yield consistent and reliable results. Therefore, outliers seem not to be a concern for these approaches. They also found that Infomax yields results that appear to be the best with highest t values. However, a recently developed ICA algorithm, named Combi ICA (Tichavský et al. 2006), was not used in their work. To understand how sensitive the findings are to the choice of algorithm, we used Infomax, extended Infomax (Lee et al., 1999) (which is suitable for separation of both super-gaussian and sub-gaussian sources), and also Combi ICA for our resting-state fMRI data. The group differences from three ICA algorithms are largely in agreement (similar to Figure 3), which indicates that our findings are not sensitive to the choice of ICA algorithms.
Although ICA has appealing advantages over ROI-based correlation methods in terms of avoiding bias introduced by prior seed choice and the necessity of pre-cleanup of confounding noise, it faces several challenges, and the prominent one is to determine the number of independent components (IC). Too many ICs may split the interested network into several pieces, while too few ICs may mix the interested network with other networks or confounding components. In this study, we used the MDL criterion (Calhoun et al. 2001) to estimate the number of ICs for each subject and used the median IC number of each group for group-ICA. We note that the MDL criterion may still be an overestimate of the true number of ICA components due to the fact that MDL does not account for correlated noise properties that are known to exist in fMRI data (Cordes and Nandy 2006). Even if the optimal number of ICs can be found for a given dataset based on statistical criteria, they may not reflect the “best” model order for the underlying neurophysiology of multiple distributed systems (Cole et al. 2010). High dimensionality of ICA decomposition recently advocated (Kiviniemi et al. 2009, Smith et al. 2009) may provide a viable solution to this problem, but its robustness is restricted by the length of fMRI series. To investigate whether the DMN component was split into multiple components, we took the time course of the DMN and correlated it with time courses of the other 39 independent components. The highest correlation coefficient was 0.4266 for normal subjects and 0.5553 for aMCIs. To further investigate whether DMN activity has been spread among components differently in one group versus the other, we used the two-sample Kolmogorov-Smirnov test to compare the distributions of correlation coefficients in the two groups. The resultant p value of 0.22 cannot reject the null hypothesis that two samples are drawn from the same distribution. Therefore, it is reasonable to believe that there is no significant splitting of the DMN and the spread of DMN activity is similar in the two groups.
Temporal fluctuations of resting-state networks have unique frequency characteristics (Cordes et al. 2000, 2001). We used each individual’s DMN time course to calculate “fractional amplitude of low frequency fluctuations” (fALFF) as proposed by Zou et al. (2008), which was defined as the ratio of the amplitude sum across the 0.01–0.08 Hz range over the whole frequency range (0–0.25 Hz) in our study, because fALFF is less sensitive to the physiological noise than the direct use of amplitude of low frequency fluctuations (ALFF). The difference of fALFF between the aMCI and control group was tested by a two-sample t-test and turned out to be non-significant (p=0.93). This frequency analysis demonstrated that the characteristic measured by fALFF was similar in both groups and incapable of discriminating the groups. Nevertheless, this negative finding should not exclude future investigation to identify non-stationary time-frequency features of the DMN that may be used to distinguish between different groups (Chang and Glover 2010).
Extensive studies with fMRI have shown that the DMN can be identified as a pattern of resting-state functional activity/connectivity (e.g. Greicius et al. 2003, Fox et al. 2005, Fransson 2005, Damoiseaux et al. 2006, Vincent et al. 2006) as well as a goal-directed task-induced deactivations (e.g. Esposito et al. 2006, Greicius and Menon 2004, Harrison et al. 2007, Mckiernan et al. 2003). However, the precise meaning of DMN activity with respect to behavior is not well defined despite some indirect associations with activations evoked by tasks that enhance subject’s self-attention (Buckner and Carroll 2007, Greicius et al. 2003, Gusnard et al. 2001, Northoff et al. 2006, Pujol et al. 2007). A recent study by Harrison et al. (2008) confirmed that a strong overlap exists in the DMN using resting-state connectivity, deactivation during a Stroop task (not associated with the self-referential mental process), and activation during a moral dilemma paradigm (associated with the self-referential process). Rombouts et al. (2005) used task-induced deactivations to study abnormal changes of aMCI subjects in the DMN. Their results demonstrated that aMCI subjects had less deactivation compared to healthy controls in the anterior medial frontal cortex. Their findings may implicate that either the “baseline” activity of aMCI subjects in the DMN are higher than normal controls, or the task suppresses less spontaneous activity of DMN, or both. Our finding of increased resting-state activity in the medial prefrontal cortex (see Table 3) for aMCI likely confirmed the first implication.
Other issues in resting-state fMRI data acquisition and analysis that have not been addressed by this study are the optimal experimental setting and the physiological noise cleanup. There is no consensus whether subjects should be asleep or awake, with eyes open or closed (Marx et al. 2004, Horovitz et al. 2008, Bianciardi et al. 2009). Recent studies (Fukunaga et al. 2006, Horovitz et al. 2009) demonstrated the relative stability of resting-state networks through various sleep states. For single subject analysis, ICA can identify confounding factors of physiological noise (Kiviniemi et al. 2003 2009, Beckmann et al. 2005, De Luca et al. 2006, Birn et al. 2008). However, at the group level, ICA may benefit from removal of physiological noise (Biswal et al. 2010). We also like to point out that only eight subjects in each group were used in this preliminary cross-sectional study. More subjects, or a longitudinal study, are needed to confirm the findings and hypotheses generated from this research. These technical considerations may further improve to reliably discriminate aMCI from normal aging individuals.
Conclusion
Using group ICA on resting-state fMRI data, we found that the amnestic mild cognitive impairment group had decreased activities in lateral prefrontal cortex, left medial temporal lobe, posterior cingulate cortex/retrosplenial cortex/precuneus, left medial temporal gyrus, and right angular gyrus, and increased activity in middle cingulate cortex, medial prefrontal cortex, and left inferior parietal lobe. These findings support the possibility that DMN alterations, particularly decreased activity in the posterior cingulate cortex and medial temporal lobe and increased activity in inferior parietal lobe, could be indicative of alterations in intrinsic brain architecture leading to functional deficiencies and compensatory changes seen in aMCI. Using an fMRI imaging protocol such that the slice acquisition is perpendicular to the long axis of the hippocampus, decreased activity in left MTL was observed for aMCI without statistically significant MTL volume differences between the two groups. A correlation between resting-state activities and memory tests suggests that resting-state fMRI should be explored further as a potential marker of cognitive decline.
Footnotes
Publisher's Disclaimer: This is a PDF file of an unedited manuscript that has been accepted for publication. As a service to our customers we are providing this early version of the manuscript. The manuscript will undergo copyediting, typesetting, and review of the resulting proof before it is published in its final citable form. Please note that during the production process errors may be discovered which could affect the content, and all legal disclaimers that apply to the journal pertain.
References
- Anderson ND, Iidaka T, Cabeza R, Kapur S, McIntosh AR, Craik FI. The effects of divided attention on encoding- and retrieval-related brain activity: a PET study of younger and older adults. J Cogn Neurosci. 2000;12:775–792. doi: 10.1162/089892900562598. [DOI] [PubMed] [Google Scholar]
- Andreasen NC, O’Leary DS, Cizadlo T, Arndt S, Rezai K, et al. Remembering the past: two facets of episodic memory explored with positron emission tomography. Am J Psychiatry. 1995;152:1576–85. doi: 10.1176/ajp.152.11.1576. [DOI] [PubMed] [Google Scholar]
- Andrews-Hana JR, Reidler JS, Huang C, Buckner RL. Evidence for the default network’s role in spontaneous cognition. J Neurophysiol. 2010 doi: 10.1152/jn.00830.2009. in press. [DOI] [PMC free article] [PubMed] [Google Scholar]
- Bai F, Zhang Z, Yu H, Shi Y, Yuan Y, Zhu W, Zhang X, Qian Y. Default-mode network activity distinguishes amnestic type mild cognitive impairment from healthy aging: A combined structural and resting-state functional MRI study. Neuroscience letters. 2008;438:111–115. doi: 10.1016/j.neulet.2008.04.021. [DOI] [PubMed] [Google Scholar]
- Baker SC, Rogers RD, Owen AM, Frith CD, Dolan RJ, et al. Neural systems engaged by planning: a PET study of the Tower of London task. Neuropsychologia. 1996;34:515–26. doi: 10.1016/0028-3932(95)00133-6. [DOI] [PubMed] [Google Scholar]
- Beckmann CF, Smith SM. Tensorial extensions of independent component analysis for multisubject FMRI analysis. Neuroimage. 2005;25:294–311. doi: 10.1016/j.neuroimage.2004.10.043. [DOI] [PubMed] [Google Scholar]
- Bell AJ, Sejnowski TJ. An information maximisation approach to blind separation and blind deconvolution. Neural Computation. 1995;7:1129–1159. doi: 10.1162/neco.1995.7.6.1129. [DOI] [PubMed] [Google Scholar]
- Bianciardi M, Fukunaga M, van Gelderen P, Horovitz SG, de Zwart JA, Duyn JH. Modulation of spontaneous fMRI activity in human visual cortex by behavioral state. Neuroimage. 2009;45:160–168. doi: 10.1016/j.neuroimage.2008.10.034. [DOI] [PMC free article] [PubMed] [Google Scholar]
- Birn RM, Murphy K, Bandettini PA. The effect of respiration variations on independent component analysis results of resting-state functional connectivity. Hum Brain Mapp. 2008;29:740–750. doi: 10.1002/hbm.20577. [DOI] [PMC free article] [PubMed] [Google Scholar]
- Biswal B, Yetkin FZ, Haughton VM, Hyde JS. Functional connectivity in the motor cortex of resting human brain using echo-planar MRI. Magn Reson Med. 1995;34:537–541. doi: 10.1002/mrm.1910340409. [DOI] [PubMed] [Google Scholar]
- Biswal BB, Mennes M, Zuo XN, Gohel S, Kelly C, Smith SM, Beckmann CF, Adelstein JS, Buckner RL, Colcombe S, Dogonowski AM, Ernst M, Fair D, Hampson M, Hoptman MJ, Hyde JS, Kiviniemi VJ, Kötter R, Li SJ, Lin CP, Lowe MJ, Mackay C, Madden DJ, Madsen KH, Margulies DS, Mayberg HS, McMahon K, Monk CS, Mostofsky SH, Nagel BJ, Pekar JJ, Peltier SJ, Petersen SE, Riedl V, Rombouts SA, Rypma B, Schlaggar BL, Schmidt S, Seidler RD, Siegle GJ, Sorg C, Teng GJ, Veijola J, Villringer A, Walter M, Wang L, Weng XC, Whitfield-Gabrieli S, Williamson P, Windischberger C, Zang YF, Zhang HY, Castellanos FX, Milham MP. Towards discovery science of human brain function. Proc Natl Acad Sci USA. 2010;102:4734–4739. doi: 10.1073/pnas.0911855107. [DOI] [PMC free article] [PubMed] [Google Scholar]
- Bookheimer SY, Strojwas MH, Cohen MS, Saunders AM, Pericak-Vance MA, Mazziotta JC, Small GW. Patterns of brain activation in people at risk for Alzheimer’s disease. N Engl J Med. 2000;343:450–456. doi: 10.1056/NEJM200008173430701. [DOI] [PMC free article] [PubMed] [Google Scholar]
- Braak H, Braak E. Neuropathological stageing of Alzheimer-related changes. Acta Neuropathol. 1991;82:239–259. doi: 10.1007/BF00308809. [DOI] [PubMed] [Google Scholar]
- Buckner RL. Memory and executive function in aging and AD: multiple factors that cause decline and reserve factors that compensate. Neuron. 2004;44:195–208. doi: 10.1016/j.neuron.2004.09.006. [DOI] [PubMed] [Google Scholar]
- Buckner RL, Snyder AZ, Shannon BJ, LaRossa G, Sachs R, et al. Molecular, structural, and functional characterization of Alzheimer’s disease: evidence for a relationship between default activity, amyloid, and memory. J Neurosci. 2005;25:7709–17. doi: 10.1523/JNEUROSCI.2177-05.2005. [DOI] [PMC free article] [PubMed] [Google Scholar]
- Buckner RL, Carroll DC. Self-projection and the brain. Trends Cogn Sci. 2007;11:49–57. doi: 10.1016/j.tics.2006.11.004. [DOI] [PubMed] [Google Scholar]
- Buckner RL, Andrews-Hana JR, Schacter DL. The brain’s Default network: anatomy, function and relevance to disease. Ann NY Acad Sci. 2008;1124:1–38. doi: 10.1196/annals.1440.011. [DOI] [PubMed] [Google Scholar]
- Burggren AC, Zeineh MM, Ekstrom AD, Braskie MN, Thompson PM, Small GW, Bookheimer SY. Reduced cortical thickness in hippocampal subregions among cognitively normal apolipoprotein E e4 carriers. Neuroimage. 2008;41(4):1177–83. doi: 10.1016/j.neuroimage.2008.03.039. [DOI] [PMC free article] [PubMed] [Google Scholar]
- Cabeza R, Anderson ND, Locantore JK, McIntosh AR. Aging gracefully: compensatory brain activity in high-performing older adults. Neuroimage. 2002;17:1394–1402. doi: 10.1006/nimg.2002.1280. [DOI] [PubMed] [Google Scholar]
- Calhoun VD, Adali T, Pearlson GD, Pekar JJ. A method for making group inferences from functional MRI data using independent component analysis. Hum Brain Mapp. 2001;14:140–151. doi: 10.1002/hbm.1048. [DOI] [PMC free article] [PubMed] [Google Scholar]
- Cardoso JF, Souloumiac A. Blind beamforming for non Gaussian signals. IEE Proceedings. 1993;140:362–70. [Google Scholar]
- Chang C, Glover GH. Time-frequency dynamics of resting-state brain connectivity measured with fMRI. Neuroimage. 2010;50:81–98. doi: 10.1016/j.neuroimage.2009.12.011. [DOI] [PMC free article] [PubMed] [Google Scholar]
- Cole DM, Smith SM, Beckmann CF. Advances and pitfalls in the analysis and interpretation of resting-state FMRI data. Frontiers in Systems Neuroscience. 2010;4:Article 8, 1–15. doi: 10.3389/fnsys.2010.00008. [DOI] [PMC free article] [PubMed] [Google Scholar]
- Cordes D, Haughton VM, Arfanakis K, Wendt GJ, Turski PA, Moritz CH, Quigley MA, Meyerand ME. Mapping functionally related regions of brain with functional connectivity MR imaging. Am J Neuroradiol. 2000;21:1636–1644. [PMC free article] [PubMed] [Google Scholar]
- Cordes D, Haughton VM, Arfanakis K, Carew JD, Turski PA, Moritz CH, Quigley MA, Meyerand ME. Frequencies contributing to functional connectivity in the cerebral cortex in ‘resting-state’ data. Am J Neuroradiol. 2001;22:1326–1333. [PMC free article] [PubMed] [Google Scholar]
- Cordes D, Nandy R. Estimation of the Intrinsic Dimensionality of fMRI Data. Neuroimage. 2006;29:145–154. doi: 10.1016/j.neuroimage.2005.07.054. [DOI] [PubMed] [Google Scholar]
- Correa N, Adali T, Calhoun VD. Performance of Blind Source Separation Algorithms for fMRI Analysis. MagResImag. 2007;25:684–694. doi: 10.1016/j.mri.2006.10.017. [DOI] [PMC free article] [PubMed] [Google Scholar]
- Cox RW. AFNI: Software for analysis and visualization of functional magnetic resonance neuroimages. Comput Biomed Res. 1996;29:162–173. doi: 10.1006/cbmr.1996.0014. [DOI] [PubMed] [Google Scholar]
- Damoiseaux JS, Rombouts SA, Barkhof F, Scheltens P, Stam CJ, et al. Consistent resting-state networks across healthy subjects. Proc Natl Acad Sci USA. 2006;103:13848–53. doi: 10.1073/pnas.0601417103. [DOI] [PMC free article] [PubMed] [Google Scholar]
- De Luca M, Beckmann CF, De Stefano N, Matthews PM, Smith SM. fMRI resting state networks define distinct modes of long-distance interactions in the human brain. Neuroimage. 2006;29:1359–1367. doi: 10.1016/j.neuroimage.2005.08.035. [DOI] [PubMed] [Google Scholar]
- Dickerson BC, Salat DH, Bates JF, Atiya M, Killiany RJ, Greve DN, Dale AM, Stern CE, Blacker D, Albert MS, Sperling RA. Medial temporal lobe function and structure in mild cognitive impairment. Ann Neurol. 2004;56:27–35. doi: 10.1002/ana.20163. [DOI] [PMC free article] [PubMed] [Google Scholar]
- Dickerson BC, Salat DH, Greve DN, Chua EF, Rand-Giovannetti E, Rentz DM, Bertram L, Mullin K, Tanzi RE, Blacker D, Albert MS, Sperling RA. Increased hippocampal activation in mild cognitive impairment compared to normal aging and AD. Neurology. 2005;65:404–411. doi: 10.1212/01.wnl.0000171450.97464.49. [DOI] [PMC free article] [PubMed] [Google Scholar]
- Esposito F, Bertolino A, Scarabino T, Latorre V, Blasi G, Popolizio T, Tedeschi G, Cirillo S, Goebel R, Di Salle F. Independent component model of the default-mode brain function: Assessing the impact of active thinking. Brain Res Bull. 2006;70:263–269. doi: 10.1016/j.brainresbull.2006.06.012. [DOI] [PubMed] [Google Scholar]
- Fox MD, Snyder AZ, Vincent JL, Corbetta M, Van Essen DC, Raichle ME. The human brain is intrinsically organized into dynamic, anticorrelated functional networks. Proc Natl Acad Sci U S A. 2005;102:9673–9678. doi: 10.1073/pnas.0504136102. [DOI] [PMC free article] [PubMed] [Google Scholar]
- Fox MD, Corbetta M, Snyder AZ, Vincent JL, Raichle ME. Spontaneous neuronal activity distinguishes human dorsal and ventral attention systems. Proc Natl Acad Sci U S A. 2006;103:10046–10051. doi: 10.1073/pnas.0604187103. [DOI] [PMC free article] [PubMed] [Google Scholar]
- Fransson P. Spontaneous low-frequency BOLD signal fluctuations: an fMRI investigation of the resting-state default mode of brain function hypothesis. Hum BrainMapp. 2005;26:15–29. doi: 10.1002/hbm.20113. [DOI] [PMC free article] [PubMed] [Google Scholar]
- Fukunaga M, Horovitz SG, van Gelderen P, de Zwart JA, Jansma JM, Ikonomidou VN, Chu R, Deckers RH, Leopold DA, Duyn JH. Large-amplitude, spatially correlated fluctuations in BOLD fMRI signals during extended rest and early sleep stages. Magn Reson Imaging. 2006;24:979–992. doi: 10.1016/j.mri.2006.04.018. [DOI] [PubMed] [Google Scholar]
- Ghatan PH, Hsieh JC, Wirsen-Meurling A, Wredling R, Eriksson L, et al. Brain activation induced by the perceptual maze test: a PET study of cognitive performance. Neuroimage. 1995;2:112–24. doi: 10.1006/nimg.1995.1014. [DOI] [PubMed] [Google Scholar]
- Gould RL, Arroyo B, Brown RG, Owen AM, Bullmore ET, Howard RJ. Brain mechanisms of successful compensation during learning in Alzheimer disease. Neurology. 2006;67:1011–1017. doi: 10.1212/01.wnl.0000237534.31734.1b. [DOI] [PubMed] [Google Scholar]
- Grady CL, Furey ML, Pietrini P, Horwitz B, Rapoport SI. Altered functional connectivity and impaired short-term memory in Alzheimer’s disease. Brain. 2001;124:739–756. doi: 10.1093/brain/124.4.739. [DOI] [PubMed] [Google Scholar]
- Grady CL, Bernstein LJ, Beig S, Siegenthaler AL. The effects of encoding task on age-related differences in the functional neuroanatomy of face memory. Psychol Aging. 2002;17:7–23. doi: 10.1037//0882-7974.17.1.7. [DOI] [PubMed] [Google Scholar]
- Greicius MD, Krasnow B, Reiss AL, Menon V. Functional connectivity in the resting brain: a network analysis of the default mode hypothesis. Proc Natl Acad Sci USA. 2003;100:253–8. doi: 10.1073/pnas.0135058100. [DOI] [PMC free article] [PubMed] [Google Scholar]
- Greicius MD, Menon V. Default-mode activity during a passive sensory task: uncoupled from deactivation but impacting activation. J Cogn Neurosci. 2004;16:1484–92. doi: 10.1162/0898929042568532. [DOI] [PubMed] [Google Scholar]
- Greicius MD, Srivastava G, Reiss AL, Menon V. Default-mode network activity distinguishes Alzheimer’s disease from healthy aging: evidence from functional MRI. Proc Natl Acad Sci USA. 2004;101:4637–42. doi: 10.1073/pnas.0308627101. [DOI] [PMC free article] [PubMed] [Google Scholar]
- Greicius MD, Supekar K, Menon V, Dougherty RF. Resting-state functional connectivity reflects structural connectivity in the default mode network. Cereb Cortex. 2009;19:72–78. doi: 10.1093/cercor/bhn059. [DOI] [PMC free article] [PubMed] [Google Scholar]
- Gusnard DA, Akbudak E, Shulman GL, Raichle ME. Medial prefrontal cortex and self-referential mental activity: Relation to a default mode of brain function. Proc Natl Acad Sci USA. 2001;98:4259–4264. doi: 10.1073/pnas.071043098. [DOI] [PMC free article] [PubMed] [Google Scholar]
- Hämäläinen A, Pihlajamäki M, Tanila H, Hänninen T, Niskanen E, Tervo S, Karjalainen PA, Vanninen RL, Soininen H. Increased fMRI responses during encoding in mild cognitive impairment. Neurobiol Aging. 2007;28:1889–1903. doi: 10.1016/j.neurobiolaging.2006.08.008. [DOI] [PubMed] [Google Scholar]
- Harrison BJ, Yucel M, Pujol J, Pantelis C. Task-induced deactivation of midline cortical regions in schizophrenia assessed with fMRI. Schizophr Res. 2007;91:82–86. doi: 10.1016/j.schres.2006.12.027. [DOI] [PubMed] [Google Scholar]
- Harrison BJ, Pujol J, López-Solà M, Hernández-Ribas R, Deus J, Ortiz H, Soriano-Mas C, Yücel M, Pantelis C, Cardoner N. Consistency and functional specialization in the default mode brain network. Proc Natl Acad Sci U S A. 2008;105(28):9781–6. doi: 10.1073/pnas.0711791105. [DOI] [PMC free article] [PubMed] [Google Scholar]
- Herholz K, Salmon E, Perani D, Baron JC, Holthoff V, et al. Discrimination between Alzheimer dementia and controls by automated analysis of multicenter FDG PET. Neuroimage. 2002;17:302–16. doi: 10.1006/nimg.2002.1208. [DOI] [PubMed] [Google Scholar]
- Horovitz SG, Fukunaga M, de Zwart JA, van Gelderen P, Fulton SC, Balkin TJ, Duyn JH. Low frequency BOLD fluctuations during resting wakefulness and light sleep: a simultaneous EEG-fMRI study. Hum Brain Mapp. 2008;29:671–682. doi: 10.1002/hbm.20428. [DOI] [PMC free article] [PubMed] [Google Scholar]
- Horovitz SG, Braun AR, Carr WS, Picchioni D, Balkin TJ, Fukunaga M, Duyn JH. Decoupling of the brain’s default mode network during deep sleep. Proc Natl Acad Sci USA. 2009;106:11376–11381. doi: 10.1073/pnas.0901435106. [DOI] [PMC free article] [PubMed] [Google Scholar]
- Hyvärinen A, Oja E. A fast fixed-point algorithm for independent component analysis. Neural Comput. 1997;9:1483–92. doi: 10.1142/S0129065700000028. [DOI] [PubMed] [Google Scholar]
- Kato T, Knopman D, Liu H. Dissociation of regional activation in mild AD during visual encoding: a functional MRI study. Neurology. 2001;57:812–816. doi: 10.1212/wnl.57.5.812. [DOI] [PubMed] [Google Scholar]
- Kendall M, Gibbons J. Rank Correlation Methods. Oxford University Press; Oxford: 1990. [Google Scholar]
- Kiviniemi V, Kantola JH, Jauhiainen J, Hyvarinen A, Tervonen O. Independent component analysis of nondeterministic fMRI signal sources. Neuroimage. 2003;19:253–260. doi: 10.1016/s1053-8119(03)00097-1. [DOI] [PubMed] [Google Scholar]
- Kiviniemi V, Starck T, Remes J, Long X, Nikkinen J, Haapea M, Veijola J, Moilanen I, Isohanni M, Zang YF, Tervonen O. Functional segmentation of the brain cortex using high model order group PICA. Hum Brain Mapp. 2009;30:3865–3886. doi: 10.1002/hbm.20813. [DOI] [PMC free article] [PubMed] [Google Scholar]
- Klunk WE, Engler H, Nordberg A, Wang Y, Blomqvist G, et al. Imaging brain amyloid in Alzheimer’s disease with Pittsburgh Compound-B. Ann Neurol. 2004;55:306–19. doi: 10.1002/ana.20009. [DOI] [PubMed] [Google Scholar]
- Lee TW, Girolami M, Sejnowski TJ. Independent component analysis using an extended Infomax algorithm for mixed sub-Gaussian and super-Gaussian sources. Neural Comput. 1999;11(2):417–441. doi: 10.1162/089976699300016719. [DOI] [PubMed] [Google Scholar]
- Li S, Li Z, Wu G, Zhang M, Franczak M, Antuono PG. Alzheimer disease: evaluation of a functional MRI index as a marker. Radiology. 2002;225:253–259. doi: 10.1148/radiol.2251011301. [DOI] [PubMed] [Google Scholar]
- Logan JM, Sanders AL, Snyder AZ, Morris JC, Buckner RL. Underrecruitment and non-selective recruitment: dissociable neural mechanisms associated with aging. Neuron. 2002;33:827–840. doi: 10.1016/s0896-6273(02)00612-8. [DOI] [PubMed] [Google Scholar]
- Lustig C, Snyder AZ, Bhakta M, O’Brien KC, McAvoy M, et al. Functional deactivations: change with age and dementia of the Alzheimer type. Proc Natl Acad Sci USA. 2003;100:14504–9. doi: 10.1073/pnas.2235925100. [DOI] [PMC free article] [PubMed] [Google Scholar]
- Machulda MM, Ward HA, Borowski B, Gunter JL, Cha RH, O’Brien PC, Petersen RC, Boeve BF, Knopman D, Tang-Wai DF, Ivnik RJ, Smith GE, Tangalos EG, Jack CR., Jr Comparison of memory fMRI response among normal, MCI, and Alzheimer’s patients. Neurology. 2003;61:500–506. doi: 10.1212/01.wnl.0000079052.01016.78. [DOI] [PMC free article] [PubMed] [Google Scholar]
- Marx E, Deutschländer A, Stephan T, Dieterich M, Wiesmann M, Brandt T. Eyes open and eyes closed as rest conditions: impact on brain activation patterns. Neuroimage. 2004;21:1818–1824. doi: 10.1016/j.neuroimage.2003.12.026. [DOI] [PubMed] [Google Scholar]
- Mazoyer B, Zago L, Mellet E, Bricogne S, Etard O, et al. Cortical networks for working memory and executive functions sustain the conscious resting state in man. Brain Res Bull. 2001;54:287–98. doi: 10.1016/s0361-9230(00)00437-8. [DOI] [PubMed] [Google Scholar]
- McCarthy G, Puce A, Gore JC, Allison T. Face-specific processing in the human fusform gyrus. J Cognitive Neuroscicence. 1997;9:605–610. doi: 10.1162/jocn.1997.9.5.605. [DOI] [PubMed] [Google Scholar]
- McKiernan KA, Kaufman JN, Kucera-Thompson J, Binder JR. A parametric manipulation of factors affecting task-induced deactivation in functional Neuroimaging. J Cognit Neurosci. 2003;15:394–408. doi: 10.1162/089892903321593117. [DOI] [PubMed] [Google Scholar]
- Minoshima S, Giordani B, Berent S, Frey KA, Foster NL, Kuhl DE. Metabolic reduction in the posterior cingulate cortex in very early Alzheimer’s disease. Ann Neurol. 1997;42:85–94. doi: 10.1002/ana.410420114. [DOI] [PubMed] [Google Scholar]
- Northoff G, Heinzel A, de Greck M, Bermpohl F, Dobrowolny H, Panksepp J. Self-referential processing in our brain-a meta-analysis of imaging studies on the self. NeuroImage. 2006;31:440–457. doi: 10.1016/j.neuroimage.2005.12.002. [DOI] [PubMed] [Google Scholar]
- Palmer K, Backman L, Winblad B, Fratiglioni L. Detection of Alzheimer’s disease and dementia in the preclinical phase: population based cohort study. BMJ. 2003;326:245–249. doi: 10.1136/bmj.326.7383.245. [DOI] [PMC free article] [PubMed] [Google Scholar]
- Pariente J, Cole S, Henson R, Clare L, Kennedy A, Rossor M, Cipoloti L, Puel M, Demonet JF, Chollet F, Frackowiak RS. Alzheimer’s patients engage an alternative network during a memory task. Ann Neurol. 2005;58:870–879. doi: 10.1002/ana.20653. [DOI] [PubMed] [Google Scholar]
- Petersen RC, Smith GE, Waring SC, Ivnik RJ, Tangalos EG, Kokmen E. Mild cognitive impairment: clinical characterization and outcome. Arch Neurol. 1999;56:303–308. doi: 10.1001/archneur.56.3.303. [DOI] [PubMed] [Google Scholar]
- Petersen RC, Doody R, Kurz A, Mohs RC, Morris JC, Rabins PV, Ritchie K, Rossor M, Thal L, Winblad B. Current concepts in mild cognitive impairment. Arch Neurol. 2001;58:1985–1992. doi: 10.1001/archneur.58.12.1985. [DOI] [PubMed] [Google Scholar]
- Petersen RC. Mild cognitive impairment as a diagnostic entity. J Intern Med. 2004;256:183–194. doi: 10.1111/j.1365-2796.2004.01388.x. [DOI] [PubMed] [Google Scholar]
- Petersen RC, Roberts RO, Knopman DS, Boeve BF, Geda YE, Ivnik RJ, Smith GE, Jack CR., Jr Mild cognitive impairment: ten years later. Arch Neurol. 2009;66:1447–1455. doi: 10.1001/archneurol.2009.266. [DOI] [PMC free article] [PubMed] [Google Scholar]
- Powell HW, Guye M, Parker GJ, Symms MR, Boulby P, Koepp MJ, Barker GJ, Duncan JS. Noninvasive in vivo demonstration of the connections of the human PHG. Neuroimage. 2004;22:740–747. doi: 10.1016/j.neuroimage.2004.01.011. [DOI] [PubMed] [Google Scholar]
- Preston AR, Wagner AD. The medial temporal lobe and memory. In: Kesner RP, Martinez JL, editors. Neurobiology of learning and memory. Burlington, MA: Academic Press; 2007. pp. 305–337. [Google Scholar]
- Pujol J, Reixach J, Harrison BJ, Timoneda-Gallart C, Vilanova JC, Pérez-Alvarez F. Posterior cingulate activation during moral dilemma in adolescents. Hum Brain Mapp. 2008;29:910–921. doi: 10.1002/hbm.20436. [DOI] [PMC free article] [PubMed] [Google Scholar]
- Qi Z, Wu X, Wang Z, Zhang N, Dong H, Yao L, Li K. Impairment and compensation coexist in amnestic MCI default mode network. NeuroImage. 2010;50:48–55. doi: 10.1016/j.neuroimage.2009.12.025. [DOI] [PubMed] [Google Scholar]
- Raichle ME, MacLeod AM, Snyder AZ, Powers WJ, Gusnard DA, et al. A default mode of brain function. Proc Natl Acad Sci USA. 2001;98:676–82. doi: 10.1073/pnas.98.2.676. [DOI] [PMC free article] [PubMed] [Google Scholar]
- Reiman EM, Caselli RJ, Yun LS, Chen K, Bandy D, et al. Preclinical evidence of Alzheimer’s disease in persons homozygous for the epsilon 4 allele for apolipoprotein E. N Engl J Med. 1996;334:752–8. doi: 10.1056/NEJM199603213341202. [DOI] [PubMed] [Google Scholar]
- Rilling JK, Sanfey AG, Aronson JA, Nystrom LE, Cohen JD. The neural correlates of theory of mind within interpersonal interactions. Neuroimage. 2004;22:1694–703. doi: 10.1016/j.neuroimage.2004.04.015. [DOI] [PubMed] [Google Scholar]
- Rombouts SA, Barkhof F, Veltman DJ, Machielsen WC, Witter MP, Bierlaagh MA, Lazeron RH, Valk J, Scheltens P. Functional MR imaging in Alzheimer’s disease during memory encoding. AJNR Am J Neuroradiol. 2000;21:1869–1875. [PMC free article] [PubMed] [Google Scholar]
- Rombouts SA, Barkhof F, Goekoop R, Stam CJ, Scheltens P. Altered resting state networks in mild cognitive impairment and mild Alzheimer’s disease: an fMRI study. Hum Brain Mapp. 2005;26:231–9. doi: 10.1002/hbm.20160. [DOI] [PMC free article] [PubMed] [Google Scholar]
- Saxe R, Powell LJ. It’s the thought that counts: specific brain regions for one component of theory of mind. Psychol Sci. 2006;17:692–9. doi: 10.1111/j.1467-9280.2006.01768.x. [DOI] [PubMed] [Google Scholar]
- Scahill RI, Schott JM, Stevens JM, Rossor MN, Fox NC. Mapping the evolution of regional atrophy in Alzheimer’s disease: unbiased analysis of fluid-registered serial MRI. Proc Natl Acad Sci USA. 2002;99:4703–7. doi: 10.1073/pnas.052587399. [DOI] [PMC free article] [PubMed] [Google Scholar]
- Schacter DL, Addis DR, Buckner RL. Episodic simulation of future events: concepts, data, and applications. In The Year in Cognitive Neuroscience 2008. Ann NY Acad Sci. 2008;1124:39–60. doi: 10.1196/annals.1440.001. [DOI] [PubMed] [Google Scholar]
- Shulman GL, Fiez JA, Corbetta M, Buckner RL, Miezin FM, et al. Common blood flow changes across visual tasks: II: decreases in cerebral cortex. J Cogn Neurosci. 1997;9:648–63. doi: 10.1162/jocn.1997.9.5.648. [DOI] [PubMed] [Google Scholar]
- Smith SM, Fox PT, Miller KL, Glahn DC, Fox PM, Mackay CE, Filippini N, Watkins KE, Toro R, Laird AR, Beckmann CF. Correspondence of the brain’s functional architecture during activation and rest. Proc Natl Acad Sci USA. 2009;106:13040–13045. doi: 10.1073/pnas.0905267106. [DOI] [PMC free article] [PubMed] [Google Scholar]
- Sorg C, Riedl V, Mühlau M, Calhoun VD, Eichele T, Läer L, Drzezga A, Förstl H, Kurz A, Zimmer C, Wohlschläger AM. Selective changes of resting-state networks in individuals at risk for Alzheimer’s disease. Proc Natl Acad Sci U S A. 2007;104:18760–18765. doi: 10.1073/pnas.0708803104. [DOI] [PMC free article] [PubMed] [Google Scholar]
- Small GW, Ercoli LM, Silverman DH, et al. Cerebral metabolic and cognitive decline in persons at genetic risk for Alzheimer’s disease. Proc Natl Acad Sci U S A. 2000;87:6037–6042. doi: 10.1073/pnas.090106797. [DOI] [PMC free article] [PubMed] [Google Scholar]
- Sperling RA, Bates JF, Chua EF, Cocchiarella AJ, Rentz DM, Rosen BR, Schacter DL, Albert MS. fMRI studies of associative encoding in young and elderly controls and mild Alzheimer’s disease. J Neurol Neurosurg Psychiatry. 2003;74:44–50. doi: 10.1136/jnnp.74.1.44. [DOI] [PMC free article] [PubMed] [Google Scholar]
- Thompson PM, Hayashi KM, de Zubicaray G, Janke AL, Rose SE, et al. Dynamics of gray matter loss in Alzheimer’s disease. J Neurosci. 2003;23:994–1005. doi: 10.1523/JNEUROSCI.23-03-00994.2003. [DOI] [PMC free article] [PubMed] [Google Scholar]
- Tichavský P, Koldovský Z, Doron E, Yeredor A, Herrero GG. Blind signal separation by combining two ICA algorithms: HOS-based EFICA and time structure-based WASOBI. EUSIPCO 2006; Florence, Italy. September 2006.2006. [Google Scholar]
- Van Dijk KR, Hedden T, Venkataraman A, Evans KC, Lazar SW, Buckner RL. Intrinsic functional connectivity as a tool for human connectomics: theory, properties, and optimization. J Neurophysiol. 2010;103:297–321. doi: 10.1152/jn.00783.2009. [DOI] [PMC free article] [PubMed] [Google Scholar]
- Vincent JL, Snyder AZ, Fox MD, Shannon BJ, Andrews JR, et al. Coherent spontaneous activity identifies a hippocampal-parietal memory network. J Neurophysiol. 2006;96:3517–31. doi: 10.1152/jn.00048.2006. [DOI] [PubMed] [Google Scholar]
- Wang K, Liang M, Wang L, Tian L, Zhang X, et al. Altered functional connectivity in early Alzheimer’s disease: a resting-state fMRI study. Hum Brain Mapp. 2006;28:967–78. doi: 10.1002/hbm.20324. [DOI] [PMC free article] [PubMed] [Google Scholar]
- Zou QH, Zhu CZ, Yang Y, Zuo XN, Long XY, Cao QJ, Wang YF, Zang YF. An improved approach to detection of amplitude of low-frequency fluctuation (ALFF) for resting-state MRI: fractional ALFF. J Neurosci Methods. 2008;172:137–141. doi: 10.1016/j.jneumeth.2008.04.012. [DOI] [PMC free article] [PubMed] [Google Scholar]