Abstract
Purpose
To investigate the relationship between gas challenge-blood oxygen level dependent (GC-BOLD) response angiogenesis, and tumor size in rat Novikoff hepatoma model.
Materials and Methods
20 adult male Sprague Dawley rats (weighting 301–325g) were used for our ACUC-approved experiments. N1-S1 Novikoff hepatomas were grown in 14 rats with sizes ranging from 0.42cm to 2.81cm. All experiments were performed at 3.0T using a custom-built rodent receiver coil. A multiple gradient-echo (MGRE) sequence was used for R2* measurements, first during room air (78% N2/20% O2) breathing and then after ten minutes of carbogen (95%O2/5%CO2) breathing. After image acquisition, rats were euthanized and the tumors harvested for histological evaluation.
Results
The R2* change between air and carbogen breathing for small hepatomas was positive; R2* changes changed to negative values for larger hepatomas. We found a significant positive correlation between tumor R2* change and tumor MVD (r = 0.798, p = 0.001) and a significant inverse correlation between tumor R2* change and tumor size (r = −0.840, p < 0.0001).
Conclusions
GC-BOLD MRI measurements are well correlated to MVD levels and tumor size in the N1-S1 Novikoff hepatoma model; GC-BOLD measurements may serve as non-invasive biomarkers for evaluating angiogenesis and disease progression and/or therapy response.
Keywords: gas challenge-blood oxygen level dependent (GC-BOLD), MRI, rat Novikoff hepatoma, tumor angiogenesis, tumor micro-vessel density
Introduction
Hepatocellular carcinoma (HCC) is a worldwide health problem; HCC is the sixth most common cancer and third most common cause of cancer-related death (1). Experimental and clinical studies indicate that HCC progression is associated with angiogenesis and that an increase in micro-vessel density is associated with a poor prognosis (2). The potential efficacy of anti-angiogenic therapies (e.g. sorafenib) has been demonstrated in both pre-clinical studies and clinical trials (3,4). Non-invasive methods to timely monitor tumor micro-vessel changes during tumor progression and/or tumor response to anti-angiogenic therapy may be critical to facilitate pre-clinical development and clinical translation of anti-angiogenic therapies.
Functional imaging techniques including PET and dynamic contrast enhanced CT/MRI have been used to detect treatment response during several recent angiogenesis/anti-angiogenesis studies (5–7). These techniques provide pharmacokinetic information relating to various different vascular parameters (e.g. regional tumor blood volume and blood flow, capillary permeability, microvascular architecture, and microvascular density); this information complemented anatomic measurements of tumor size changes. However, these techniques typically require an injection of either contrast agents or molecular tracers. The latter requirement may limit the overall utility and efficacy of such techniques in the clinical setting due to adverse events related to these potentially toxic exogenous agents/tracers (8).
Blood oxygen level dependent (BOLD) MRI is a functional imaging method that utilizes deoxyhemoglobin (deoxyHb) as an endogenous contrast agent. BOLD response is related to changes in blood oxygenation levels, blood flow rates and blood volume (each impacting tissue deoxyHb concentrations); BOLD response is reflected in tissue T2* or R2*(1/T2*) changes (9). Prior gas challenge (GC)-BOLD studies during hyperoxia (induced by carbogen breathing) have demonstrated the feasibility of using GC-BOLD MRI to monitor tumor growth rate and vasculature maturity in mouse HCC and rat normal liver models (10,11). The purpose of our current study was to investigate the relationship between GC-BOLD response, tumor angiogenesis and tumor size in the rat N1-S1 Novikoff hepatoma model.
Methods
Tumor Cell Line and Culture
The N1-S1 rat hepatoma cell line (ATCC, Manassas, VA, USA) established from a hepatoma induced by ingestion of 4-dimethylaminoazobenzene (Novikoff, 1957) was obtained and cultured in Dulbecco’s Modified Eagle’s Medium (DMEM, ATCC, Manassas, VA, USA) supplemented with 10% fetal bovine serum (Sigma-Aldrich, MO, USA) and 1% Penicillin Streptomycin (Invitrogen, Carlsbad, CA, USA). Cells were maintained in suspension culture flasks at 37°C in a humidified atmosphere containing 5%CO2. Trypan blue staining was performed before each tumor implantation procedure to verify > 90% cell viability.
Animal model
All studies were approved by our institutional animal care and use committee and were performed in accordance with institutional guidelines. 20 adult male Sprague Dawley rats (Charles River Laboratories, Wilmington, MA, USA) weighing initially 301–325g were used for these experiments. After anesthesia, a mini-laporatomy was performed to expose the left hepatic lobe. 5×10⁶ N1-S1 rat hepatoma cells suspended in 0.15mL complete media were visually injected in the left medial hepatic lobe for each rat (12). Following initial implantation, 6 to 21 days were allowed for tumor growth.
MRI protocol
All MRI studies were performed using a 3.0T Magnetom Trio clinical scanner (Siemens Medical Solutions, Erlangen, Germany) with custom-built rodent receiver coil (Chenguang Med. Tech. Co., Shanghai, China). Before imaging, rats were anesthetized with high limb injection of Ketamine (75–100 mg/kg) and Xylazine (2–6 mg/kg). The abdomen of each rat was taped to restrict respiratory movement.
Coronal and transversal T2-weighted turbo spin-echo images (repetition time (TR)/echo time (TE) = 4500/61 ms, flip angle (FA) = 140 º, average (Avg) = 3) were acquired for tumor localization. Three to eight slices covering the rat N1-S1 Novikoff hepatoma were chosen for GC-BOLD studies. BOLD response was evaluated with T2* measurements performed using a multi-gradient-echo (MGRE) sequence (TR =150 ms, echo train length (ETL) =9, echo spacing = 4.6 ms, FA = 30º, slice thickness = 3 mm, field of view (FOV) = 150 × 61 mm2, 192 × 78 matrix, in-plane resolution = 0.8 mm, bandwidth = 360 Hz/pixel, Avg = 25). Breathing gases were administered via a rat nose-cone at a rate of 15mL/sec (13). MGRE images were first acquired during room air breathing (78% N2/20% O2); next, carbogen (95% O2/5% CO2) was administered for a 10-minute transition period before a second follow-up acquisition of MGE images. After image acquisition, rats were euthanized and the tumors harvested for histological evaluation.
Image analysis
Image post-processing was performed offline using Matlab software (The Math Works Inc., Natick, MA). Tumor size (maximum lesion diameter) was measured within the axial T2-weighted TSE images. Voxel-wise R2* (1/T2*) maps during each stage of gas inhalation were calculated by employing the non-linear Levenberg-Marquardt algorithm to fit the mono-exponential function S(TEi) = S(0)·exp(−R2*· TEi). Gas-challenge R2* change maps were calculated as R2* air – R2* carbogen. For each animal region of interest (ROI) were manually drawn in the targeted hepatoma excluding blood vessels on the MGRE images (separate ROI drawn to encompass the tumor tissue within each slice); these ROI were transferred to the corresponding R2* change maps for each slice. The mean R2* change was reported for each tumor (mean value across all slices that included the tumor tissue ROIs).
Histology
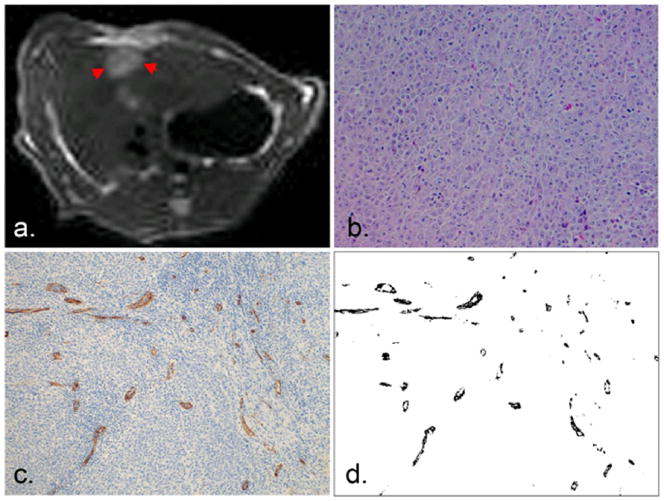
After image acquisition, each rat was euthanized with intravenous injection of Euthasol at a dose of 150 mg/kg and bilateral thoracotomy. 3 sections sampled across the N1-S1 Novikoff hepatoma were fixed in 10% buffered formaldehyde solution and paraffin embedded for histological evaluation. Hematoxylin and eosin (HE) staining and CD34 staining were performed and CD34 was used as a marker of tumor angiogenesis (14,15). Slides were digitized with optical magnification (×200) using a multi-channel automated imaging system (TissueGnostics, Vienna, Austria). Quantitative analysis of tumor angiogenesis was performed within each tumor region using Matlab software that differentiated CD34 stained areas from hepatoma areas based on color differentiation (Fig. 1). Tumor micro-vessel density (MVD) was expressed as the ratio of CD34 positive stained area per total tumor area.
Fig. 1.
N1-S1 Novikoff hepatoma was consistently hyperintense within T2-weighted images (arrow, a) and demonstrated as a poorly differentiated hepatoma within H&E staining slides (b). CD34 staining showed diffuse CD34 expression (stained brown, c) with color differentiation of CD34 (black, d) used for quantitative analysis of tumor MVD.
Statistic analysis
All statistics were performed using SPSS (SPSS, Chicago, IL). The Spearman’s correlation coefficient was calculated to assess the relationship between tumor R2* change and tumor MVD as well as the relationship between tumor R2* change and tumor size. Tests were considered statistically significant with a p-value < 0.05.
Results
14 out of 20 rats implanted with N1-S1 cells developed Novikoff hepatoma (70% tumor induction rate similar to previously reported hepatoma induction rates) sized 0.42 to 2.81 cm (12,16). These N1-S1 hepatomas were consistently hyper-intense within T2-weighted images (Fig. 1a). Gross anatomy showed one single mass with increased size locally. H&E staining showed poorly differentiated hepatoma with a solid sheet growing pattern (Fig. 1b). Diffuse positive staining for CD34 in sinusoidal-like vessels indicated the process of tumor angiogenesis in N1-S1 Novikoff hepatoma. A Representative CD34 staining image is shown in Fig. 1c demonstrating CD34 expression (brown staining) in the tumor region (blue staining). Tumor MVD was quantitatively assessed within the tumor region based on color differentiation. A representative transformed image used to calculate MVD is shown in Fig. 1d and MVD is indicated as the ratio of CD34 positive area per overall tumor area.
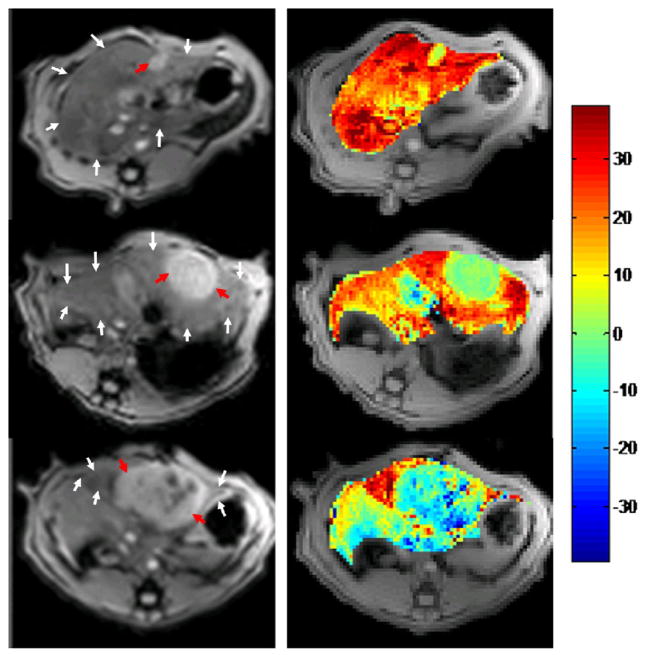
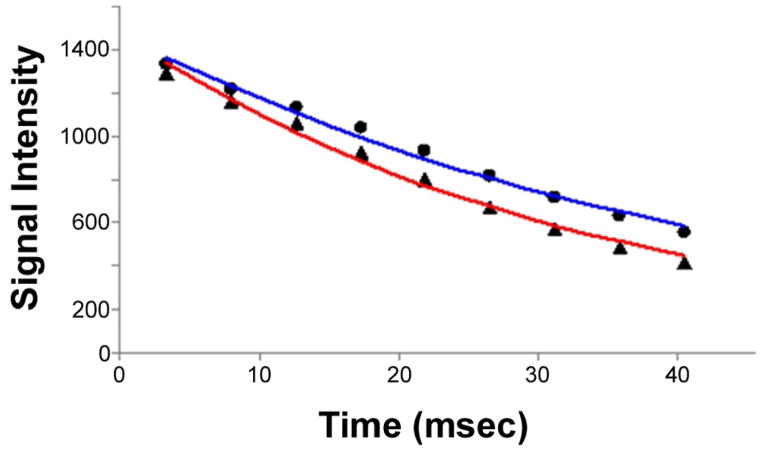
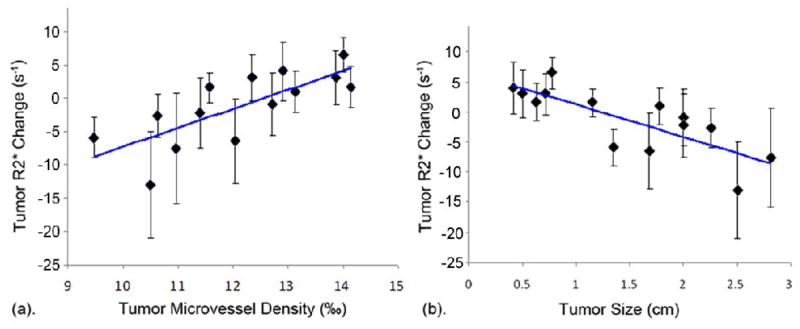
With increasing tumor size, we found that R2* changes between air and carbogen breathing progressed from positive to negative in tumor regions, while R2* changes in normal liver parenchyma were consistently positive. Representative MGRE images and corresponding ΔR2* maps are shown in Fig. 2 indicating a positive BOLD response/R2* change for small hepatoma (D=0.72cm, top row), little BOLD response/R2* change for medium sized hepatoma (D=1.78cm, medium row) and negative BOLD response/R2* change for larger hepatoma (D=2.81cm, bottom row). To indicate the quality of the acquired datasets, a representative voxel-wise signal intensity curve used to extract R2* values is shown in Fig. 3. We found a significant positive correlation between tumor R2* change and tumor MVD (r = 0.798, p = 0.001) and a significant inverse correlation between tumor R2* change and tumor size measurement (r = −0.840, p < 0.0001) (Fig. 4).
Fig. 2.
Decreasing gas-challenge ΔR2* with tumor size. MGRE images of N1-S1 hepatoma (left, TE=12ms) and corresponding ΔR2* maps (right, scale 1/s) for 3 rat N1-S1 Novikoff hepatoma (red arrow, diameter = 0.78cm, 1.78cm, 2.81cm, from top to bottom; white arrows in each image depict the location of normal liver parenchyma).
Fig. 3.
A representative plot of tumor voxel-wise signal intensity vs. echo time used to extract R2* values during air (red) and carbogen breathing stages (blue) (air: r2 = 0.99, y = 1480 × exp(−29.66 × TE), and R2* = 29.66s−1; carbogen: r2 = 0.99, y = 1475 × exp(−22.78 × TE), and R2* = 22.78s−1).
Fig. 4.
Scatter-plots comparing (a) tumor MVD and (b) tumor size to gas-challenge BOLD response/R2* changes. A significant positive correlation was observed for tumor MVD (r = 0.798, p = 0.001) measurements and inverse correlation observed for tumor size measurements (r = −0.840, p < 0.0001).
Discussion
Angiogenesis is fundamental for tumor growth, invasion and metastasis (17). In this study, we found a significant positive correlation between GC-BOLD response and tumor micro-vessel density and a negative correlation between GC-BOLD response and tumor size. Our study demonstrated that GC-BOLD MRI may offer the potential to serve as a non-invasive method for longitudinally monitoring tumor angiogenesis or anti-angiogenic therapy response in hepatic tumors.
In small hepatoma, we observed a positive GC-BOLD response between air and carbogen breathing. This finding is consistent with prior studies in well-perfused GH3 prolactinomas (18). Similar to these prior GH3 studies, this may have been the result of functional tumor neovascularization and subsequently increased hemodynamic response. Within hepatoma of larger size, GC-BOLD response decreased significantly. We speculate that the reason for little or no response in Novikoff hepatoma might have been insufficient angiogenesis compared to rapid tumor size increases. In large Novikoff hepatoma, the negative response in tissue R2* change from air to carbogen breathing was consistent with previous studies in late-stage tumors (19). One potential explanation for such findings is that blood vessels in tumor-adjacent normal liver parenchyma dilate due to the carbon dioxide in carbogen while vessels in the large tumors failed to dilate leading to a drop in blood perfusion and a decreased tissue R2* change from air to carbogen breathing. However, while widely described as a possible mechanism for such observations, this “vascular stealing” phenomenon has yet to be rigorously validated in the setting of GC-BOLD imaging in tumors (19,20). Similar observations in a chemical induced mouse liver tumor model have been previously reported (19). Although GC-BOLD response is related to several parameters (e.g., micro-vessel density, hematocrit, baseline oxyHb/deoxyHb ratio, blood flow and vascular structure), we found a significant correlation between tumor micro-vessel density and GC-BOLD response. Our study demonstrates the feasibility of performing GC-BOLD in Novikoff hepatoma; these non-invasive methods may have an important role in monitoring tumor angiogenesis and could potentially be useful for non-invasive monitoring of therapeutic response to anti-angiogenic interventions.
One limitation of our current study is related to the small sample size considering the wide range of tumor sizes and lack of serial measurements in each individual tumor. Future longitudinal studies are warranted to rigorously address these limitations. Further, we performed only static state GC-BOLD measurements (air - carbogen) instead of dynamic measurements (air -carbogen - air - carbogen, etc); the latter approach could be important to demonstrate the reproducibility of GC-BOLD responses in each hepatoma. In this study we did not provide direct proof about the perfusion status in tumor neovascular to confirm our mechanistic speculations. Future longitudinal studies with additional measurements of tumor neovascular function are warranted to confirm the relationship between tumor micro-vessel density and GC-BOLD response. Finally, while 24 signal averages were used for these studies, an approach with 25 averages would have better taken advantage of available MGRE pulse sequence phase-cycling schemes.
In conclusion, gas-challenge BOLD MRI offers the potential to serve as a non-invasive method for evaluating angiogenesis and monitoring anti-angiogenic therapy response in hepatic tumors. In this study we found a positive correlation between GC-BOLD response and tumor MVD in the rat Novikoff hepatoma model. Future studies are now needed to fully elucidate the significance and impact of these methods for lesion staging and the evaluation of therapy response in both pre-clinical and clinical settings.
Acknowledgments
This publication was made possible by Grant Number CA134719 from the National Institutes of Health (NIH). Its contents are solely the responsibility of the authors and do not necessarily represent the official view of NIH.
Footnotes
Publisher's Disclaimer: This is a PDF file of an unedited manuscript that has been accepted for publication. As a service to our customers we are providing this early version of the manuscript. The manuscript will undergo copyediting, typesetting, and review of the resulting proof before it is published in its final citable form. Please note that during the production process errors may be discovered which could affect the content, and all legal disclaimers that apply to the journal pertain.
References
- 1.Parkin DM, Bray F, Ferlay J, Pisani P. Global cancer statistics, 2002. CA Cancer J Clin. 2005;55(2):74–108. doi: 10.3322/canjclin.55.2.74. [DOI] [PubMed] [Google Scholar]
- 2.Ribatti D, Vacca A, Nico B, Sansonno D, Dammacco F. Angiogenesis and anti-angiogenesis in hepatocellular carcinoma. Cancer Treat Rev. 2006;32(6):437–444. doi: 10.1016/j.ctrv.2006.06.002. [DOI] [PubMed] [Google Scholar]
- 3.Kerbel RS. Tumor angiogenesis. N Engl J Med. 2008;358(19):2039–2049. doi: 10.1056/NEJMra0706596. [DOI] [PMC free article] [PubMed] [Google Scholar]
- 4.Liu L, Cao Y, Chen C, Zhang X, McNabola A, Wilkie D, Wilhelm S, Lynch M, Carter C. Sorafenib blocks the RAF/MEK/ERK pathway, inhibits tumor angiogenesis, and induces tumor cell apoptosis in hepatocellular carcinoma model PLC/PRF/5. Cancer Res. 2006;66(24):11851–11858. doi: 10.1158/0008-5472.CAN-06-1377. [DOI] [PubMed] [Google Scholar]
- 5.Maleddu A, Pantaleo MA, Castellucci P, Astorino M, Nanni C, Nannini M, Busato F, Di Battista M, Farsad M, Lodi F, Boschi S, Fanti S, Biasco G. 11C-acetate PET for early prediction of sunitinib response in metastatic renal cell carcinoma. Tumori. 2009;95(3):382–384. doi: 10.1177/030089160909500320. [DOI] [PubMed] [Google Scholar]
- 6.Jiang HJ, Zhang ZR, Shen BZ, Wan Y, Guo H, Li JP. Quantification of angiogenesis by CT perfusion imaging in liver tumor of rabbit. Hepatobiliary Pancreat Dis Int. 2009;8(2):168–173. [PubMed] [Google Scholar]
- 7.Oostendorp M, Post MJ, Backes WH. Vessel growth and function: depiction with contrast-enhanced MR imaging. Radiology. 2009;251(2):317–335. doi: 10.1148/radiol.2512080485. [DOI] [PubMed] [Google Scholar]
- 8.Bettmann MA, Heeren T, Greenfield A, Goudey C. Adverse events with radiographic contrast agents: results of the SCVIR Contrast Agent Registry. Radiology. 1997;203(3):611–620. doi: 10.1148/radiology.203.3.9169677. [DOI] [PubMed] [Google Scholar]
- 9.Baudelet C, Gallez B. Current issues in the utility of blood oxygen level dependent MRI for the assessment of modulations in tumor oxygenation. Current Medical Imaging Reviews. 2005;1:229–243. [Google Scholar]
- 10.Thomas CD, Chenu E, Walczak C, Plessis MJ, Perin F, Volk A. Relationship between tumour growth rate and carbogen-based functional MRI for a chemically induced HCC in mice. MAGMA. 2004;17(3–6):271–280. doi: 10.1007/s10334-004-0087-z. [DOI] [PubMed] [Google Scholar]
- 11.Barash H, Gross E, Matot I, Edrei Y, Tsarfaty G, Spira G, Vlodavsky I, Galun E, Abramovitch R. Functional MR imaging during hypercapnia and hyperoxia: noninvasive tool for monitoring changes in liver perfusion and hemodynamics in a rat model. Radiology. 2007;243(3):727–735. doi: 10.1148/radiol.2433060433. [DOI] [PubMed] [Google Scholar]
- 12.Guo Y, Zhang Y, Klein R, Nijm GM, Sahakian AV, Omary RA, Yang GY, Larson AC. Irreversible electroporation therapy in the liver: longitudinal efficacy studies in a rat model of hepatocellular carcinoma. Cancer Res. 70(4):1555–1563. doi: 10.1158/0008-5472.CAN-09-3067. [DOI] [PMC free article] [PubMed] [Google Scholar]
- 13.Jin N, Deng J, Chadashvili T, Zhang Y, Guo Y, Zhang Z, Yang GY, Omary RA, Larson AC. Carbogen gas-challenge BOLD MR imaging in a rat model of diethylnitrosamine-induced liver fibrosis. Radiology. 254(1):129–137. doi: 10.1148/radiol.09090410. [DOI] [PMC free article] [PubMed] [Google Scholar]
- 14.Fox SB, Harris AL. Histological quantitation of tumour angiogenesis. Apmis. 2004;112(7–8):413–430. doi: 10.1111/j.1600-0463.2004.apm11207-0803.x. [DOI] [PubMed] [Google Scholar]
- 15.Tanigawa N, Lu C, Mitsui T, Miura S. Quantitation of sinusoid-like vessels in hepatocellular carcinoma: its clinical and prognostic significance. Hepatology. 1997;26(5):1216–1223. doi: 10.1053/jhep.1997.v26.pm0009362365. [DOI] [PubMed] [Google Scholar]
- 16.Guo Y, Klein R, Omary RA, Yang GY, Larson AC. Highly malignant intra-hepatic metastatic hepatocellular carcinoma in rats. Am J Transl Res. 3(1):114–120. [PMC free article] [PubMed] [Google Scholar]
- 17.Hanahan D, Weinberg RA. The hallmarks of cancer. Cell. 2000;100(1):57–70. doi: 10.1016/s0092-8674(00)81683-9. [DOI] [PubMed] [Google Scholar]
- 18.Robinson SP, Rijken PF, Howe FA, McSheehy PM, van der Sanden BP, Heerschap A, Stubbs M, van der Kogel AJ, Griffiths JR. Tumor vascular architecture and function evaluated by non-invasive susceptibility MRI methods and immunohistochemistry. J Magn Reson Imaging. 2003;17(4):445–454. doi: 10.1002/jmri.10274. [DOI] [PubMed] [Google Scholar]
- 19.Thomas CD, Chenu E, Walczak C, Plessis MJ, Perin F, Volk A. Morphological and carbogen-based functional MRI of a chemically induced liver tumor model in mice. Magn Reson Med. 2003;50(3):522–530. doi: 10.1002/mrm.10555. [DOI] [PubMed] [Google Scholar]
- 20.Robinson SP, Rodrigues LM, Ojugo AS, McSheehy PM, Howe FA, Griffiths JR. The response to carbogen breathing in experimental tumour models monitored by gradient-recalled echo magnetic resonance imaging. Br J Cancer. 1997;75(7):1000–1006. doi: 10.1038/bjc.1997.172. [DOI] [PMC free article] [PubMed] [Google Scholar]


