Abstract
Mycophenolic acid (MPA) is used as an immunosuppressant after organ transplantation and for the treatment of immune diseases. There is increasing evidence that therapeutic drug monitoring and plasma concentration-guided dose adjustments are beneficial for patients to maintain immunosuppressive efficacy and to avoid toxicity. The major MPA metabolite that can be found in high concentrations in plasma is MPA glucuronide (MPAG). A metabolite usually present at lower concentrations, MPA acyl-glucuronide (AcMPAG), has been implicated in some of the adverse effects of MPA.
We developed and validated an automated high-throughput ultra-high performance chromatography-tandem mass spectrometry (U-HPLC-MS/MS) assay using liquid-handling robotic extraction for the quantification of MPA, MPAG, and AcMPAG in human EDTA plasma and urine.
The ranges of reliable response were 0.097 (lower limit of quantitation) to 200 μg/mL for MPA and MPAG and 0.156– 10 μg/mL for AcMPAG in human urine and plasma. The inter-day accuracies were 94.3–104.4%, 93.8–105.0% and 94.4–104.7% for MPA, MPAG and AcMPAG, respectively. Inter-day precisions were 0.7–7.8%, 0.9–6.9% and 1.6–8.6% for MPA, MPAG and AcMPAG. No matrix interferences, ion suppression/enhancement and carry-over were detected. The total assay run time was 2.3 min.
The assay met all predefined acceptance criteria and the quantification of MPA was successfully cross-validated with an LC-MS/MS assay routinely used for clinical therapeutic drug monitoring. The assay has proven to be robust and reliable during the measurement of samples from several pharmacokinetics trials.
Keywords: Mycophenolic Acid, Mycophenolic Acid Glucuronide, Mycophenolic Acid Acyl-Glucuronide, U-HPLC-MS/MS, immunosuppressant
1. INTRODUCTION
The use of calcineurin inhibitors (CNIs) is the basis of most immunosuppressive protocols after organ transplantation [1–4]. However, the use of CNIs is limited due to their nephrotoxic side effects [1,4]. Mycophenolic acid (MPA, Figure 1) is an immunosuppressive drug used for the prevention of rejection in solid organ transplantation and for treatment of immune diseases that lacks the typical nephrotoxicity of the CNIs [5–7]. Thus, it is frequently used in immunosuppressive maintenance drug regimens in order to lower the doses of CNIs or to even withdraw CNIs completely [1,8–10]. In the early post-transplant period, MPA is often used in combination with a calcineurin inhibitor (cyclosporine or tacrolimus) and prednisolone [11]. MPA inhibits inosine monophosphate dehydrogenase, the enzyme that controls the rate of synthesis of guanine monophosphate in the de novo pathway of purine synthesis used in the proliferation of B and T lymphocytes [7]. Along with other minor pathways, it is mainly metabolized to its 7-O-phenolic glucuronide (MPAG, Figure 1) that possesses immunosuppressive potency several orders of magnitude lower than both MPA as well as its acyl glucuronide (AcMPAG, Figure 1) that has been found to possess pharmacological, toxic, and potentially pro-inflammatory activities [12]. MPAG elimination depends on kidney function and may be affected by drug-drug interactions [13]. Drugs, as well as the gut microbiome can also affect the enterohepatic recirculation of MPA[14]. Although a recent consensus panel did not recommend therapeutic drug monitoring or MPA in general [14], it was emphasized that MPA therapeutic drug monitoring should be considered in the following situations: dual immunosuppressive therapy, reduced-dosage CNI therapy (including CNI withdrawal and delayed introduction of CNI), CNI switch, dose change (cyclosporine) or withdrawal, recipients with high immunologic risk, delayed graft function (renal, hepatic, and bowel), altered gastrointestinal/hepatic/renal function, patients with cystic fibrosis, drug-drug interactions, and noncompliance. Clinical practice suggests that plasma trough target concentrations ≥1 mg/L are important during the first year after transplantation to minimize rejection, whereas plasma concentrations should be kept below 3.5 mg/L subsequently to reduce the incidence of adverse effects [14].
Figure 1.
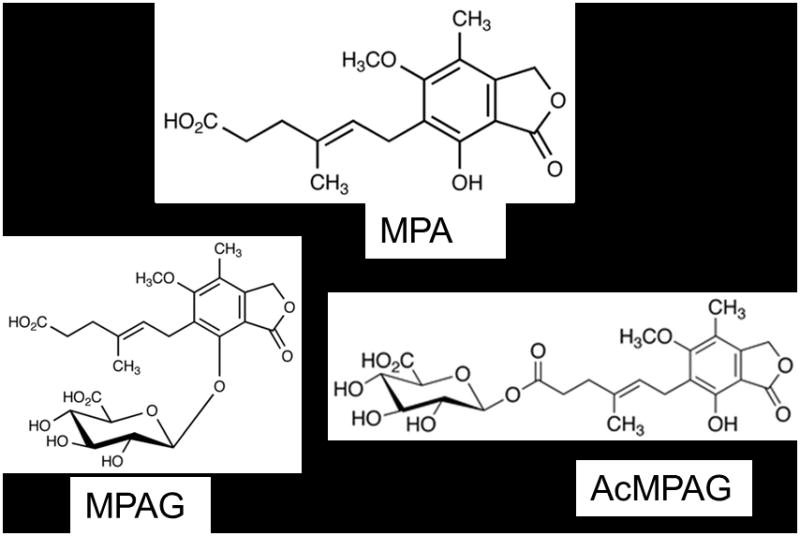
Structures of MPA, MPAG, and AcMPAG. (D3-MPA and D3-MPAG internal standards contain 3 deuterium atoms on the 6′ methoxy group of the benzene ring.)
Although frequently used MPA therapeutic drug monitoring assays include immunoassays, their reliability is limited due to the common and variable overestimation of drug concentrations resulting from nonspecific cross-reactions of their antibodies with metabolites [12]. It was shown that AcMPAG can cross react with antibodies used for the MPA immunoassays to a significant extent [12]. Consequently, if available, HPLC-UV and HPLC-MS/MS assays should be preferred over immunoassays due to their superior specificity[14,15]. However, HPLC-UV and HPLC-MS/MS typically are less automated, have less throughput and thus a slower turn-around of results than immunoassays. This can be a critical consideration, especially in an outpatient situation for which it is preferable to have the results available for dosing recommendations within a few hours after the samples have been drawn and before the patient leaves the clinical facility. Although HPLC-MS/MS assays have been developed to measure MPA, only a few of the assays also measure the major metabolites, especially AcMPAG [16–20]. Assays simultaneously measuring MPA and its metabolites employ relatively long chromatographic run times and do not have sufficient sensitivity for AcMPAG, which in comparison to MPAG has a relatively low abundance. Here we describe an automated ultra high-performance liquid chromatography- tandem mass spectrometry (U-HPLC-MS/MS) high-throughput assay for the simultaneous quantification of MPA and its major metabolites MPAG and AcMPAG. This assay includes a 96-well plate robotic extraction and requires only 2.3 min from injection to injection while yielding lower limits of quantitation (LLOQs) of 0.097 μg/mL for MPA and MPAG as well as 0.156 μg/mL for AcMPAG.
2. MATERIALS AND METHODS
2.1 Matrix
The assay was validated in human EDTA plasma and human urine. Plasma samples used for assay development and validation purposes were obtained from Bonfils Blood Center, Denver, CO. Urine samples were collected from healthy individuals. The use of de-identified samples for assay development, validation, calibration, and quality control purposes was considered “exempt” by the Colorado Multiple-Institutional Review Board (COMIRB, Aurora, CO).
2.2 Chemicals and Reagents
Solvents and reagents (HPLC grade methanol, acetonitrile, water, formic acid 99%, trifluoroacetic acid) used for sample preparation and as mobile phases were purchased from Fisher Scientific (Fair Lawn, NJ) and used without further purification. MPA reference material was from Sigma Aldrich (St Louis, MO), MPAG was from Analytical Services International (Caterham, UK), and AcMPAG was from Toronto Research Chemicals (North York, ON, Canada). The internal standards D3-MPA and D3-MPAG were also purchased from Toronto Research Chemicals. The structures of the analytes and their internal standards are shown in Figure 1.
2.3 Preparation of Stock and Working Solutions
Each stock solution was based on three independent weightings of each compound. Stock solutions (1 mg/mL) of all compounds were prepared in methanol and stored at −80°C. Working solutions for quality control samples and standard curves were prepared by dilution of the stock solutions with human plasma or human urine.
2.3.1 Preparation of Internal Standard and Protein Precipitation Solutions
D3-MPA was used as internal standard for the quantification of MPA and D3-MPAG was used for the quantification of both MPAG and AcMPAG. The internal standard solutions were stored at −80°C for no longer than 2 weeks. The protein precipitation solution (30% of aqueous 0.2M ZnSO4/70% methanol) containing 1 μg/mL D3-MPA and 1 μg/mL D3-MPAG was prepared fresh daily. The expiration was set to 12 hours and remaining protein precipitation solution was discarded hereafter.
2.3.2 Preparation of Calibrators and Quality Control Samples
Calibrators and quality control samples were prepared by enriching blank matrix samples with known concentrations of the reference materials. The calibration curve and quality control samples were generated by pipetting a series of 1:1 dilutions using a Microlab Starlet robotic system (Hamilton, Bonaduz, Switzerland).
2.4 Method of Extraction
Two hundred μL of the samples were pipetted into the wells of a 96 deep well plate (1.0 mL DW Plates, Nalgene Nunc, Rochester, NY) and then 600 μL of the protein precipitation solution containing the internal standards was added using the Hamilton Robot. The 96 well plates were then tightly covered with a preslit well cap (Nalgene Nunc, Rochester, NY). The covered plates were shaken for 10 minutes (MaxiMix III, Thermo Fisher, Waltham, MA) and subsequently centrifuged at 3600g and +4°C for 10 minutes (accuSpin Micro R, Thermo Fisher, Waltham, MA). The plates were then directly placed into the autosampler of the HPLC system. The height of the autosampler needle and draw speed was adjusted not to disturb the protein pellet in the 96-well plates.
2.5 U-HPLC-MS/MS Assay
All measurements were performed using a Waters Acquity TQD UPLC-MS/MS system (Milford, MA) operating in the positive multiple reaction monitoring mode (MRM) with an electrospray ionization source and equipped with a Waters Acquity U-HPLC system with a U-HPLC pump, U-HPLC autosampler and column thermostat. Analytes were separated using a 2.1· 50 mm UPLC-BEH C18, 1.7 μm column (Waters, Milford, MA). The U-HPLC solvent flow rate was 300 μL/min. The solvents were 0.1% aqueous formic acid (mobile phase A) and methanol + 0.1% formic acid (mobile phase B). The gradient was: 0–0.3 min 40% methanol, 0.31–1.5 min 40% methanol to 98% methanol and 1.51–1.9 min 98% methanol. The column was re-equilibrated to starting conditions (40% methanol) between 1.91 and 2.3 min. Nitrogen was used as the desolvation gas at a flow rate of 800 L/hr and a desolvation temperature of 350°C, while Argon gas of 99.99% purity was used for collision activated dissociation at a flow of 0.20 mL/min. The mass spectrometry parameters were: ion transition MPA: m/z=343.10 [M+Na]+ → 229.10 with 0.08 seconds dwell time, 68V cone voltage, and 20eV collision energy; ion transition MPAG and AcMPAG: m/z= 519.20 [M+Na]+ → 343.10 with 0.04 seconds dwell time, 67V cone voltage, and 20eV collision energy; ion transition D3-MPA: m/z= 346.10 [M+Na]+ → 242.10 with 0.04 seconds dwell time, 68V cone voltage, and 20eV collision energy; ion transition D3-MPAG: m/z= 522.10 [M+Na]+ → 346.10 with 0.02 seconds dwell time, 67 V cone voltage, and 20eV collision energy. The source temperature was set to 120°C with a capillary voltage of 0.8kV.
2.5.1 Assay Validation
Calibration curves were constructed by plotting the peak area ratios of the corresponding analyte and internal standard against nominal analyte concentrations using the following 12 calibrators (0.098 0.195, 0.39, 0.78, 1.56, 3.12, 6.25, 12.5, 25, 50, 100, and 200 μg/mL) for MPA and MPAG and the following 7 calibrators (0.156, 0.312, 0.625, 1.25, 2.5, 5, and 10 μg/mL) for AcMPAG. For validation purposes six calibration curves were run each day for three days (n=18). Each calibration curve also contained a zero samples (did not contain analytes but internal standards were added during extraction) and blank samples (no analytes and no internal standards). Quality control samples were prepared (n=5) at the following concentrations 0.293, 0.586, 1.17, 2.34, 4.69, 9.38, 18.75, 37.5, 75, and 150 μg/mL each validation day. The lower limit of quantitation was the lowest calibrator that consistently showed ± 20% or less deviation from the nominal concentration as well as a precision of ≤ 20%. The upper limit of quantitation was set as the highest calibrator that consistently showed ± 20% or less deviation from the nominal concentration as well as a precision of ≤ 20%. The linearity of the method was investigated by calculation of the regression line using the least squares method. Accuracy and precision were verified over three days. Intra-day and inter-day accuracies and precisions were calculated using the equations as set forth in Clinical Laboratory Standard Institute guidelines [21].
2.5.2 Matrix Interferences, Ion Suppression/Enhancement, Absolute Extraction Recoveries and Exclusion of Carry-Over
Interferences caused by matrix signals were excluded by extraction and analysis of blank plasma and urine samples collected from ten different individuals. To detect changes in ionization efficiency by co-eluting matrix substances, blank human EDTA plasma and urine samples from ten different healthy individuals were extracted. Extracted blank samples were enriched with all previously described quality control concentrations for MPA, MPAG, and AcMPAG. Signal intensities were compared with those after injection of a corresponding amount of the compounds from a stock solution to exclude ion suppression/ion enhancement and with corresponding samples enriched with the same amounts of MPA, MPAG and AcMPAG before extraction to estimate absolute extraction recoveries. Potential carry-over was assessed by alternately analyzing blood samples spiked with concentrations of MPA, MPAG and AcMPAG at the upper limit of quantitation (n= 6) followed by blank methanol samples.
2.5.3 Stability Testing
Benchtop stabilities of the analytes were tested for whole blood (2 hours) and for plasma, urine, and stock solutions (over 6 hours). For whole blood, plasma, and urine stability quality control samples were prepared (n=12/concentration and matrix) at 37.5 μg/mL for MPA and MPAG and 1.875 μg/mL for AcMPAG. Six of the samples were measured immediately for all three compounds (baseline) using a newly prepared calibration curve while the other six remained on the bench top over the test period. Then the remaining six samples were analyzed and accuracies were compared to the baseline samples. To test benchtop stock solution stability, MPA and MPAG (200 μg/mL) and AcMPAG (10 μg/mL) stock solutions were prepared freshly. Six QC samples for each matrix were prepared immediately from the newly made stocks at concentrations matching those used for urine, plasma, and whole blood stability as described above. These samples were then analyzed using a newly made calibration curve while the original stocks were left on the bench for a period of six hours. After the corresponding time had passed the stocks were used to prepare another corresponding six QC samples. These samples were then analyzed and accuracies were compared to those of the baseline samples.
Autosampler stability was determined by leaving extracted samples at a concentration of 75 μg/mL MPA and MPAG and 3.75 μg/mL AcMPAG; n=5/concentration and time point) in the autosampler for 24 hours and for 48 hours. Samples were analyzed and the results were compared with the results of the analyses immediately after extraction.
Stability was assumed if the concentrations of the test samples were not significantly different from immediately analyzed corresponding reference samples (Analysis of Variance, PASW 18.0, IBM/SAS Institute, Chicago, IL).
Freeze-thaw stability was determined by preparing both urine and plasma QC samples with concentrations of 25 μg/mL MPA and MPAG and 2.5 μg/mL AcMPAG; n=3/concentration. Samples were then exposed to one, two, and three freeze-thaw cycles. These samples were then compared to freshly prepared QC samples at the corresponding concentrations.
To determine the long-term effects of sample storage at varying conditions, both urine and plasma QC samples were prepared at concentrations of 20μg/mL MPA and MPAG as well as 10μg/mL AcMPAG. Samples were stored at 4°C, and −80°C for 24 hours, 1 week, and 1 month (n=3). These samples were then analyzed with freshly prepared calibration curves and accuracies were compared to those measured at baseline.
2.5.4 Cross-validation with a Reference HPLC-MS/MS Assay
The assay used was previously described by Filler et al [22] and Perry et al [23]. In Brief: 10 μL of the sample were diluted with 990μL of blank EDTA human plasma (1:100). Two-hundred μL of each diluted sample was extracted with 800μl of cold protein precipitation reagent (30% 0.2M aqueous ZnSO4, 70% methanol supplemented with 1 μg/mL mycophenolate mofetil, which was used as the internal standard). Samples were centrifuged and the supernatant was transferred to HPLC vials. Samples were analyzed on a Agilent 1100 series HPLC (Agilent Technologies, Palo Alto, CA) interfaced with an positive electrospray API 4000 tandem Mass Spectrometer (Applied Biosystems, Forest City, CA ) using online extraction sample cleanup. One hundred μL of the samples were injected onto a 12.5 · 4.6 mm extraction column (Zorbax Eclipse XDB C8, Agilent Technologies, Santa Clara, CA) filled with Zorbax XDB C8 material. Samples were washed with a mobile phase consisting of 2% HPLC grade methanol supplemented with 0.1% formic acid and of 98% aqueous 0.1% formic acid. The flow rate was 5 mL/min. After 1 min, the switching valve was activated and the analytes were eluted in the back flush mode from the extraction column onto a 150 · 4.6 mm C8, 5μm particle size analytical column (Zorbax Eclipse XDB C8, Agilent Technologies). The mobile phases consisted of methanol and 0.1% aqueous formic acid. The gradient started at 70% methanol and was increased to 100% methanol within 2 minutes and kept at 100% methanol for an additional 1.5 minutes. Hereafter, the analytical column was re-equilibrated for 2.5 minutes. The flow rate was 1 mL/min. The analytical column and the extraction column were kept at 65°C. The following mass transitions were monitored in multiple reaction monitoring mode: MPA (m/z= 343→229) and MMF (m/z= 434→195). Analyst software version 1.4.2 was used for data analysis. Key performance parameters were: range of reliable response: 0.1– 40 μg/mL (r2= 0.999), inter-day variability: 2.4% at 0.24 μg/mL, 1.0% at 4 μg/mL and 1.0% at 30 μg/mL [22]. The laboratory has successfully participated in the external quality assessment schemes organized by Prof. D.W. Holt (Analytical Services International, Caterham, UK; http://www.bioanalytics.co.uk) and the College of American Pathologists on a regular basis.
3. RESULTS AND DISCUSSION
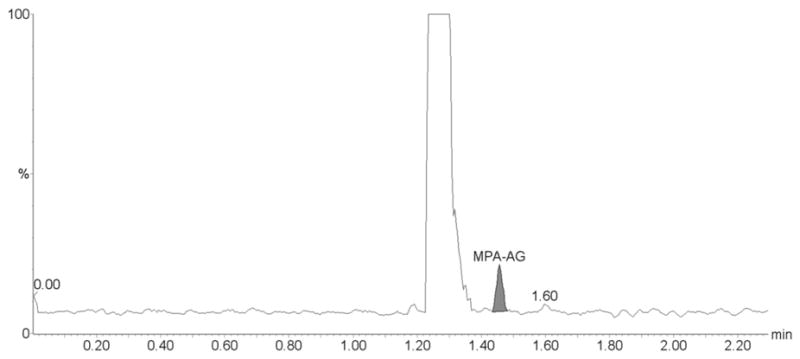
As shown in the representative ion chromatograms in Figure 2, MPA, MPAG and AcMPAG were completely chromatographically separated. This was required since in-source fragmentation of MPAG and AcMPAG results in cleavage of the glucuronide and the formation of MPA ions. Although this occurs only with a small percentage of the molecules, the concentrations of MPAG in plasma and urine are 1–2 orders of magnitude higher than those of MPA making this a continuing relevant consideration [24]. Systematic variation of the ionization parameters indicated that in-source fragmentation of glucuronides could not be avoided.
Figure 2.
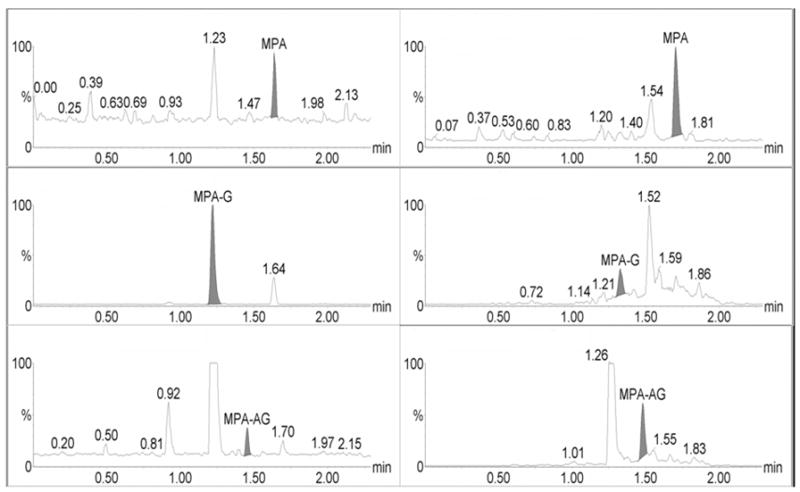
Representative extracted human plasma (left) and human urine samples (right) that were spiked with MPA and metabolites at the lower limit of quantitation (LLOQ). Concentrations were 0.098 μg/mL for MPA and MPAG and 0.156 μg/mL for AcMPAG.
Calibration curves for all analytes (MPA, MPAG and AcMPAG) were generated using quadratic curve fit with 1/x weighting (Figure 3, Table 1). The correlation coefficients (r) for the calibration curves were r2 ≥ 0.99 in all matrices encompassing a concentration range of 0.097 – 200 μg/mL for MPA and MPAG and 0.156 – 10 μg/mL for AcMPAG (Table 1). Accuracies and precisions are shown in Table 2. Mean accuracies and precisions were within predefined acceptance criteria of 85% – 115% of the nominal concentration and 15 % (coefficient of variance), respectively.
Figure 3.
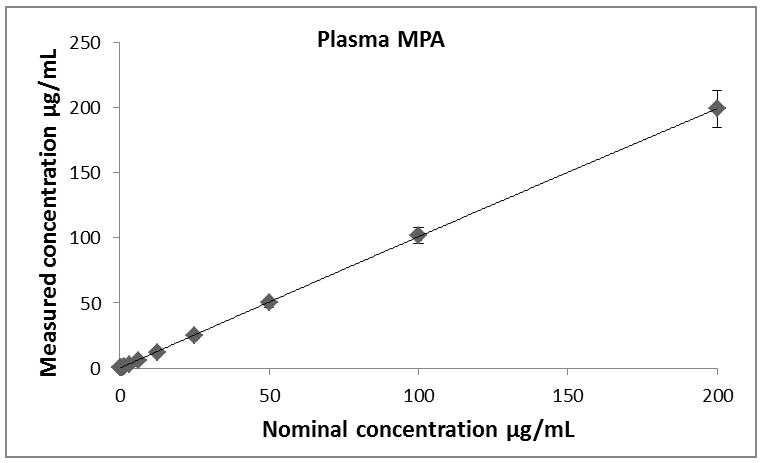
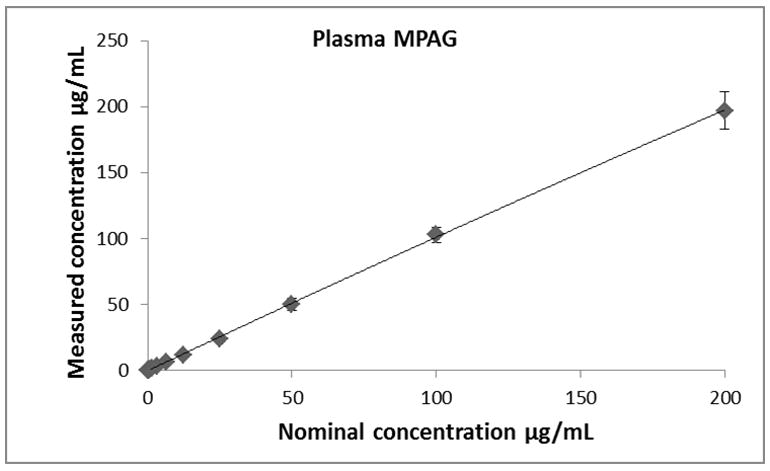
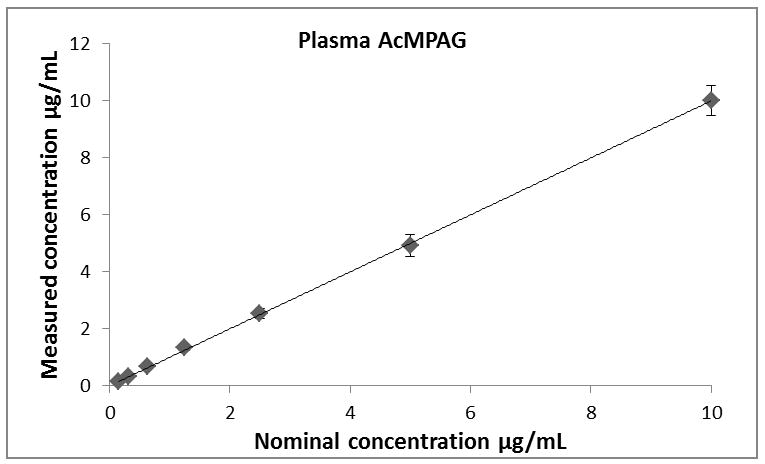
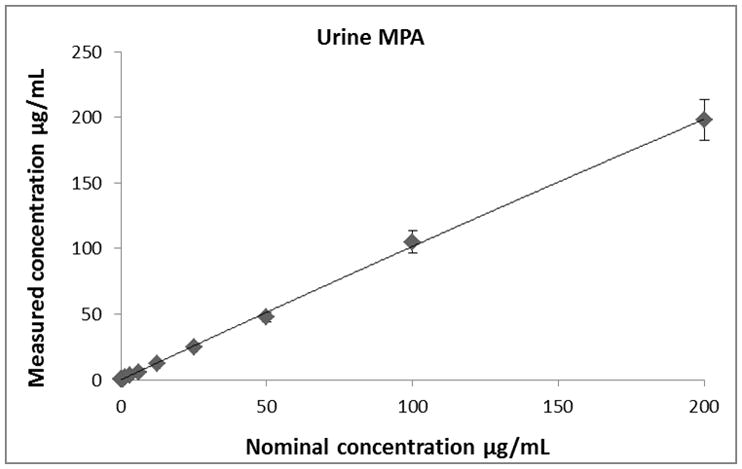
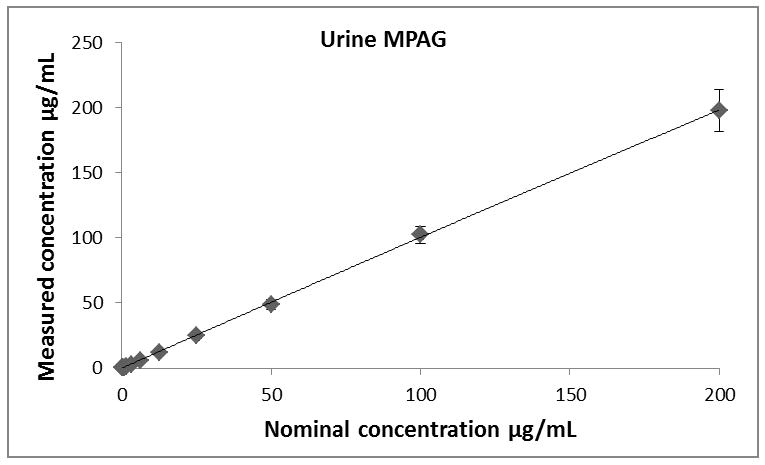
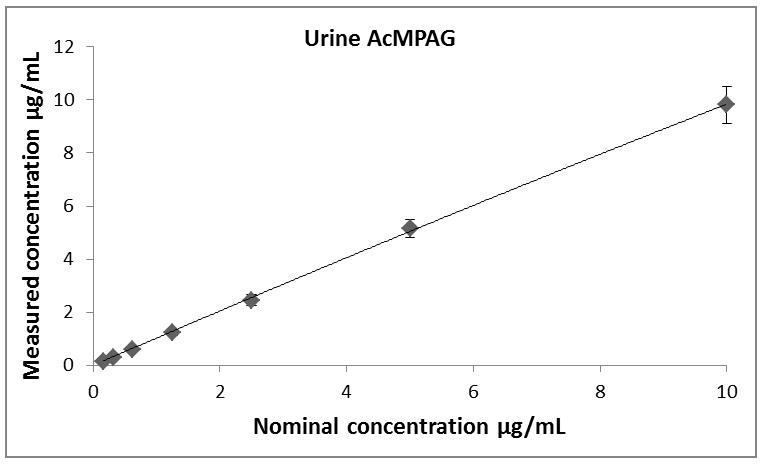
Descriptive statistics of calibration curves. Calibrations curves of MPA, MPAG and AcMPAG in plasma (A), (B), and (C) and urine (D), (E), and (F). Means ± standard errors are shown for calibration curves from three days of validation (n =6/day, n=18 total). Please note that some of the smaller error bars are hidden behind the symbols. Also, please see Table 1 for range of reliable response, curve fits and regression coefficients.
Table 1.
Lower limits of quantitation (LLOQ), upper limits of quantitation (ULOQ), curve fits and correlation coefficients (R) for MPA, MPAG and AcMPAG in human plasma and urine.
| Compound | LLOQ [μg/mL] | ULOQ [μg/mL] | N | Curve fit/weighting | Curve Urine | R2 |
|---|---|---|---|---|---|---|
| MPAUrine | 0.0977 | 200 | 6 | quadratic/1/x | −0.000104x2+0.3243x+0.0632 | 0.9918 |
| MPAGUrine | 0.0977 | 200 | 6 | quadratic/1/x | −0.000275x2+0.3822x−0.0089 | 0.9952 |
| AcMPAGUrine | 0.1563 | 10 | 6 | quadratic/1/x | 16.92x2+1451x+398 | 0.9938 |
| MPAPlasma | 0.0977 | 200 | 6 | quadratic/1/x | −0.000046x2+0.2390x+0.0012 | 0.9970 |
| MPAGPlasma | 0.0977 | 200 | 6 | quadratic/1/x | −0.000319x2+0.2982x+1.5331 | 0.9938 |
| AcMPAGPlasma | 0.1563 | 10 | 6 | quadratic/1/x | 29.9120x2+3.3882x+0.4506 | 0.9901 |
Table 2.
Intra-assay and inter-assay accuracies and precisions as well as recoveries for MPA, MPAG and AcMPAG in human plasma and urine.
| Intra-day | Inter-day | ||||
|---|---|---|---|---|---|
| Deviation from nominal | Precision | Deviation from nominal | Precision | Recovery | |
| [%] | [%] | [%] | [%] | [%] | |
| MPAUrine | 95.4–105.4 | 2.4–13.4 | 98.3–103.0 | 1.4–4.9 | 90.8 – 94.7 |
| MPAGUrine | 88.7–106.8 | 0.9–10.8 | 94.1–103.8 | 1.8–6.9 | 90.0 – 94.1 |
| AcMPAGUrine | 93.1–106.6 | 3.5–11.4 | 99.5–104.6 | 1.7–5.7 | 90.2 – 94.2 |
| MPAPlasma | 88.9–103.9 | 3.0–10.7 | 94.3–104.4 | 0.7–7.8 | 90.2 – 93.8 |
| MPAGPlasma | 90.9–108.2 | 2.9–12.6 | 93.8–105.0 | 0.9–6.7 | 91.7 – 94.0 |
| AcMPAGPlasma | 90.6–109.0 | 1.2–10.3 | 94.4–104.7 | 1.6–8.6 | 90.5 – 94.8 |
All three analytes in blank plasma and urine from 10 different individuals did not show any endogenous interference. Extraction recoveries for all three analytes ranged from 90 – 94% in plasma and 90 – 95% in urine (Table 2). No ion suppression/enhancement interfered with the detection and quantification of MPA and its metabolites as determined by extraction of samples from 10 individuals and subsequent enrichment with MPA, MPAG and AcMPAG. There was also no evidence of detectable carry-over after injecting blanks following the highest calibrator samples. Dilution integrity was analyzed by preparing samples containing 2 mg/mL MPA and MPAG and 100 μg/mL AcMPAG. These samples were then diluted 1:13, 1:52, and 1:104 with the respective blank matrix (n=3). The concentrations of the analytes in the all dilution samples were found to be within ±12% of the nominal concentrations.
None of the extracted samples were affected by 48-hour storage in the autosampler at 4°C with all analytes in both matrices measuring within ±10% of the nominal concentration. The three analytes showed no degradation in either matrix through three freeze-thaw cycles. Short-term storage of extracted and non-extracted samples under the conditions tested did not have an effect on the integrity of the data as shown in Table 3.
Table 3.
Two and six hour short-term stabilities for MPA, MPAG and AcMPAG in human whole blood, plasma, urine and methanol (stock solutions) at room temperature.
| Percent deviation from nominal ± Standard deviation | |||
|---|---|---|---|
| MPA | MPAG | AcMPAG | |
| 2 Hour Whole Blood | 103.0 ± 5.2 | 103.1±7.2 | 101.9 ± 4.1 |
| 6 Hour Plasma | 107.2 ± 6.5 | 111.1 ± 3.5 | 100.1 ± 2.7 |
| 6 Hour Urine | 97.3 ± 9.7 | 94.5 ± 9.9 | 102.2 ± 6.1 |
| 6 Hour Stock Solutions | 101.9 ± 10.0 | 101.3 ± 11.6 | 99.4 ± 2.9 |
Although previous work showed MPA, MPAG and AcMPAG to be stable in human plasma for at least 6 months at −20°C [25] and MPA, MPAG and AcMPAG to be stable in plasma stored at 4°C for 10 days [26], our long term stability experiments showed considerably different trends for the two MPA metabolites. As seen in Table 4, both MPAG and AcMPAG showed minimal degradation through 24 hours, however, MPAG in urine displayed rapid degradation throughout the first week at all three temperatures resulting in up to 70% degradation after day 7 for MPAG and complete degradation for AcMPAG. Significantly faster degradation was observed in urine compared to plasma, most likely the due to the acidity of this matrix. In contrast to its metabolites, as shown in Table 4, MPA displayed only minimal degradation at all three temperatures throughout one month of storage. This is in accordance with previously published data [26].
Table 4.
Long term stability results for MPA (A), MPAG (B) and AcMPAG (C) at concentrations of 20μg/mL at baseline, 24 hours −80°C, 24 hour 4°C, 24 hours bench top, 1 week −80°C, 1 week 4°C, 1 week bench top, 1 month −80°C, and 1 month 4°C.
| Plasma | Urine | ||||||
|---|---|---|---|---|---|---|---|
| Timepoint | Temperature | Percent deviation from nominal ± Standard deviation | Percent deviation from nominal ± Standard deviation | ||||
| MPA | MPAG | AcMPAG | MPA | MPAG | AcMPAG | ||
| 24 Hours | Benchtop | 93.0 ± 2.6 | 105.3 ± 2.5 | 14.0 ± 0.5 | 104.0 ± 2.6 | 106.7 ± 3.2 | 62.3 ± 8.2 |
| 24 Hours | 4°C | 96.9 ± 2.8 | 105.7 ± 4.9 | 96.6 ± 5.0 | 107.0 ± 1.0 | 107.7± 0.6 | 91.2 ± 2.3 |
| 24 Hours | −80°C | 91.1 ± 2.3 | 102.5 ± 3.3 | 99.5 ± 7.8 | 106.7 ± 2.1 | 105.7 ± 1.5 | 92.3 ± 3.8 |
| 1Week | Benchtop | 90.7 ± 2.7 | 90.3 ± 13.0 | 0 ± 0.0 | 89.7 ± 2.5 | 25.4 ± 3.1 | 25.1 ± 0.9 |
| 1Week | 4°C | 87.1 ± 1.2 | 96.8 ± 2.3 | 36.1 ± 0.4 | 92.3 ± 3.5 | 28.9 ± 0.2 | 64.7 ± 1.4 |
| 1Week | −80°C | 87.9 ± 3.1 | 96.8 ± 9.8 | 101.6 ± 6.2 | 89.1 ± 2.2 | 27.9 ± 0.3 | 79.3 ± 1.4 |
| 1 Month | 4°C | 82.4 ± 8.1 | 87.1 ± 5.5 | 0 ± 0.0 | 87.8 ± 0.2 | 26.4 ± 1.0 | 4.0 ± 0.1 |
| 1 Month | −80°C | 97.8 ± 1.3 | 90.4 ± 1.6 | 86.8 ± 5.0 | 82.2 ± 0.3 | 26.4 ± 0.4 | 9.8 ± 0.1 |
To cross-validate our U-HPLC-MS/MS assay with an established assay used for routine clinical therapeutic drug monitoring in an environment accredited by the College of American Pathologists, thirty de-identified plasma samples from renal transplant patients were analyzed using both assays in parallel. Passing Bablock Regression and Bland Altman Plots are shown in Figure 4A and 4B further confirming that our U-HPLC-MS/MS gave acceptable results.
Figure 4.
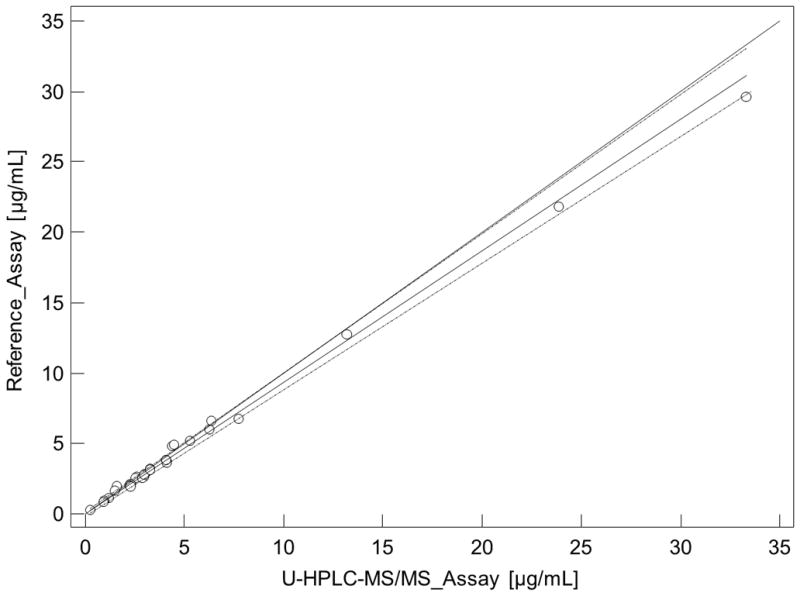
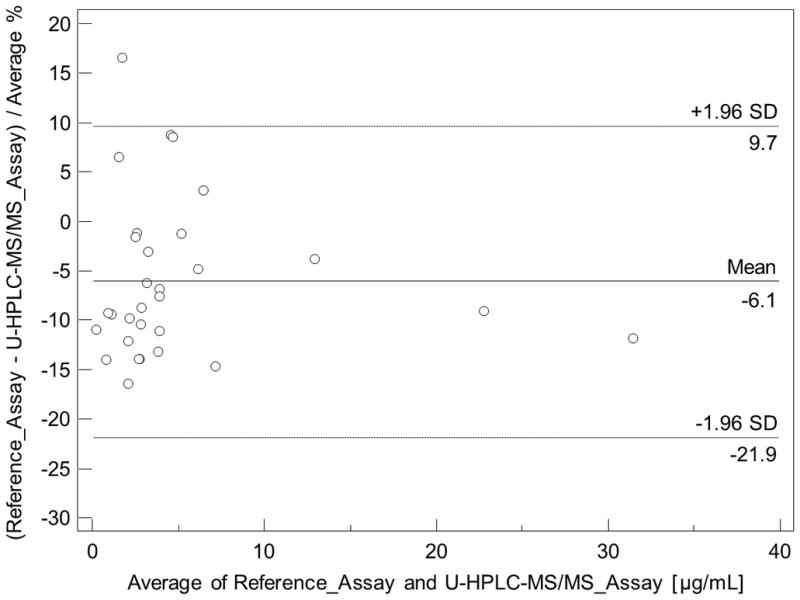
Cross-validation of mycophenolic acid (MPA) plasma concentrations as determined by the present U-HPLC-MS/MS and clinical routine reference HPLC-MS/MS assay. (A) Comparison using Passing & Bablock regression. Large dashed lines represent the confidence interval, the solid line the regression line, and the small dashed line the line of identity. (B) Bland & Altman plot. The mean difference is represented as a straight line. Plasma samples (n = 30) were from kidney recipients.
Our assay has proven to be reliable and robust during the analysis of samples from several pharmacokinetic studies with more than 400 samples successfully processed and analyzed within a single day. Based on the quality controls during the analysis of these clinical trial samples the CV% were 7.2 % for the lowest (n=12), 8.6% for the medium (n=12) and 6.6 % for the highest quality control sample (n=12) for MPA, 9.9 % for the lowest (n=12), 6.4% for the medium (n=12) and 8.7 % for the highest quality control sample (n=12) for MPAG, and 4.8 % for the lowest (n=12), 8.7% for the medium (n=12) and 6.2 % for the highest quality control sample (n=12) for AcMPAG. The corresponding accuracies were 102.7 ± 0.1 % for the lowest, 97.5 ± 0.29 % for the medium and 94.5 ± 9.4 % for the highest quality control sample for MPA, 103.7 ± 0.02 % for the lowest, 91.1 ± 0.27 % for the medium and 95.5 ± 12.48 % for the highest quality control sample for MPAG, and 98.9 ± 0.01 % for the lowest, 99.1 ± 0.16 % for the medium and 94.4 ± .4 % for the highest quality control sample for AcMPAG. The representative ion chromatograms for a clinical trial sample are shown in Figure 5.
Figure 5. Representative ion chromatograms of a patient plasma sample.
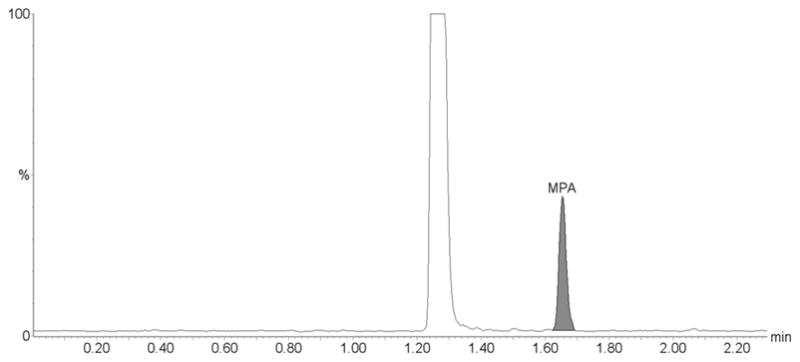
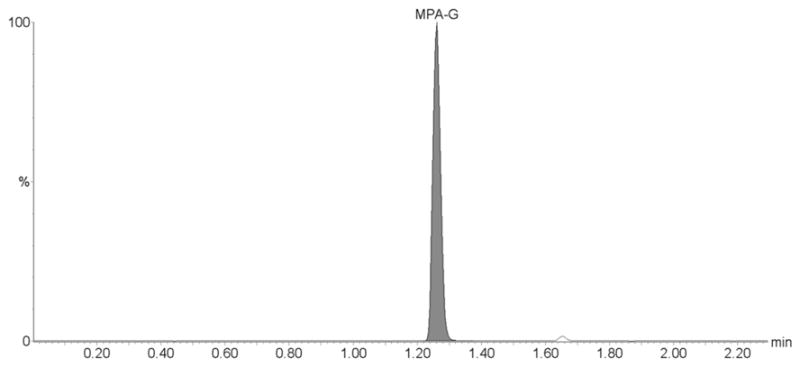
The sample is from a kidney transplant patient. The clinical trial during which this samples was collected was approved by an internal review board, followed applicable national and international guidances and the patient had given informed written consent. (A) MPA, (B) MPAG and (C) AcMPAG. The following concentrations were found: MPA: 1.03 μg/mL, MPAG: 30.82 μg/mL and AcMPAG: 0.16 μg/mL.
4. CONCLUSION
LC/MS assays are the preferred method to measure immunosuppressants, mainly due to their high specificity [15]. A potential problem with the LC-MS quantification of MPA is the formation of MPA ions due to in-source fragmentation of MPAG during electrospray ionization. Given the high MPAG concentrations in plasma and urine, this may lead to overestimation of MPA concentrations if MPA and MPAG are insufficiently separated by HPLC [15]. U-HPLC allows for complete separation of MPA, MPAG and AcMPAG within relatively short analytical run times of 2.3 min between injections. Previously published assays using U-HPLC-MS analysis either lack the analysis of the metabolites such AcMPAG, require much longer analysis times or utilize extensive multi-step sample preparation procedures [27–29]. We conclude that we developed and successfully validated a sensitive, specific and fast U-HPLC-MS/MS assay for the quantification of MPA and its major metabolites in plasma and urine including automated sample preparation in 96-well plates using a robotic system.
Footnotes
Publisher's Disclaimer: This is a PDF file of an unedited manuscript that has been accepted for publication. As a service to our customers we are providing this early version of the manuscript. The manuscript will undergo copyediting, typesetting, and review of the resulting proof before it is published in its final citable form. Please note that during the production process errors may be discovered which could affect the content, and all legal disclaimers that apply to the journal pertain.
References
- 1.Birnbaum LM, Lipman M, Paraskevas S, Chaudhury P, Tchervenkov J, Baran D, Herrera-Gayol A, Cantarovich M. Clin J Am Soc Nephrol. 2009;4:860. doi: 10.2215/CJN.05271008. [DOI] [PubMed] [Google Scholar]
- 2.Shapiro R. Keio J Med. 2004;53:18. doi: 10.2302/kjm.53.18. [DOI] [PubMed] [Google Scholar]
- 3.Sivathasan C. Transplant Proc. 2004;36:346S. doi: 10.1016/j.transproceed.2004.01.072. [DOI] [PubMed] [Google Scholar]
- 4.Christians U, Schmitz V, Schoning W, Bendrick-Peart J, Klawitter J, Haschke M, Klawitter J. Ther Drug Monit. 2008;30:151. doi: 10.1097/FTD.0b013e31816b9063. [DOI] [PubMed] [Google Scholar]
- 5.Haug C, Schmid-Kotsas A, Linder T, Bachem MG, Gruenert A, Rozdzinski E. Nephrol Dial Transplant. 2001;16:2310. doi: 10.1093/ndt/16.12.2310. [DOI] [PubMed] [Google Scholar]
- 6.Haug C, Schmid-Kotsas A, Linder T, Jehle PM, Bachem MG, Gruenert A, Rozdzinski E. Clin Sci (Lond) 2002;103(Suppl 48):76S. doi: 10.1042/CS103S076S. [DOI] [PubMed] [Google Scholar]
- 7.Sollinger HW. Clin Transplant. 2004;18:485. doi: 10.1111/j.1399-0012.2004.00203.x. [DOI] [PubMed] [Google Scholar]
- 8.Groetzner J, Kaczmarek I, Schulz U, Stegemann E, Kaiser K, Wittwer T, Schirmer J, Voss M, Strauch J, Wahlers T, Sohn HY, Wagner F, Tenderich G, Stempfle HU, Mueller-Ehmsen J, Schmid C, Vogeser M, Koch KC, Reichenspurner H, Daebritz S, Meiser B, Reichart B. Transplantation. 2009;87:726. doi: 10.1097/TP.0b013e3181963371. [DOI] [PubMed] [Google Scholar]
- 9.Farkas SA, Schnitzbauer AA, Kirchner G, Obed A, Banas B, Schlitt HJ. Transpl Int. 2009;22:49. doi: 10.1111/j.1432-2277.2008.00796.x. [DOI] [PubMed] [Google Scholar]
- 10.Ekberg H. Transplantation. 2008;86:761. doi: 10.1097/TP.0b013e3181856f39. [DOI] [PubMed] [Google Scholar]
- 11.Cronin DC, 2nd, Faust TW, Brady L, Conjeevaram H, Jain S, Gupta P, Millis JM. Clin Liver Dis. 2000;4:619. doi: 10.1016/s1089-3261(05)70130-6. [DOI] [PubMed] [Google Scholar]
- 12.Shipkova M, Schutz E, Armstrong VW, Niedmann PD, Oellerich M, Wieland E. Clin Chem. 2000;46:365. [PubMed] [Google Scholar]
- 13.Warrington JS, Shaw LM. Expert Opin Drug Metab Toxicol. 2005;1:487. doi: 10.1517/17425255.1.3.487. [DOI] [PubMed] [Google Scholar]
- 14.Kuypers DR, Le Meur Y, Cantarovich M, Tredger MJ, Tett SE, Cattaneo D, Tonshoff B, Holt DW, Chapman J, Gelder T. Clin J Am Soc Nephrol. 2010;5:341. doi: 10.2215/CJN.07111009. [DOI] [PubMed] [Google Scholar]
- 15.Yang Z, Peng Y, Wang S. Clinical and Applied Immunology Reviews. 2005;5:405. [Google Scholar]
- 16.Brandhorst G, Streit F, Goetze S, Oellerich M, Armstrong VW. Clin Chem. 2006;52:1962. doi: 10.1373/clinchem.2006.074336. [DOI] [PubMed] [Google Scholar]
- 17.Streit F, Shipkova M, Armstrong VW, Oellerich M. Clin Chem. 2004;50:152. doi: 10.1373/clinchem.2003.024323. [DOI] [PubMed] [Google Scholar]
- 18.Willis C, Taylor PJ, Salm P, Tett SE, Pillans PI. J Chromatogr B Biomed Sci Appl. 2000;748:151. doi: 10.1016/s0378-4347(00)00273-5. [DOI] [PubMed] [Google Scholar]
- 19.Platzer M, Jahn K, Wohlrab J, Neubert RH. J Chromatogr B Biomed Sci Appl. 2001;755:355. doi: 10.1016/s0378-4347(01)00064-0. [DOI] [PubMed] [Google Scholar]
- 20.Annesley TM, Clayton LT. Clin Chem. 2005;51:872. doi: 10.1373/clinchem.2004.047357. [DOI] [PubMed] [Google Scholar]
- 21.Tholen D. MLO Med Lab Ops. 2006;38:40. [PubMed] [Google Scholar]
- 22.Filler G, Bendrick-Peart J, Christians U. Ther Drug Monit. 2008;30:138. doi: 10.1097/FTD.0b013e31816ba73a. [DOI] [PubMed] [Google Scholar]
- 23.Perry TW, Christians U, Trotter JF, Bendrick-Peart J. Clin Transplant. 2007;21:413. doi: 10.1111/j.1399-0012.2007.00662.x. [DOI] [PubMed] [Google Scholar]
- 24.Yang CW, Ahn HJ, Kim WY, Li C, Jung JY, Yoon SA, Kim YS, Cha JH, Kim J, Bang BK. Transplantation. 2003;75:309. doi: 10.1097/01.TP.0000045034.48833.51. [DOI] [PubMed] [Google Scholar]
- 25.Patel CG, Mendonza AE, Akhlaghi F, Majid O, Trull AK, Lee T, Holt DW. J Chromatogr B Analyt Technol Biomed Life Sci. 2004;813:287. doi: 10.1016/j.jchromb.2004.10.004. [DOI] [PubMed] [Google Scholar]
- 26.Khoschsorur G, Erwa W. J Chromatogr B Analyt Technol Biomed Life Sci. 2004;799:355. doi: 10.1016/j.jchromb.2003.10.074. [DOI] [PubMed] [Google Scholar]
- 27.Delavenne X, Juthier L, Pons B, Mariat C, Basset T. Clin Chim Acta. 2011;412:59. doi: 10.1016/j.cca.2010.09.041. [DOI] [PubMed] [Google Scholar]
- 28.Kuhn J, Gotting C, Kleesiek K. Talanta. 2010;80:1894. doi: 10.1016/j.talanta.2009.10.040. [DOI] [PubMed] [Google Scholar]
- 29.Musuamba FT, Di Fazio V, Vanbinst R, Wallemacq P. Ther Drug Monit. 2009;31:110. doi: 10.1097/FTD.0b013e318191897d. [DOI] [PubMed] [Google Scholar]


