

Abstract
Motivation: Macromolecular crystal structures in the Protein Data Bank (PDB) are a key source of structural insight into biological processes. These structures, some >30 years old, were constructed with methods of their era. With PDB_REDO, we aim to automatically optimize these structures to better fit their corresponding experimental data, passing the benefits of new methods in crystallography on to a wide base of non-crystallographer structure users.
Results: We developed new algorithms to allow automatic rebuilding and remodeling of main chain peptide bonds and side chains in crystallographic electron density maps, and incorporated these and further enhancements in the PDB_REDO procedure. Applying the updated PDB_REDO to the oldest, but also to some of the newest models in the PDB, corrects existing modeling errors and brings these models to a higher quality, as judged by standard validation methods.
Availability and Implementation: The PDB_REDO database and links to all software are available at http://www.cmbi.ru.nl/pdb_redo.
Contact: r.joosten@nki.nl; a.perrakis@nki.nl
Supplementary Information: Supplementary data are available at Bioinformatics online.
1 INTRODUCTION
The Protein Data Bank (Berman et al., 2007; Bernstein et al., 1977) makes experimentally derived models of proteins and other macromolecules available to a multidisciplinary community all the way from structural biologists, bioinformaticians and molecular biologists of all flavors to high school teachers and even the general public. The vast majority of macromolecular models in the PDB are derived by X-ray crystallography. Over decades, a diverse community of crystallographers has optimized these models to fit the experimental data using the software and computers available at their time.
Building an initial model in the electron density (ED) map has been automated to a significant extent, with software like ARP/wARP (Langer et al., 2008), Resolve (Terwilliger, 2003), Buccaneer (Cowtan, 2006) and others, but the final steps in model building and refinement are typically left to the user. Due to lack of attention and time, and also sometimes because of simple ignorance or even incompetence, some models that are submitted in the PDB are of lower quality than what could be expected given the advent of crystallographic methods and the outstanding tools that are available. At the same time, older structure models start to lag behind in structure quality, since the current software was not available at the time of their deposition.
To overcome these effects, we built the PDB_REDO (Joosten et al., 2009) pipeline which, employing the structure refinement software REFMAC (Murshudov et al., 1997; Winn et al., 2003), can automatically optimize most of the existing structures to derive improved, up-to-date structure models based on the original experimental data that were deposited with the atomic coordinates in the PDB. The first version of the PDB_REDO pipeline merely optimized coordinates, ‘B factors’ and other model parameters within the convergence radius of the REFMAC refinement engine, but would not correct modeling errors, which would typically require human intervention.
A wealth of validation algorithms [e.g. in PROCHECK (Laskowski et al., 1993), WHAT_CHECK (Hooft et al., 1996b), MolProbity (Davis et al., 2007) or Coot (Emsley et al., 2010)] exists, all using in various ways our increasing knowledge of macromolecular structure to extract quality criteria, which enable to pinpoint likely errors in macromolecular models. The PDBREPORT databank (Hooft et al., 1996b), for example, shows that there exist 70 000 unusual peptide bond conformations and >200 000 unusual side chain rotamers. All these algorithms suggest that many features of models already in the PDB are likely wrong, but no automated mechanism currently exists to decide if a better modeling of specific areas would be better consistent with the validation criteria, correct these errors where applicable and make the new, corrected models available to the user community. Granted the task of a well-trained crystallographer correcting such errors with the help of interactive graphics programs such as Coot and O (Jones et al., 1991), guided by the model validation software, is rather trivial. However, no matter how trivial correcting these errors might be, it is extremely unlikely that the authors of the tens of thousands of models in the PDB keep correcting them as better validation, building and refinement methods are developed. At the same time, providing the same tools to current day practicing crystallographers can help correcting errors prior to deposition.
Most available validation tools have their own limitations. First, they do not take the ED maps (which represent the experimental data) into account. Second, they only flag the ‘bad’ parts of the model, skipping parts of the model that are reasonable but can be improved.
In addition, uniformity in the database is highly desirable for many end-user groups, e.g. the modeling and docking communities. However, ‘best practice guides’ in the field of macromolecular crystallography are anything but settled, and sometimes many approaches exist to solve the same problem. For example, there are still lively debates about whether one should build disordered side chains in the most likely conformation and use the B-factors to indicate disorder, set the occupancy of their atoms to zero or not build them at all. An additional advantage of an automated rebuilding method applied to all models in the PDB is that at the very least it will use a uniform strategy to resolve such modeling dilemmas.
Here we first present two fully automated algorithms, pepflip and SideAide, that check and (if needed) correct or improve peptides and side chains in the context of both their geometry and their ED, without manual intervention. These developments are combined with treatment of twin data, optimization of B-factor restraints and use of anisotropic B-factors, which have also been newly incorporated in the PDB_REDO pipeline. Our procedure brings speed, objectivity, uniformity and reproducibility to model rebuilding, both in the context of correcting the existing PDB models and helping crystallographers to submit better models to the PDB.
2 METHODS
2.1 Dataset selection
PDB entries deposited before 1983, and for which the experimental data were available, were selected and sorted by deposition date. We call this as PDB ‘legacy’ dataset. Structures lacking a reported R-factor (in the PDB file or the literature) were manually inspected for their fit to the ED maps; structures with a reported R-factor were included in the set if the R-factor could be reproduced within 10 percentage points. Some structures needed extra treatment to ensure PDB_REDO ran properly (Supplementary Table S1 for details). Noteworthy is the case for the 30-year-old entry 2ACT: the depositors recovered the missing diffraction data file (a remarkable feat) and resubmitted the data directly to the PDB. The 30 oldest structures that passed these criteria were used. It should also be noted that these datasets contains some redundant structures—11 datasets correspond to mammalian trypsins, four to B-DNA dodecamers and three to cytochrome c structures—but we chose to use these structures and preserve the ‘historical’ character of the selection.
For the ‘recent’ dataset, a non-redundant (<30% sequence identity) subset of all X-ray structures released by the PDB on June 16, 2010 with resolution of 3.0 Å or better was selected. After removing entries for which the R-factor could not be reproduced to within 10 percentage points, the first 30 (sorted alphabetically) PDB entries were used.
The PDB entries for both the legacy and the recent dataset are listed in Supplementary Table S2.
2.2 Analysis
The original PDB entries and the optimized structure models were additionally validated with MolProbity (Davis et al., 2007). These results and the validation results from WHAT_CHECK were analyzed using R to make box-and-whiskers plots.
The nature of the percentiles given by MolProbity allows for direct comparison of the test set to the PDB. In order to do the same for the R-factors and the Ramachandran Z-scores, the averages and SDs of these values were calculated for a reference set consisting of 16 000 (randomly selected) PDB entries. The average R-factor was 20.0±3.0% and the Ramachandran plot Z-score was −1.4±1.7. These data were used to show that for all three model quality metrics, our optimization procedure moves the test set from being worse than average to being better than average in the PDB.
The structure models were visually inspected using Coot to find representative examples of rebuilt parts of the protein models. The molecular images were made with PyMOL and the Ramachandran plots with Coot.
3 RESULTS
The new automated software we introduce implements well-established crystallographic practices, ‘peptide flips’ and building side chain ‘rotamers’. The emphasis and novelty in these algorithms is in decision making and in full automation, eliminating the need for any user decision and bringing uniformity to the process of creating the ‘final’ molecular models that are based on X-ray crystallographic data.
3.1 Density fit metrics
The first step in determining the model that best represents the ED is to agree on a metric or validation score. Although the real-space R-factor (RSR) and the real-space density correlation coefficient (RSCC) (Jones et al., 1991) are commonly used, they have their limitations. Currently, no satisfying all-purpose metric exists for crystallographic uses. We chose to use three different metrics for the density fit, each with their own advantages for their specific task.
The simplest and fastest method we use is cubic (spline) interpolation as implemented in the Clipper library (Cowtan, 2003). This method determines the density at a given position by interpolating the neighboring grid points. The algorithm is fast, but it does not take the shape of (a set of) atoms into account nor is the resulting value normalized. We use this method to compute the density fit of the backbone in the initial stage of pepflip, when speed is of more importance than accuracy.
Cubic interpolation is, however, insufficient to differentiate between—for example—a spike in the difference density map and a true (Gaussian-like) peak representing an unmodeled or wrongly modeled atom. To calculate the theoretical ED contributed by a set of atoms at a gridpoint xg, we assume that each atom a at position xa contributes a Gaussian-like function:
| (1) |
Where ratom represents the fully static atom, U=Batom /8π2 the mean displacement of that atom and the second term of the exponential is used to reduce the tail of theoretical density. Given the observed ED for a point in the map, ρ(x), we can then calculate a weighted mean (WM), representing the fit of a group of atoms in an area of the map:
| (2) |
This metric is implemented in the processor instruction set SSE2 (allowing multiple floating point operations concurrently) making it relatively fast. It is used whenever accuracy, shape and speed are of importance.
In some cases though, e.g. when fitting rotamers, we want to compare the fit of two side chains of the same amino acid type in different (parts of the) maps. This means a normalized metric is needed. We chose the RSCC:
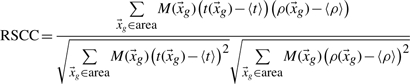 |
(3) |
Where t(x) is given by expression (1) and M(x) is the masking function for a radius Mr around the atoms of interest, given by:
| (4) |
The implementation for this metric is the slowest of the three. Note that it has its own drawbacks, given the quirks of crystallography. For example, it will not differentiate between a strong and a weak peak in the difference density, which renders it useless for the detection of e.g. unmodeled single atoms.
3.2 Detecting and correcting peptide flips
Pepflip optimizes the orientation of the peptide planes in the main chain by inverting the plane's orientation (a ‘peptide flip’; Fig. 1A), where needed. Either the density of the main chain or clear difference density at the position of the oxygen atom can indicate the presence of a wrongly chosen peptide plane. However, flipping a peptide plane will distort the main chain torsion angles, so real-space refinement is required before a final decision between the two orientations can be made. To study every peptide without wasting time on the refinement of unlikely candidates, the algorithm consists of two phases (see Supplementary Fig. S1 for a flowchart).
Fig. 1.

Examples of model rebuilding performed in PDB_REDO. (A) A peptide flip improves the fit with the 2mFo-DFc ED map (light blue, contoured at 1.3 r.m.s.) and removes the difference peaks in the mFo-DFc difference map (green [+] and red [−], contoured at 3.0 r.m.s.), while creating a new hydrogen bond (dotted line) (PDB:155C). (B) Rebuilding the side chain results in a better fit (PDB:1OVO). (C) The previously missing nitrogen atoms make the ionic interaction with the negatively charged C-terminus of the protein obvious (PDB:2TPI). (D) Flipping the histidine and rebuilding the threonine, results in a net gain of three hydrogen bonds (PDB:3JXV).
In the first phase, all peptides that show improved RSCC fit against the 2mFo-DFc ED map when flipped, as well as peptides that display peaks in the mFo-DFc difference map near the backbone oxygen in either position, are flagged. In the second phase, these candidate peptides are refined in both the original and the ‘flipped’ orientation using the real-space refinement engine from Coot (Emsley et al., 2010; Joosten et al., 2008). The choice on the best version is made stepwise, resembling the decision process of a crystallographer, using knowledge of the density fit of the main chain, the difference density fit of the oxygen atom, the Ramachandran plot (Kleywegt and Jones, 1998) and the geometrical goodness of fit as given by Coot's refinement engine. In cases where the ED map holds enough information (lower than the map average minus three times the SD), the orientation of the original peptide is kept.
Within the PDB_REDO pipeline, peptides with backbone oxygen or nitrogen atoms flagged by LINK-records in the PDB header (denoting they are involved in chemical interactions with other compounds, for instance in metal ion coordination) are excluded from pepflip analysis. No peptide flips are performed at resolution <3.5 Å, because the maps are typically not informative enough.
3.3 Correcting bad side chain rotamers
The method we use is based on the side chain building algorithm of Snow (Cohen et al., 2004), which we have extended to be used stand-alone in the context of automated structure model optimization. The procedure consists of three main steps.
First, the main chain, metal ions, ligands, side chains with multiple conformations and the side chains of residues with links to metal ions or ligands are masked out of the 2mFo-DFc map by setting the density to  . This step ensures that no overlap can occur between the existing, trusted parts of the structure and the side chains to be optimized. Second, for every side chain the best rotamer from an extended version of the ‘Penultimate Rotamer Library’ (Lovell et al., 2000) is selected based on the RSCC fit with the map. At this stage, the Cα atom is allowed to shift in Cartesian space by a maximum of 0.2 Å, increasing search space and the likelihood that the correct rotamer is found. Especially for amino acid types with aromatic rings this shift can be crucial. After the best rotamer is selected, the rotamer is masked out of density and the algorithm proceeds to the next side chain in question. In the third and final step, after reverting to the initial masked map, every chosen rotamer is refined in real space, using a torsion angle parameterization employing the same order as in the previous step. Since refinement is a local operation and speed is of the essence the WM metric is used. The final density fit is then compared with the fit of the original conformation of the side chain. When the score of the original is better than the newly built side chain, the original conformation is stored otherwise the new conformation is chosen. When the density fit scores are equal, the new conformation is chosen, since it is more likely a rotameric conformation, given the limited divergence radius of the refinement.
As an additional feature, SideAide can flip or rotate final torsion angles by 180○ for selected side chains. In PDB_REDO, this mode is used in conjunction with WHAT_CHECK (Hooft et al., 1996b) to optimize hydrogen bonding for histidine, glutamine and asparagine by flipping their χ2, χ3, and χ2 torsion angles, respectively (Hooft et al., 1996a) (Fig. 1D).
3.4 Optimization and rebuilding procedure
In addition to these new developments, we automated a series of REFMAC refinement extensions: utilization of automatic de-twinning of experimental data, optimization of the B-factor restraint weight and refinement of anisotropic B-factors when the ratio of experimental data and model parameters is sufficient.
The PDB_REDO pipeline (version 3.10) consists of a conservative (optimization) and a progressive (rebuilding) phase. The conservative phase follows the original PDB_REDO method (Joosten et al., 2009) with several enhancements:
The PDB files are additionally validated with PDB-care (Lutteke and von der Lieth, 2004) to detect superfluous carbohydrate atoms. These are removed together with all atoms that have their occupancy set to zero. This improves the generation of geometric restraints in refinement. All ‘unknown’ atoms and ligands (marked in the PDB as UNX and UNL residues) are also removed, because no scattering factors can be determined for atoms of unknown chemical element.
The bulk solvent model used in the original refinement is extracted from the PDB header and used for recalculating the initial R(-free).
Automated de-twinning is used for recalculating R(-free) when the values of the PDB header cannot be reproduced to within five percentage points. In the following refinement steps, de-twinning is used whenever a twin with twin fraction >5% is found.
Anisotropic B-factors (nine model parameters per atom) are used in refinement when the data to parameter ratio is >2. Isotropic B-factors (four model parameters per atom) are used when the data to parameter ratio drops <1.5. With an intermediate data to parameter ratio (1.5–2), both methods are tested, and anisotropic B-factors are used if they give an improvement of R-free of better than one percentage point compared with isotropic B-factors. We only use a TLS model together with isotropic B-factors.
The weight between X-ray and geometry terms used in re-refinement is resolution dependent, based on experience from the first round of PDB_REDO. Looser geometric restraints are tested for high-resolution structure models, while for low-resolution structure models only tight geometric restraint weights are tried.
In addition to the weight between X-ray and geometry terms, we now optimize the relative weight of B-factor restraints and others by testing seven different values. The B-factor restraint giving the best free likelihood score is used in all refinement stages.
In all cases, explicit hydrogen atoms were removed and riding hydrogens were used in refinement to reduce atomic bumps.
To compensate for the lack of accurate refinement methods in the 1970s and 1980s, all models from that era are subjected to 15 cycles of rigid-body refinement and all further refinement steps are done with an increased number of cycles.
The rebuilding phase of the structure optimization uses the optimally re-refined structure model and the accompanying ED maps.
First, pepflip is used to fix the backbone where needed.
Second, SideAide is used to rebuild all side chains; the new model is then validated with WHAT_CHECK to find asparagine, glutamine and histidine side chains that should be flipped to improve hydrogen bonding, and these flips are then performed by a separate run of SideAide.
Third, the rebuilt structure model is refined again with the same parameter settings as the last step of the conservative refinement, but with three different geometric restraint weights: the optimal weight from the conservative optimization phase, a slightly tighter restraint weight and a slightly looser restraint weight. The optimal final structure model is selected based on the free likelihood score and validated with WHAT_CHECK.
Finally, all results are combined to make an entry for the PDB_REDO databank at http://www.cmbi.ru.nl/pdb_redo.
To establish the power and identify caveats of the new PDB_REDO pipeline incorporating the above developments, we chose to apply it to a selection of models from the PDB and evaluate all results both with validation suites, and also by manual inspection.
3.5 Analysis of two test sets: PDB_REDO for old and new structures from the PDB
We first chose to showcase the ability of PDB_REDO to improve the oldest structure models from the PDB, deposited between 1976 and 1982. Of the 30 structure models used, 23 were protein and 7 were nucleic acid models. This is a very special collection of models, where the methods used to construct them were rather primitive, but the attention paid to model building was, by today's standards, enormous. Apart from this ‘legacy’ test set, we also used the new pipeline on a ‘recent’ dataset consisting of 30 relatively new PDB entries (released on June 16, 2010) to see if our algorithms are also powerful for optimizing newly deposited structure models.
The new PDB_REDO procedure could improve the fit of all structure models in the ‘legacy’ dataset to their original experimental data. The free R-factor (29) could not be used because these structures were determined well before its introduction in 1992, so the regular R-factor was used, which went down from 22±6% to 18±4% (Fig. 2A) on average. The geometric quality of the structure models also increased substantially: WHAT_CHECK's Ramachandran plot Z-score (Hooft et al., 1997) improved from −2.3±2.2 to −1.3±1.8 (Fig. 2B) and MolProbity's Clashscore percentiles (Davis et al., 2007) improved from 48±32 to 80±27 (Fig. 2C). An analysis of these scores compared with the rest of the PDB shows that for all these model quality metrics, the new PDB_REDO procedure moves this test set from being worse than the PDB average to being considerably better. Notably, although PDB_REDO does not rebuild nucleic acids, it improved considerably the seven nucleic acid structures in the legacy set; e.g. the MolProbity clash score percentiles improved from 63±33 to 84±33 and the rmsZ for bonds changed from 2.44±0.33 to the much more reasonable value of 0.31±0.16. Histograms of the changes in all the above scores are shown in Supplementary Figure S2. Some specific improvements for the structure model of Paracoccus denitrificans cytochrome c550, determined in 1976 at 2.5 Å resolution (PDB: 155c; Timkovich and Dickerson, 1976) are shown in Figure 4.
Fig. 2.

Box-and-whiskers plots for structure model quality metrics calculated for the original PDB entries and after PDB-REDO. The open boxes show the ‘legacy’ PDB files, the filled boxes the ‘recent’ dataset. The whiskers cover all data points within 1.5 times the inter-quartile range and the circles denote outliers. The dotted lines mark the PDB averages. (A) R-factor. (B) Ramachandran plot Z-score from WHAT_CHECK. (C) All-atom Clashscore from MolProbity as percentile relative to PDB entries of similar resolution.
Fig. 4.

Examples of side chain remodeling and the fit to corresponding ED maps (light blue, contoured at 1.3 r.m.s.) before and after PDB_REDO. The arrows in the Ramachandran plots show the change in the backbone torsion angles after rebuilding (examples from 155c).
The results with the ‘recent’ dataset (Fig. 2) are similar to the ‘legacy’ data, albeit the average improvements are understandably less. The average value for the R-factor changed from 18±3% to 17±3% and the free R-factor from 21±4% to 20±4%; the Ramachandran plot Z-score improved from −0.5±1.0 to −0.3±1.1 and the Molprobity percentiles improved from 74±24 to 84±17. The histogram of changes in the scores (Supplementary Fig. S2) shows that these indicators do not change notably for many of these structures, but at the same time 27 get a lower R-factor, 18 have less clashes and 19 show a better Ramachandran score. In one of the examples (3HRV), the MolProbity clashscore was improved from the 5th percentile to the 80th percentile. These results show that PDB_REDO can also improve the most recently submitted structures and that current day depositors can benefit from using PDB_REDO pipeline to improve a structure model before it is submitted to the PDB (see for example Peng et al., 2010).
4 DISCUSSION
We have created new algorithms to automate two significant steps in finalizing protein model building in crystallographic ED maps. These enable the unsupervised decision making and correction of ‘peptide flips’ and ‘rotamers’. Incorporation of these programs in the framework of the PDB_REDO pipeline, which has been enhanced by additional features we also describe in this article, enables us to actively change the models of the PDB and correct errors that have been identifiable for over a decade.
The pepflip program detects likely peptide flips, refines and evaluates alternative models and decides automatically if the new model is better than the old one, based on the fit with the ED map and geometric criteria. Every peptide, and not just the ones that deviate from the consensus of a database, is inspected using the ED maps. This increases coverage of the structure model and minimizes the chance that real flips are missed. We checked all flips in our test set manually (15 in the ‘legacy’ test set and 16 in the ‘recent’ test set), to see whether they were correct and were unable to detect any obvious errors. In Figure 3, we show a few selected applied peptide flips after the final refinement by REFMAC: albeit the density alone would be a bad criterion for these cases (especially when compared with the obvious example showcased in Fig. 1A), considering the improvement in density fit combined with the Ramachandran plot quality (Kleywegt and Jones, 1998), the choice in the optimized models appears best.
Fig. 3.

Examples of peptide flips and the fit to corresponding ED maps (light blue, contoured at 1.1 r.m.s.) before and after PDB_REDO. For each flip, the change in backbone torsion angles of the two residues involved is marked by arrows in the Ramachandran plot.
SideAide, also checks all side chains regardless of residue type or geometric quality; it is not limited to rebuilding side chains that were found to be rotamer outliers, as e.g. the implementation in Phenix (Adams et al., 2010); and it is not specific for some residue types, as Autofix (Headd et al., 2009) that uses additional geometric criteria (e.g. atomic clashes) to correct valine, threonine, leucine and arginine residues. This enables fixing side chains that are acceptable in terms of geometry, but do not optimally fit the ED maps, which could be overlooked otherwise.
To fit all side chains optimally, SideAide fits the side chains by residue type, starting with small residues (Supplementary Table S3), rather than sequentially: this helps avoid ‘cascading fitting errors’, where one long side chain ends up in the density of another side chain, forcing the second side chain to move to another side chain's density and so on. For example, long and relatively often disordered arginine side chains have the greatest risk of causing fitting errors and are therefore fitted last. A new side chain conformation is chosen only if it improves the fit with the maps; else the original side chain is kept. This ensures that true non-rotameric side chains, which can occur at active sites and other important parts of a protein, are not forced into the wrong conformation. Some characteristic side chain remodelings are shown in Figure 4. It is noteworthy, that refitting the side chains to better rotamers often allows considerable backbone movement and a marked improvement in geometric quality of the main chain.
To identify potential fitting errors with an independent method, we compared the per-residue RSCC and RSR of the original model and the optimized model, calculated using the method described for the Electron Density Server (Kleywegt et al., 2004). We find that while the fit of most residues to the ED map did not change much (Supplementary Fig. S3), the fit of a significant fraction of residues got markedly better, while the fit of a few residues appeared to have deteriorated. We visually inspected the 50 worst cases where the RSCC went down or the RSR went up. The majority of outliers were in regions of the protein models, which exhibit a high degree of disorder. We noticed that in these original models, the B-factors were kept quite low during the original refinement that resulted in an appreciable contribution of these atoms to the phase set and the resulting ED map. In the PDB_REDO models, B-factors for these atoms were restrained less and were very high, according to current advisable crystallographic practice and the choice in the PDB_REDO protocols. As a result, the model contribution in these areas was reduced, and no ED was observed. We think that these represent the genuine overinterpreted areas of density in the PDB models. The remaining outliers were introduced by the addition of previously missing side chains, most of which are in low density. We choose to model all side chains in the most probable conformation; we believe that a reasonable estimate of the side chain's position can be made based on the main chain coordinates and prior knowledge about possible rotamers. It is noteworthy, that in the ‘legacy’ dataset, which had not benefited from the notion of rotamers that was introduced in the late 1980s, 10±12% of the side chains were not in a standard rotamer conformation but after optimization this dropped to 2±3%. Moreover, we showed that changing side chain orientation results in better backbone geometry (Fig. 4). Finally, modeling disordered side chains in multiple conformations is surely a direction that needs to be explored in future work.
Our results show that the oldest models in the PDB can be brought up to and beyond the current quality standards by automated optimization, whereas many new PDB models can benefit from it as well. PDB_REDO renders existing PDB entries better suitable for future structural biology research, ensuring long-term visibility and usefulness of the original crystallographic work. The model rebuilding procedures and refitting to ED maps has added value for many disciplines. In homology modeling, ensuring the main chain of the template structure (which tends to be kept ‘as-is’ as much as possible) has no errors, helps make a better homology model. Getting the hydrogen bonding network right, as we do during main chain and side chain modeling, is also important for drug docking and a prerequisite for simulation stability in molecular dynamics calculations. Adding side chain atoms not built in the original structure or flagged as ‘not there’ by setting the occupancy to zero (common practice of many crystallographers to denote disorder), or changing their placement, changes the calculated electrostatic potential of a protein and can affect drug docking studies and simulations.
The first PDB_REDO step was curating the data and optimizing the fit of existing models. Here we describe the second step, in which real-space rebuilding automatically changes existing model parameters. Rotamer re-building and peptide-flips are straightforward to correct using interactive graphics software, provided that an experienced and willing crystallographer does so. By automating these procedures, with objective, reproducible, reliable and time-efficient tools, PDB_REDO now provides the means to both correct such occasional errors in the PDB, but can also help to prevent them when used by practicing X-ray crystallographers.
In the next step, we aim to build side chains in multiple conformations and detect and rebuild poorly fitted loops, possibly also in multiple conformations, remove modeled solvent molecules or add them were appropriate and include automated definition and refinement of TLS parameters and non-crystallographic symmetry restraints. Currently, PDB_REDO does not make any effort to rebuild non-protein components of the structures (e.g. nucleic acids, carbohydrates and ligands), but only optimizes them based on the latest geometry dictionaries; rebuilding non-protein entities and dealing with non-standard geometries (e.g. isopeptide linkages) will be the next big challenge in PDB_REDO. These developments should further improve structure model quality and thus provide even better insights in the biology of proteins.
The models, validation reports and the software used are available at http://www.cmbi.ru.nl/pdb_redo/. PDB_REDO entries are regularly updated and new PDB entries are ‘redone’ typically within 14 days of public release, using the latest PDB_REDO version available.
ACKNOWLEDGEMENTS
We thank E.J. Dodson for supplying additional experimental X-ray data and M.G. Rossmann for advice on PDB entry 5ldh. We thank Titia K. Sixma for critically reading the manuscript and for supporting this project.
Funding: NIH grant (R01 GM62612 to R.P.J, K.J., S.X.C. and A.P); NCF provided use of supercomputer facilities; VENI grant from the NWO/CW (700.55.405) (to S.X.C); R.P.J and G.V. thank NBIC for financial support for the generation of PDB_REDO.
Conflict of Interest: none declared.
Footnotes
†The authors wish it to be known that, in their opinion, the first two authors should be regarded as joint First Authors.
REFERENCES
- Adams P.D., et al. PHENIX: a comprehensive Python-based system for macromolecular structure solution. Acta Crystallogr. D. Biol. Crystallogr. 2010;66:213–221. doi: 10.1107/S0907444909052925. [DOI] [PMC free article] [PubMed] [Google Scholar]
- Berman H., et al. The worldwide Protein Data Bank (wwPDB): ensuring a single, uniform archive of PDB data. Nucleic Acids Res. 2007;35:D301–D303. doi: 10.1093/nar/gkl971. [DOI] [PMC free article] [PubMed] [Google Scholar]
- Bernstein F.C., et al. The Protein Data Bank: a computer-based archival file for macromolecular structures. J. Mol. Biol. 1977;112:535–542. doi: 10.1016/s0022-2836(77)80200-3. [DOI] [PubMed] [Google Scholar]
- Cohen S.X., et al. Towards complete validated models in the next generation of ARP/wARP. Acta Crystallogr. D. Biol. Crystallogr. 2004;60:2222–2229. doi: 10.1107/S0907444904027556. [DOI] [PubMed] [Google Scholar]
- Cowtan K. The Clipper C++ libraries for x-ray crystallography. IUCr Comput. Comission Newsl. 2003;2:4–9. [Google Scholar]
- Cowtan K. The Buccaneer software for automated model building. 1. Tracing protein chains. Acta Crystallogr. D. Biol. Crystallogr. 2006;62:1002–1011. doi: 10.1107/S0907444906022116. [DOI] [PubMed] [Google Scholar]
- Davis I.W., et al. MolProbity: all-atom contacts and structure validation for proteins and nucleic acids. Nucleic Acids Res. 2007;35:W375–W383. doi: 10.1093/nar/gkm216. [DOI] [PMC free article] [PubMed] [Google Scholar]
- Emsley P., et al. Features and development of Coot. Acta Crystallogr. D. Biol. Crystallogr. 2010;66:486–501. doi: 10.1107/S0907444910007493. [DOI] [PMC free article] [PubMed] [Google Scholar]
- Headd J.J., et al. Autofix for backward-fit sidechains: using MolProbity and real-space refinement to put misfits in their place. J. Struct. Funct. Genomics. 2009;10:83–93. doi: 10.1007/s10969-008-9045-8. [DOI] [PMC free article] [PubMed] [Google Scholar]
- Hooft R.W., et al. Positioning hydrogen atoms by optimizing hydrogen-bond networks in protein structures. Proteins. 1996a;26:363–376. doi: 10.1002/(SICI)1097-0134(199612)26:4<363::AID-PROT1>3.0.CO;2-D. [DOI] [PubMed] [Google Scholar]
- Hooft R.W., et al. Errors in protein structures. Nature. 1996b;381:272. doi: 10.1038/381272a0. [DOI] [PubMed] [Google Scholar]
- Hooft R.W., et al. Objectively judging the quality of a protein structure from a Ramachandran plot. Comput. Appl. Biosci. 1997;13:425–430. doi: 10.1093/bioinformatics/13.4.425. [DOI] [PubMed] [Google Scholar]
- Jones T.A., et al. Improved methods for the building of protein models in electron density maps and the location of errors in these models. Acta Crystallographica. Section A. 1991;47:110–119. doi: 10.1107/s0108767390010224. [DOI] [PubMed] [Google Scholar]
- Joosten K., et al. A knowledge-driven approach for crystallographic protein model completion. Acta Crystallogr. D. Biol. Crystallogr. 2008;64:416–424. doi: 10.1107/S0907444908001558. [DOI] [PMC free article] [PubMed] [Google Scholar]
- Joosten R.P., et al. PDB_REDO: automated re-refinement of X-ray structure models in the PDB. J. Appl. Crystallogr. 2009;42:376–384. doi: 10.1107/S0021889809008784. [DOI] [PMC free article] [PubMed] [Google Scholar]
- Kleywegt G.J., Jones T.A. Efficient rebuilding of protein structures. Acta Crystallogr. D. Biol. Crystallogr. 1996;52:829–832. doi: 10.1107/S0907444996001783. [DOI] [PubMed] [Google Scholar]
- Kleywegt G.J., Jones T.A. Databases in protein crystallography. Acta Crystallogr. D. Biol. Crystallogr. 1998;54:1119–1131. doi: 10.1107/s0907444998007100. [DOI] [PubMed] [Google Scholar]
- Kleywegt G.J., et al. The uppsala electron-density server. Acta Crystallogr. D. Biol. Crystallogr. 2004;60:2240–2249. doi: 10.1107/S0907444904013253. [DOI] [PubMed] [Google Scholar]
- Langer G., et al. Automated macromolecular model building for X-ray crystallography using ARP/wARP version 7. Nat. Protoc. 2008;3:1171–1179. doi: 10.1038/nprot.2008.91. [DOI] [PMC free article] [PubMed] [Google Scholar]
- Laskowski R.A., et al. PROCHECK: a program to check the stereochemical quality of protein structures. J. Appl. Cryst. 1993;26:283–291. [Google Scholar]
- Lovell S.C., et al. The penultimate rotamer library. Proteins. 2000;40:389–408. [PubMed] [Google Scholar]
- Lutteke T., von der Lieth,C.W. pdb-care (PDB carbohydrate residue check): a program to support annotation of complex carbohydrate structures in PDB files. BMC Bioinformatics. 2004;5:69. doi: 10.1186/1471-2105-5-69. [DOI] [PMC free article] [PubMed] [Google Scholar]
- Murshudov G.N., et al. Refinement of macromolecular structures by the maximum-likelihood method. Acta Crystallogr. D. Biol. Crystallogr. 1997;53:240–255. doi: 10.1107/S0907444996012255. [DOI] [PubMed] [Google Scholar]
- Peng Y.H., et al. Structural basis for the improved potency of peroxisome proliferator-activated receptor (PPAR) agonists. ChemMedChem. 2010;5:1707–1716. doi: 10.1002/cmdc.201000194. [DOI] [PubMed] [Google Scholar]
- Terwilliger T.C. Automated main-chain model building by template matching and iterative fragment extension. Acta Crystallogr. D. Biol. Crystallogr. 2003;59:38–44. doi: 10.1107/S0907444902018036. [DOI] [PMC free article] [PubMed] [Google Scholar]
- Timkovich R., Dickerson R.E. The structure of Paracoccus denitrificans cytochrome c550. J. Biol. Chem. 1976;251:4033–4046. doi: 10.2210/pdb155c/pdb. [DOI] [PubMed] [Google Scholar]
- Winn M.D., et al. Macromolecular TLS refinement in REFMAC at moderate resolutions. Methods Enzymol. 2003;374:300–321. doi: 10.1016/S0076-6879(03)74014-2. [DOI] [PubMed] [Google Scholar]