

Abstract
Type 1 diabetes (T1D) is an autoimmune disease that destroys the insulin-producing beta-islet cells of the pancreas. Currently, there are no treatment modalities for prevention of T1D, and the mechanisms influencing disease inception and early progression are not well understood. We have used the insulin 2−/− non-obese diabetic (Ins2−/− NOD) model to study stages of T1D and to examine the protective effects of a potent analogue of 1α,25-dihydroxyvitamin D3, 2α-methyl-19-nor-(20S)-1α,25-dihydroxyvitamin D3 (2AMD). Pancreatic tissues from control and 2AMD-treated Ins2−/− NOD mice were obtained weekly from 5 to 16 weeks of age. Using immunohistochemical (IHC) analysis, samples were analysed for changes in beta cell survival, islet structure and T cell invasion. Weekly intraperitoneal glucose tolerance tests (IPGTT) were performed to assess comparative beta cell function in control and treated animals. IHC demonstrated progressive beta cell destruction in control mice. In contrast, 2AMD treatment preserved islet cell architecture, arrested intra-islet T cell invasion and prevented the transition from insulitis to diabetes. IPGTT results revealed progressive impairment of beta cell function with increasing age in control mice, while 2AMD treatment resulted in normal beta function throughout the study. These results demonstrate that the Ins2−/− NOD model provides a rapid and effective method for studying T1D and for assessing efficacy of anti-diabetic agents.
Keywords: beta cells, insulin 2 knock-out NOD mice, islets of Langerhans, T cells, type 1 diabetes
Introduction
Type 1 diabetes (T1D) is a disease caused by an autoimmune response that destroys beta cells of the pancreas [1–6]. Overt disease is preceded by a long and clinically silent period during which immune-mediated events progress through several stages [5,7–10]. T1D is triggered in genetically susceptible individuals by ill-defined environmental factors. There is a subsequent breakdown of self-tolerance and a recruitment of autoreactive T cells. Destruction of beta cells progresses until the final stage of glucosuria, hyperglycaemia and multi-organ dysfunction.
In humans, our understanding of cellular, molecular and immune mechanisms leading to beta cell death is limited by the inability to sample pancreatic tissue during development of T1D. Consequently, most available information is derived from animal models of the disease.
The non-obese diabetic (NOD) mouse has been the preferred model for T1D. NOD mice develop spontaneous autoimmune diabetes resulting from many of the same genetic factors found in humans [11–16]. Moreover, gene variants and multiple molecular mediators are common to both species [17]. Despite this, most therapies that prevent or reverse T1D in NOD mice have failed in humans [18,19]. It follows, therefore, that focus on the NOD model is insufficient for developing therapies for T1D.
We examined the potential of the insulin 2-/- (Ins2-/-) NOD model for understanding the pathology of T1D at various stages. The Ins2-/- NOD mouse has the same characteristics as the NOD mouse [20]. However, unlike humans, mice have two non-allelic insulin genes, identified as insulin 1 (Ins1) and insulin 2 (Ins2) [21]. While both Ins1 and Ins2 are expressed in islets, only Ins2 is expressed in the thymus [22]. Expression of insulin in the thymus is critical for eliminating insulin autoreactive T cells and in mediating self-tolerance towards pancreatic beta cells [23]. Mice with impaired thymic insulin levels have increased T cell activity to insulin, resulting in a more rapidly developing and severe disease. Variations in thymic insulin similarly influence susceptibility to T1D in humans [24,25]. A polymorphic variable number of tandem repeats (VNTR), located in the promoter region of the human insulin gene, is the second strongest genetic association with T1D (after the major histocompatibility complex). The VNTR affects insulin in the thymus, in which insulin correlates inversely with increased risk for disease [23–25].
Compared to NOD mice, T1D in the Ins2-/- NOD model is characterized by higher incidence, accelerated onset and more aggressive pathogenesis; in the NOD model, 70–80% of female and only 20–30% of male mice develop T1D at 10–38 weeks of age. In contrast, 100% of both female and male Ins2-/- NOD mice develop the disease at 9–15 weeks in females and 12–21 weeks in males [26]. The absence of gender bias in the Ins2-/- NOD model renders the model more analogous to human T1D than the NOD model.
Using the Ins2-/- NOD model, we determined the ability of a potent vitamin D analogue, 2α-methyl-19-nor-(20S)-1α,25-dihydroxyvitamin D3 (2AMD) (Fig. 1) to prevent T1D [27]. 2AMD suppresses development of T1D, preserves islet cells and has a significant impact on beta cell survival and function.
Fig. 1.
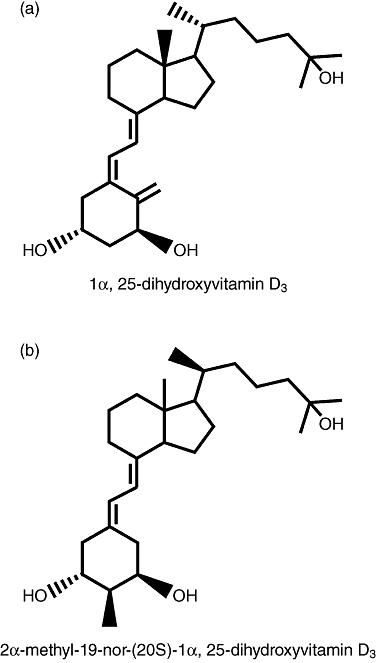
(a) Structure of the natural vitamin D hormone and (b) the analogue 2α-methyl-19-nor-(20S)-1α,25-dihydroxyvitamin D3 (2AMD).
Materials and methods
Animal production and maintenance
A mouse colony was produced from Ins2+/- NOD breeder pairs purchased from The Jackson Laboratory (Bar Harbor, ME, USA). All mice were maintained at the University of Wisconsin-Madison, Department of Biochemistry animal facility under specific pathogen-free conditions and exposed to 12-h light–dark cycles. The mice were housed in plastic cages lined with cornhusk shavings and consumed distilled water ad libitum. All experimental protocols were approved by the UW Research Animal Resources Center Committee Review Board and conform to national guidelines for animal usage in research.
Mice in the 1,25(OH)2D3 study were fed a purified diet containing 0·47% calcium, as described previously [28]. The diets were solidified with molten agar (USB Corporation, Cleveland, OH, USA) and supplemented with fat-soluble vitamins A (as beta-carotene), E, K and 175 IU vitamin D3/mouse/week in vegetable oil.
Female Ins2-/- NOD littermates were placed alternately into one of two treatment groups initiated at the time of weaning: (i) vehicle or (ii) 2AMD. At the indicated times, mice were taken randomly from each group and euthanized, the pancreas removed and prepared for IHC analysis.
Genotyping
Pups were weaned at 21 days and genotyped for the preproinsulin gene Ins2. Ins2-/- NOD mice were identified using polymerase chain reaction (PCR) amplification with insulin and insulin–knock-out gene-specific primers recommended by The Jackson Laboratory. The same forward primer, 5′-GGC AGA GAG GAG GTG CTT TG-3′, complements a DNA sequence common to wild-type, heterozygote and knock-out mice. The reverse primer sequence 5′-AGA AAA CCA GGG TAG TTA GC-3′ was used to identify the wild-type Ins2 gene, and the reverse primer sequence 5′-ATT GAC CGT AAT GGG ATA GG-3′ was used to identify the deleted Ins2 gene. Wild-type mice produced > 400 base pairs (bp) PCR products, and Ins2-/- NOD mice produced 380 bp PCR products. When litters contained two or more Ins2-/- NOD females, those littermates were placed randomly into either the vehicle group or the 2AMD treatment group.
Administration of 2AMD
Mice were treated with either 600 pg of 2AMD/mouse/day or with vehicle. 2AMD was administered by addition of the analogue in the vehicle to LabDiet 5K52 (PMI Nutrition, Brentwood, MS, USA). In order to deliver the designated dose of 2AMD, a stock solution of the analogue was dissolved in ethyl alcohol (EtOH), vortexed for 3 min, and the analogue concentration was determined by spectrophotometry. Based on predetermined diet consumption, diet was prepared to provide 600/pg of 2AMD/day. The diet was solidified with agarose, as described previously [29]. Controls were fed diet prepared as described above but the vehicle contained no 2AMD. Mice in each group were fed either 2AMD diet or vehicle diet from 3 weeks of age until the completion of the study.
Serum calcium analysis
Blood was collected from the orbital sinus 3 weeks after weaning and every 3 weeks thereafter. Blood samples were spun at 2938 g for 15 min, followed by a second and third spin at 16 883 g, each for 2 min. Serum calcium levels were determined by an automated analysis system (ABX Pentra 400; HORIBA ABX, Irvine, CA, USA).
Diabetes monitoring and plasma glucose analysis
Mice were screened weekly for glucosuria using reagent strips (Diastix; Bayer Corporation, Elkhart, IN, USA). Mice that tested positive for glucosuria on 2 consecutive days were fasted for 4 h and blood was taken from the orbital sinus in heparinized micro-haematocrit capillary tubes (Fisher Scientific, Pittsburgh, PA, USA). Blood was centrifuged immediately at 800 g for 5 min and plasma was collected. Glucose was measured by an enzymatic–colorimetric assay (Glucose Liquicolor; Stanbio Laboratory, Boerne, TX, USA). Animals with fasting glucose levels greater than 300 mg/dl plasma were diagnosed as diabetic. Diabetic animals were euthanized immediately following diagnosis.
Intraperitoneal glucose tolerance testing
Mice were fasted for 16 h and then injected intraperitoneally (i.p.) with 2 g glucose/kg body weight. Blood samples were collected from the orbital sinus immediately before glucose administration and at 30, 60, 90 and 120 min. The samples were analysed immediately in duplicate by a glucometer (OneTouch UltraMini; LifeScan, Milpitas, CA, USA) and the values averaged.
Islet histology
Littermates were selected for pancreatectomy at 5–16 weeks of age. They were euthanized with CO2 and 10 ml saline was forced by syringe via a left ventricular puncture to reduce blood cells in the pancreas. The pancreata were removed and immersed in 4% paraformaldehyde for 1 h and kept in 30% sucrose overnight. Tissue was embedded in Neg-50 (Richard-Allan Scientific, Kalamazoo, MI, USA), stored at −80°C and cut into 7-µ sections and mounted onto slides. The slides were removed from −80°C storage and washed with 1% Tween20 and phosphate-buffered saline (PBS). A Pap pen was used to create a hydrophobic ring around each section and the section was treated with 10% donkey serum (Jackson ImmunoResearch, West Grove, PA, USA) in PBS for 30 min. Each section was washed with 1 ml 0·1% Tween20 in PBS. The excess liquid was removed and guinea pig anti-insulin, mouse anti-glucagon and goat anti-somatostatin were added concurrently in PBS and incubated at 4°C overnight. The following day, the slides were washed with 0·1% Tween20 in PBS. Excess solution was removed and donkey anti-guinea pig conjugated to Cy3, donkey anti-mouse conjugated to fluorescein isothiocyanate (FITC) and donkey anti-goat conjugated to Alexafluor 488 were combined in PBS, added to the sections and incubated at 25°C for 30 min in the dark. Samples were then washed with a 0·1% Tween20 PBS for 20 min. The wash was removed and then air-dried in the dark. Vectashield mounting medium with 4,6-diamidino-2-phenylindole (DAPI) (Vector Laboratories, Burlingame, CA, USA) was added to each section and covered with a glass coverslip. Clear nail polish was used to seal the edges of the coverslip to the slide.
To stain the sections for T cells, the procedures above were followed but the 10% donkey serum was replaced with 2% goat serum (Jackson ImmunoResearch) in PBS for 30 min and rat anti-CD8 in PBS was added and incubated at 37°C for 1·5 h. The sections were washed with 0·1% Tween20 and Alexa 568 goat anti-rat secondary was added to PBS. The sections were incubated at 25°C for 30 min in the dark. Sections were washed with 0·1% Tween20 in PBS for 20 min followed by 10% rat serum in PBS for 30 min. They were washed with 1 ml of 1% Tween20 in PBS and incubated overnight with conjugated Alexa 488 rat anti-CD4 mixed in PBS.
The following day, sections were washed with 0·1% Tween20 in PBS for 20 min and PBS-buffered guinea pig anti-insulin was added and incubated at 37°C for 1·5 h and washed with 0·1% Tween20 in PBS again. Coumarin 350 goat anti-guinea pig in PBS was then added and incubated for 30 min at 25°C. Vectashield mounting medium was added as described above.
Results
2AMD inhibits development of T1D in Ins2−/− NOD mice
We first conducted a pilot study in which female Ins2-/- NOD mice were provided a daily dose of 50 ng of 1,25(OH)2D3 or vehicle. This oral dose of 1,25(OH)2D3 was sufficient to reduce incidence from 100% in control animals (n = 20) to 45% in the treated group (n = 20) at 18 weeks (not shown). However, the animals treated with 1,25(OH)2D3 developed marked hypercalcaemia (serum calcium = 12·8 mg% (± 0·5) compared to 9·8 mg% (± 0·4) in controls).
A potent analogue showing selectivity [27] was tested with the hope that an effective dose might be less calcaemic. We found that 300 pg/day of 2AMD was ineffective, while 600 pg/day of 2AMD inhibited T1D development significantly (Fig. 2a). Diabetes first appeared in the vehicle-treated mice at 6 weeks, whereas diabetes did not appear in the 2AMD-treated mice until 13 weeks. In the vehicle group, 100% of the mice were diabetic by 21 weeks, while only 37·5% of the 2AMD group developed T1D at termination of our study after 25 weeks.
Fig. 2.
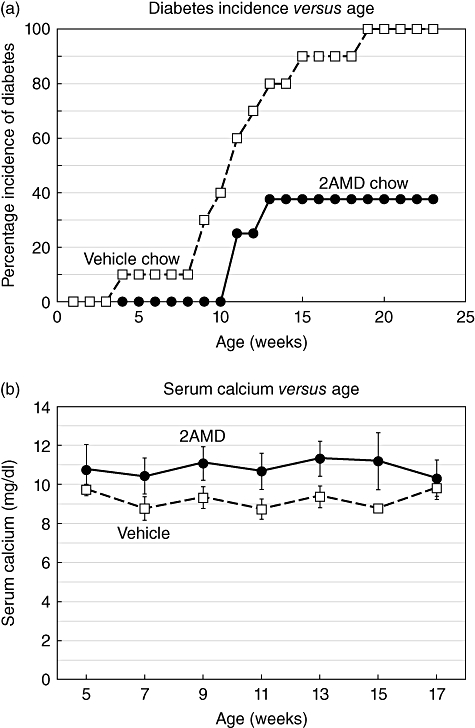
(a) The incidence of type 1 diabetes (T1D) as a function of time in mice treated with vehicle (control) or 600 ng 2α-methyl-19-nor-(20S)-1α,25-dihydroxyvitamin D3 (2AMD)/kg/day. (b) Serum calcium levels of the vehicle and 2AMD-treated mice as a function of time. Bars are the standard error of the mean of average values.
Mice treated with 600 pg/day of 2AMD averaged serum calcium of 10·7 ± 0·4 compared to 9·2 ± 0·4 mg/dl in control mice (Fig. 2b). No adverse effects of 2AMD were observed as revealed by weight gain, body weight and food consumption (Fig. 3).
Fig. 3.
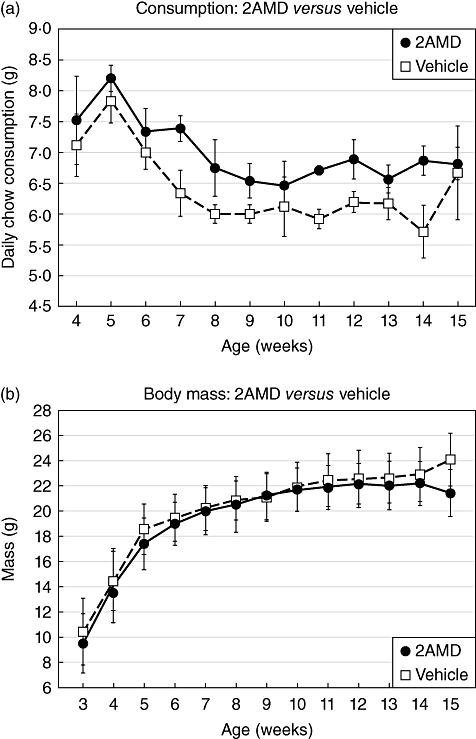
(a) Food consumption and (b) body weights of the insulin 2 (Ins2)-/- mice provided vehicle or 2α-methyl-19-nor-(20S)-1α,25-dihydroxyvitamin D3 (2AMD) from 3 to 15 weeks of age.
2AMD preserved beta-islet cell function
The diagnosis of diabetes was based on positive urine glucose levels and confirmed by fasting blood glucose levels > 300 mg/dl as described in Methods. For monitoring early stages of beta cell dysfunction prior to development of glucosuria, we conducted intraperitoneal glucose tolerance testing (IPGTT) weekly from 7–12 weeks. The results showed that prior to 8 weeks, the IPGTT curves of both control and 2AMD mice were similar. However, by 8 weeks (Fig. 4a), response to the glucose challenge was notably different between control- and 2AMD-treated mice. Glucose levels in control mice rose from normal to increased levels at 30, 60 and 90 min relative to the 2AMD mice and failed to return to normal at 120 min. By 10 weeks, control mice reached much higher hyperglycaemic levels and again failed to return to normal (Fig. 4b). In contrast, normal glucose tolerance curves (Fig. 4a–c) were seen with 2AMD-treated mice. Interestingly, control animals, having abnormal IPGTT curves (Fig. 4a,b,d), were not considered diabetic based on urinary glucose and fasting plasma glucose levels.
Fig. 4.
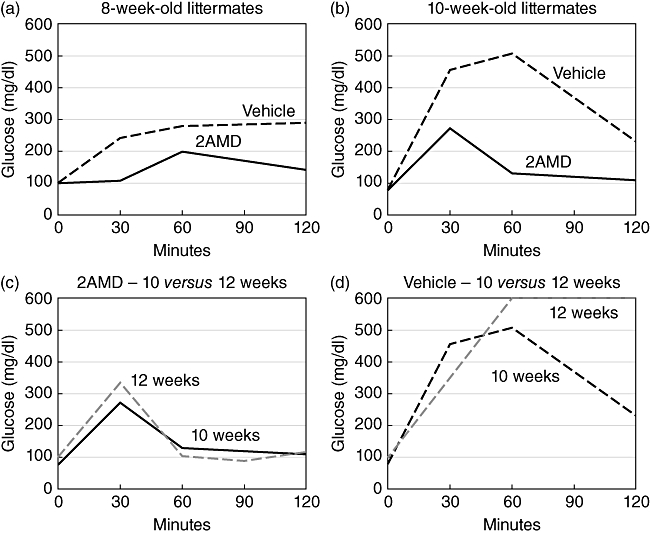
Tolerance to intraperitoneally (i.p.) administered glucose was carried out in vehicle-treated and 2α-methyl-19-nor-(20S)-1α,25-dihydroxyvitamin D3 (2AMD)-treated mice. Serum glucose as a function of time after a 2 g i.p. dose of glucose is plotted for (a) 8-week old; and (b) 10-week old mice. (c) A plot of serum glucose versus time that compares 2AMD-treated mice at 10 and 12 weeks of age in response to the 2 g/kg body weight of glucose. (d) The response of vehicle-treated (control) mice at 10 and 12 weels to the 2 g of i.p. glucose.
2AMD prevented destruction of islets
Immunohistochemical staining of insulin, glucagon and somatostatin as well as DAPI was used to follow the progression of islet cell destruction.
Images of representative islets at specified time-points are shown in Fig. 5. At 5 and 7 weeks of age, islets from both control and treated groups had normal islet structure. However, DAPI staining at 5 weeks revealed an early presence of peri-islet cellular infiltration in control mice, which was not present in the treated animals (Fig. 5a,b). By 7 weeks, control mice had more extensive peri-islet cellular infiltration (Fig. 5c), while treated animals showed minimal peri-islet infiltration (Fig. 5d). Between 7 and 9 weeks, there was noticeable increase in nuclear density surrounding the islets in both control- and 2AMD-treated groups. By 9 weeks, extensive beta cell destruction and insulitis had occurred in control mice with a resultant centralization of glucagon and somatostatin cells (Fig. 5e). In comparison, treatment with 2AMD suppressed beta cell destruction and preserved islets (Fig. 5f).
Fig. 5.
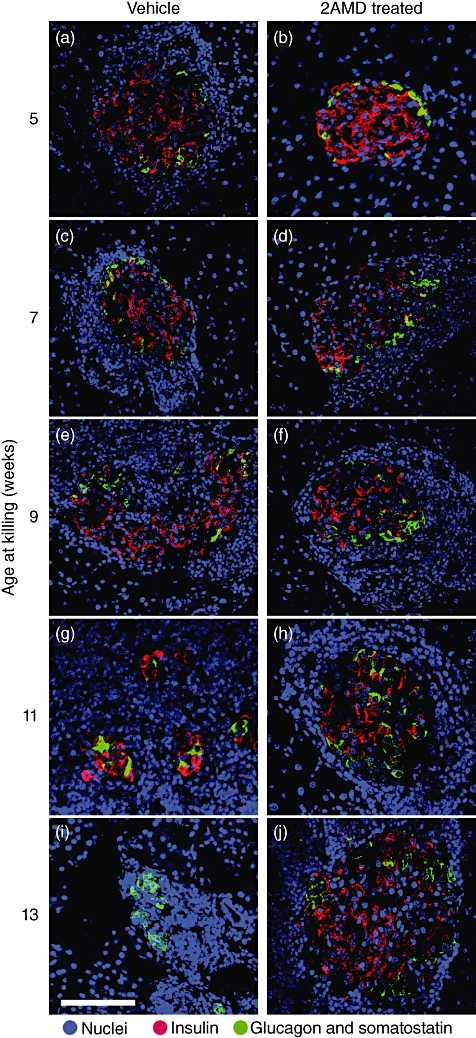
Triple-labelling immunohistochemistry of pancreatic islets at selected stages in the development of type 1 diabetes (T1D). Panels are representative triple-labelled immunohistochemical photomicrographs of pancreatic islets in control and 2α-methyl-19-nor-(20S)-1α,25-dihydroxyvitamin D3 (2AMD)-treated insulin 2 (Ins2)-/- non-obese diabetic (NOD) mice from 5 to 13 weeks of age. 4,6-diamidino-2-phenylindole (DAPI) stains are blue, while red shows insulin plus glucagon and green represents somatostatin.
At 11–13 weeks of age, islets in both control and 2AMD groups continued to show increasing peri-islet cellular infiltration (Fig. 5g–j). Cellular infiltration and invasion in the control group was associated with progressive destruction of insulin-producing cells (Fig. 5g), resulting in almost complete destruction by 13 weeks (Fig. 5i). At this time-point, islets in the control group contained virtually no beta cells and a strong centralization of the glucagon- and somatostatin-staining cells. In marked contrast, the structure of the islets from the 2AMD-treated mice was preserved (Fig. 5b,d,f,h,j).
2AMD significantly impedes intra-islet T cell invasion
In vehicle-treated mice, a progressive infiltration of peri-islet cells and destruction of the beta islet cells occurred. Although peri-islet infiltration also occurred in 2AMD-treated mice, intra-islet invasion was clearly impeded and islet cell destruction was prevented. In order to characterize peri- and intra-islet DAPI-stained cells, triple staining was used to identify insulin-producing cells (blue), cytotoxic CD8 lymphocytes (red) and CD4 T cells (green).
At week 5, Ins2-/- NOD mice had completed 2 weeks of either vehicle or 2AMD. A majority of the beta islet cells from vehicle mice was surrounded by dense infiltration of both CD4 and CD8 T cells (Fig. 6a). In contrast, most islets from 2AMD-treated mice lacked T cells (Fig. 6b).
Fig. 6.
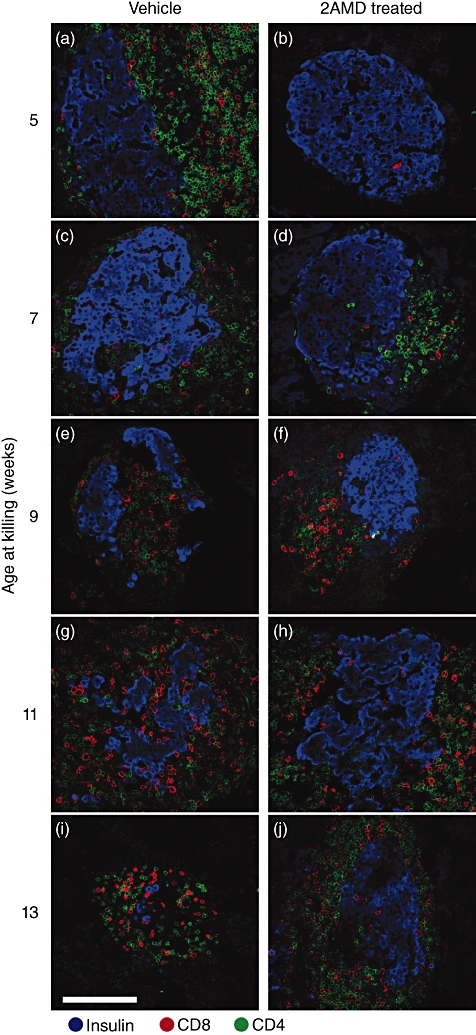
Immunohistochemical staining of insulin producing beta cells (blue), CD4 (green) and CD8 (red) T cells in control (left panel) and 2α-methyl-19-nor-(20S)-1α,25-dihydroxyvitamin D3 (2AMD)-treated (right panel) mice as function of age in insulin 2 (Ins2)-/- mice.
At week 7, islets in the vehicle group were surrounded by both CD4 and CD8 T cells (Fig. 6c), while in the 2AMD-treated animals (Fig. 6d), few peri-islet cells were found. However, an infiltration of the beta islet cells by a small number of CD8 T cells was found in both groups (Fig. 6c,d).
At 9 weeks, a dense infiltration by CD8 and CD4 cells in the periphery of the islet cells was found in the vehicle-treated mice with intra-islet invasion and destruction of the islet structure (Fig. 6e). Islet structure remained intact in the 2AMD-treated animals despite peri-islet infiltration by CD4 and CD8 T cells (Fig. 6f).
By 11 weeks, a dense population of CD4 and CD8 T cells and marked disruption of the islet structure occurred in the controls (Fig. 6g). Although CD4 and CD8 T cells surrounded beta islets in the 2AMD group, islet structure was unchanged (Fig. 6h).
By week 13, the majority of beta cells and islet structure were destroyed in the control mice (Fig. 6i). Although a progressive peri-islet infiltration was noted in the 2AMD mice, normal beta islet cell structure remained intact (Fig. 6j).
The mean insulitis scores ± standard error of the mean (%) at designated weeks of age are demonstrated for vehicle and control in Fig. 7. Islets from three to five mice were scored for absence of insulitis (0), peri-insulitis (2), weak insulitis (2) and heavy insulitis/scar tissue (3). 2AMD-treated mice had significantly lower mean insulitis scores compared with control mice. Furthermore, 2AMD-treated mice had a statistically significant increase in the number of islets without infiltration.
Fig. 7.
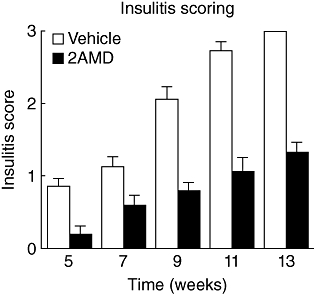
Insulitis scores of vehicle and 2α-methyl-19-nor-(20S)-1α,25-dihydroxyvitamin D3 (2AMD)-treated mice at select stages of development. Islets were given a score of 0 to 3 depending on the degree of lymphocytic infiltration as determined from triple immunohistochemical staining of insulin-producing beta cells, plus CD4 and CD8 T cells (0 = no insulitis; 1 = periinsulitis; 2 = weak insulitis; 3 = heavy insulitis/islet scar).
Discussion
We used the Ins2-/- NOD mouse to study the development of T1D and the protective action of a selective vitamin D analogue, 2AMD. In vehicle-treated animals, beta cells were initially engulfed by surrounding lymphocytes and were gradually destroyed. Treatment with 2AMD suppressed development of T1D, preserved islet cell structure, impeded intra-islet invasion by CD4 and CD8 T cells and had marked protective effect on beta cell survival and function.
Select characteristics of the Ins2-/- NOD model provide advantages over NOD mice for examining T1D pathogenesis. One important difference between the two models is the marked synchrony and brevity with which Ins2-/- NOD mice develop T1D. Disease onset in this strain is restricted to a 10-week period, in contrast to a sporadic occurrence in NOD mice beginning at an early age of 10 weeks to as late as 40 weeks. In addition, the rapidity of disease development in Ins2-/- NOD mice significantly reduces the required experimental time for studying T1D pathogenesis and the search for therapeutic intervention.
Our results show that the Ins2-/- NOD mouse model provides a rapid and effective platform for discerning structural alterations in beta-islets and T cell pathology during diabetic development. Furthermore, a selective 1,25(OH)2D3 analogue, 2AMD, dramatically slows the development of T1D, as revealed by normal glucose tolerance tests and beta islet cell structure. Treatment with 2AMD was associated with a small elevation in serum calcium that remained in the normal range. The fact that 2AMD is more protective of the islet cells than 1,25(OH)2D3 treatment, while having a smaller effect on serum calcium, argues against the idea that the small rise in serum calcium mediates the protective action of 2AMD. If a small change in serum calcium observed here can be tolerated or prevented by limiting calcium intake or inhibiting bone resorption, then 2AMD or its relative, 2MD (2-methylene-19-nor-(20S)-1α,25-dihydroxyvitamin D3), may be useful in the prevention or suppression of T1D in genetically predisposed patients.
Acknowledgments
We thank Yongji Wang, Bryan Becklund, James Kim, Juli Hansen and Wendy Hellwig for technical assistance, Lori Plum for experimental discussions and Pat Mings for helping with manuscript preparation. We thank Laura Vanderploeg for assistance with image preparations. This work was supported by a fund from the Wisconsin Alumni Research Foundation.
Disclosure
The authors declare no conflict of interest.
References
- 1.Pearl-Yafe M, Kaminitz A, Yolcu ES, Yaniv I, Stein J, Askenasy N. Pancreatic islets under attack: cellular and molecular effectors. Curr Pharm Des. 2007;13:749–60. doi: 10.2174/138161207780249155. [DOI] [PubMed] [Google Scholar]
- 2.McDevitt HO, Unanue ER. Autoimmune diabetes mellitus – much progress, but many challenges. Adv Immunol. 2008;100:1–12. doi: 10.1016/S0065-2776(08)00801-8. [DOI] [PubMed] [Google Scholar]
- 3.Azam A, Eisenbarth GS. Immunopathogenesis and immunotherapeutic approaches to type 1A diabetes. Exp Opin Biol Ther. 2004;4:1569–75. doi: 10.1517/14712598.4.10.1569. [DOI] [PubMed] [Google Scholar]
- 4.Babaya N, Nakayama M, Eisenbarth GS. The stages of type 1A diabetes. Ann NY Acad Sci. 2005;1051:194–204. doi: 10.1196/annals.1361.061. [DOI] [PubMed] [Google Scholar]
- 5.Eisenbarth GS, Jeffrey J. The natural history of type 1A diabetes. Arq Bras Endocrinol Metabol. 2008;52:146–55. doi: 10.1590/s0004-27302008000200002. [DOI] [PubMed] [Google Scholar]
- 6.Tsai EB, Sherry NA, Palmer JP, Herold KC, Grp D-S. The rise and fall of insulin secretion in type 1 diabetes mellitus. Diabetologia. 2006;49:261–70. doi: 10.1007/s00125-005-0100-8. [DOI] [PubMed] [Google Scholar]
- 7.Babaya N, Nakayama M, Eisenbarth GS. The stages of type 1A diabetes. Ann NY Acad Sci. 2005;1051:194–204. doi: 10.1196/annals.1361.061. [DOI] [PubMed] [Google Scholar]
- 8.Liu E, Eisenbarth GS. Type 1A diabetes mellitus-associated autoimmunity. Endocrinol Metab Clin North Am. 2002;31:391–410. doi: 10.1016/s0889-8529(01)00017-2. vii–viii. [DOI] [PubMed] [Google Scholar]
- 9.Gianani R, Eisenbarth GS. The stages of type 1A diabetes: 2005. Immunol Rev. 2005;204:232–49. doi: 10.1111/j.0105-2896.2005.00248.x. [DOI] [PubMed] [Google Scholar]
- 10.Atkinson MA, Eisenbarth GS. Type 1 diabetes: new perspectives on disease pathogenesis and treatment. Lancet. 2001;358:221–9. doi: 10.1016/S0140-6736(01)05415-0. [DOI] [PubMed] [Google Scholar]
- 11.Atkinson MA, Leiter EH. The NOD mouse model of type 1 diabetes: as good as it gets? Nat Med. 1999;5:601–4. doi: 10.1038/9442. [DOI] [PubMed] [Google Scholar]
- 12.Anderson MS, Bluestone JA. The NOD mouse: a model of immune dysregulation. Annu Rev Immunol. 2005;23:447–85. doi: 10.1146/annurev.immunol.23.021704.115643. [DOI] [PubMed] [Google Scholar]
- 13.Aoki CA, Borchers AT, Ridgway WM, Keen CL, Ansari AA, Gershwin ME. NOD mice and autoimmunity. Autoimmun Rev. 2005;4:373–9. doi: 10.1016/j.autrev.2005.02.002. [DOI] [PubMed] [Google Scholar]
- 14.Leiter EH. Nonobese diabetic mice and the genetics of diabetes susceptibility. Curr Diab Rep. 2005;5:141–8. doi: 10.1007/s11892-005-0042-z. [DOI] [PubMed] [Google Scholar]
- 15.Yang Y, Santamaria P. Lessons on autoimmune diabetes from animal models. Clin Sci (Lond) 2006;110:627–39. doi: 10.1042/CS20050330. [DOI] [PubMed] [Google Scholar]
- 16.Giarratana N, Penna G, Adorini L. Animal models of spontaneous autoimmune disease: type 1 diabetes in the nonobese diabetic mouse. Methods Mol Biol. 2007;380:285–311. doi: 10.1007/978-1-59745-395-0_17. [DOI] [PubMed] [Google Scholar]
- 17.Wicker LS, Clark J, Fraser HI, et al. Type 1 diabetes genes and pathways shared by humans and NOD mice. J Autoimmun. 2005;25:29–33. doi: 10.1016/j.jaut.2005.09.009. [DOI] [PubMed] [Google Scholar]
- 18.von Herrath M, Chan A. How can we improve the translational landscape for a faster cure of type 1 diabetes? J Clin Invest. 2009;119:1061–5. doi: 10.1172/JCI37593. [DOI] [PMC free article] [PubMed] [Google Scholar]
- 19.von Herrath M, Nepom GT. Animal models of human type 1 diabetes. Nat Immunol. 2009;10:129–32. doi: 10.1038/ni0209-129. [DOI] [PubMed] [Google Scholar]
- 20.Dubois-Lafforgue D, Mogenet L, Thebault K, Jami J, Krief P, Boitard C. Proinsulin 2 knockout NOD mice – a model for genetic variation of insulin gene expression in type 1 diabetes. Diabetes. 2002;51:S489–S493. doi: 10.2337/diabetes.51.2007.s489. [DOI] [PubMed] [Google Scholar]
- 21.Heath VL, Moore NC, Parnell SM, Mason DW. Intrathymic expression of genes involved in organ specific autoimmune disease. J Autoimmun. 1998;11:309–18. doi: 10.1006/jaut.1998.0210. [DOI] [PubMed] [Google Scholar]
- 22.Pleau JM, Esling A, Geutkens S, Dardenne M, Homo-Delarche F. Pancreatic hormone and glutamic acid decarboxylase expression in the mouse thymus: a real-time PCR study. Biochem Biophys Res Commun. 2001;283:843–8. doi: 10.1006/bbrc.2001.4884. [DOI] [PubMed] [Google Scholar]
- 23.Chentoufi AA, Polychronakos C. Insulin expression levels in the thymus modulate insulin-specific autoreactive T-cell tolerance: the mechanism by which the IDDM2 locus may predispose to diabetes. Diabetes. 2002;51:1383–90. doi: 10.2337/diabetes.51.5.1383. [DOI] [PubMed] [Google Scholar]
- 24.Pugliese A, Zeller M, Fernandez A, Jr, et al. The insulin gene is transcribed in the human thymus and transcription levels correlated with allelic variation at the INS VNTR-IDDM2 susceptibility locus for type 1 diabetes. Nat Genet. 1997;15:293–7. doi: 10.1038/ng0397-293. [DOI] [PubMed] [Google Scholar]
- 25.Vafiadis P, Bennett ST, Todd JA, et al. Insulin expression in human thymus is modulated by INS VNTR alleles at the IDDM2 locus. Nat Genet. 1997;15:289–92. doi: 10.1038/ng0397-289. [DOI] [PubMed] [Google Scholar]
- 26.Thebault-Baumont K, Dubois-Laforgue D, Krief P, et al. Acceleration of type 1 diabetes mellitus in proinsulin 2-deficient NOD mice. J Clin Invest. 2003;111:851–7. doi: 10.1172/JCI16584. [DOI] [PMC free article] [PubMed] [Google Scholar]
- 27.Sicinski RR, Prahl JM, Smith CM, DeLuca HF. New 1α,25-dihydroxy-19-norvitamin D3 compounds of high biological activity: synthesis and biological evaluation of 2-hydroxymethyl, 2-methyl, and 2-methylene analogues. J Med Chem. 1998;41:4662–74. doi: 10.1021/jm9802618. [DOI] [PubMed] [Google Scholar]
- 28.Suda T, DeLuca HF, Tanaka Y. Biological activity of 25-hydroxyergocalciferol in rats. J Nutr. 1970;100:1049–52. doi: 10.1093/jn/100.9.1049. [DOI] [PubMed] [Google Scholar]
- 29.Smith SM, Levy NS, Hayes CE. Impaired immunity in vitamin D-deficient mice. J Nutr. 1987;117:857–65. doi: 10.1093/jn/117.5.857. [DOI] [PubMed] [Google Scholar]