Abstract
Mitochondria are highly dynamic organelles that play multiple roles in cells. How mitochondria cooperatively modulate embryonic stem (ES) cell function during development is not fully understood. Global disruption of Ptpmt1, a mitochondrial Pten-like phosphatidylinositol phosphate (PIP) phosphatase, resulted in developmental arrest and postimplantation lethality. Ptpmt1−/− blastocysts failed to outgrow, and inner-cell-mass cells failed to thrive. Depletion of Ptpmt1 in conditional knockout ES cells decreased proliferation without affecting energy homeostasis or cell survival. Differentiation of Ptpmt1-depleted ES cells was essentially blocked. This was accompanied by upregulation of cyclin-dependent kinase inhibitors and a significant cell cycle delay. Reintroduction of wild-type but not of catalytically deficient Ptpmt1 C132S or truncated Ptpmt1 lacking the mitochondrial localization signal restored the differentiation capabilities of Ptpmt1 knockout ES cells. Intriguingly, Ptpmt1 is specifically important for stem cells, as ablation of Ptpmt1 in differentiated embryonic fibroblasts did not disturb cellular function. Further analyses demonstrated that oxygen consumption of Ptpmt1-depleted cells was decreased, while glycolysis was concomitantly enhanced. In addition, mitochondrial fusion/dynamics were compromised in Ptpmt1 knockout cells due to accumulation of PIPs. These studies, while establishing a crucial role for Ptpmt1 phosphatase in embryogenesis, reveal a mitochondrial metabolic stress-activated checkpoint in the control of ES cell differentiation.
INTRODUCTION
Mitochondria are involved in a number of cellular processes and are essential for both life and death. As the site of oxidative phosphorylation, these double-membrane organelles provide a highly efficient route for eukaryotic cells to generate ATP from energy-rich molecules. During the mitochondrial energy production process, reactive oxygen species (ROS), such as superoxide (O2−) and hydrogen peroxide (H2O2), are produced as by-products. In fact, mitochondria are the primary source of a majority of cellular ROS (2). Mitochondria also participate in intermediary metabolism. Under normal oxygen tensions, cells catabolize glucose to pyruvate. Pyruvate is then imported into the mitochondria for further catabolism through the Krebs cycle, which transfers electrons to the respiratory chain for ATP synthesis. In low oxygen tension, or hypoxic conditions in which there is a paucity of oxygen as an electron acceptor, cells are surmised to undergo anaerobic glycolysis as a default mode. Pyruvate is then used for low-efficiency energy production in the cytosol by glycolysis. In addition to metabolism and energy production, mitochondria play important roles in the regulation of apoptosis and intracellular Ca2+ homeostasis. Dysfunction in mitochondria results in severe cellular consequences and is linked to a wide range of human diseases (2, 36, 43).
The role of mitochondrial activities in early embryonic development and embryonic stem (ES) cell function is not well defined (20, 42). The environment of the uterus before placentation is anaerobic (11). To produce ATP in this environment, early embryonic cells, such as ES cells, rely heavily on glycolysis for ATP production (4) and, thus, do not require a large number of mitochondria. ES cells only have a few mitochondria with poorly developed cristae (21). Effective control of mitochondrial mass and function is critical for the prevention of damage by oxidative stress (ROS) in ES cells. However, when these cells are allowed to differentiate, the resulting cells show numerous large mitochondria with distinct cristae. Thus, mitochondria must undergo robust replication/biogenesis during this short period of time. Earlier studies have shown that the mitochondrial genome undergoes significant replication during implantation of blastocysts (41), and once gastrulation occurs, cells replicate their mitochondrial DNA (mtDNA) to match the energy demand of differentiating cells (39). It has also been demonstrated that mitochondrial metabolic rates correlate inversely with the differentiation capacity of ES cells (37). However, exactly how mitochondria coordinate stem cell behavior during embryogenesis is still not well understood.
Mitochondria are highly dynamic organelles that undergo continuous fusion and fission. These mitochondrial processes play important roles in mitochondrial biogenesis/replication. The balance of fusion and fission also controls mitochondrial morphology and distribution. In addition, emerging evidence suggests that coordinated dynamics are vital for mitochondrial metabolism, energy production, ROS production, calcium signaling, and apoptosis (5, 29, 40). Unbalanced fusion or fission leads to impairment of mitochondrial dynamics, which is being increasingly implicated in human diseases, such as neurodegeneration and muscle atrophy (6, 7). However, the detailed mechanisms by which these important mitochondrial processes are regulated are poorly defined. Mitochondrial fusion and fission involve membrane trafficking (1, 5, 17); thus, mitochondrial membrane constituents may play an important role in this context. Phosphatidylinositol phosphates (PIPs) are a class of membrane phospholipids that bind to a distinctive set of effector proteins and thereby regulate a characteristic suite of cellular processes, including membrane trafficking, ion channel and transporter functions, and cell division (3, 12, 15). Specific PIPs are enriched on specific organelles and the plasma membrane. The potent signaling properties of PIPs depend on their localization and abundance, which are determined by the collective actions of PIP kinases, PIP phosphatases, and phospholipases. Recent studies suggest that phospholipids, including phosphatidylinositol 4,5-bisphosphate [PI(4,5)P2], play an important role in mitochondrial membrane processes (16, 30). However, the role of other PIPs and their signaling mechanisms in mitochondria remain largely undefined.
Ptpmt1, a newly identified Pten-like PIP phosphatase encoded by nuclear DNA, is exclusively localized to the inner membrane of mitochondria via N-terminal amino acids 1 to 37 (31, 32). The role of Ptpmt1 in physiology and disease is completely unclear. In an effort to understand the physiological function of Ptpmt1 and Ptpmt1-mediated signaling, we created both Ptpmt1 null and conditional (floxed) alleles by gene targeting and generated Ptpmt1-deficient animal and cell models. By analyzing these mice and cells, we have found that Ptpmt1 plays a critical role in early embryogenesis and that depletion of Ptpmt1 impairs ES cell maintenance and differentiation. The results of this study additionally suggest a stem cell-specific mitochondrial stress-triggered cell cycle checkpoint.
MATERIALS AND METHODS
Generation of Ptpmt1 knockout mice.
The targeting vector was constructed using the “recombineering” technique (19). An EcoRI site was introduced into the front of the neo cassette. The targeting construct was then electroporated into D1 mouse ES cells with a 129S6 × C57BL/6J hybrid background. G418-resistant ES cell clones were isolated and screened by PCR outside the targeting vector and inside the neo cassette. Two ES cell clones containing a correctly targeted Ptpmt1 allele were used to generate chimeric mice. Germ line-transmitted chimeric mice from both ES cell clones were obtained and used to cross C57BL6J mice to produce heterozygous (Ptpmt1+/−) mice. The targeted Ptpmt1 allele in these mice was confirmed by Southern blotting. Ptpmt1+/− mice were backcrossed with C57BL6J mice for 4 generations for experiments. No differences in the two lines of mutant mice derived from two independent ES cell clones were observed. All mice were kept under specific-pathogen-free conditions in the Animal Resources Center at Case Western Reserve University. All animal procedures complied with the NIH Guidelines for the Care and Use of Laboratory Animals and were approved by the Institutional Animal Care and Use Committee.
Derivation of ES cell clones.
Generation of ES cell clones from blastocysts was performed as previously described (9, 22). Briefly, single embryonic day 3.5 (E3.5) blastocysts harvested from the uteri of pregnant Ptpmt1+/− female mice mated with Ptpmt1+/− males were cultured on mitomycin C-treated STO feeder cells in ES medium (Dulbecco's modified Eagle's medium [DMEM] supplemented with glutamine, nonessential amino acids, sodium pyruvate, β-mercaptoethanol, 20% ES-cell-tested fetal bovine serum [FBS], and 1,000 U/ml of leukemia inhibitory factor [LIF]). Three to 4 weeks later, after the ES cells grew to confluence, they were trypsinized. Feeder cells were removed by allowing the harvested mixed cells to adhere to regular tissue culture dishes for 30 min 3 times. Nonadhering ES cells were genotyped and cultured on gelatin-coated dishes without feeder cells thereafter. To generate Ptpmt1 conditional knockout ES cell clones, Ptpmt1flox/+ mice were used to cross estrogen receptor (ER) promoter-driven Cre transgenic (ER-Cre+) mice to generate Ptpmt1flox/+/ER-Cre+ mice. E3.5 blastocysts harvested from the intercrosses of Ptpmt1flox/+/ER-Cre+ and Ptpmt1flox/+ mice were used. Ptpmt1+/+/ER-Cre+ and Ptpmt1flox/flox/ER-Cre+ ES cell clones were identified by PCR genotyping. Ptpmt1+/+/ER-Cre+ and Ptpmt1flox/flox/ER-Cre+ ES cells were treated with 4-hydroxytamoxifen (4-OHT, 1 μM) to induce Cre to delete Ptpmt1 from Ptpmt1flox/flox/ER-Cre+ cells while Ptpmt1 in Ptpmt1+/+/ER-Cre+ cells remained intact.
Immunocytochemistry and TUNEL assay.
Cells were fixed in 4% paraformaldehyde for 15 min, permeabilized with 0.1% Triton X-100 in phosphate-buffered saline (PBS) for 5 min, and then blocked with 1% bovine serum albumin (BSA) in PBS for 1 h. Cells were incubated with primary antibody against Ptpmt1 (Proteintech Group, Inc., Chicago, IL) overnight, washed, and then incubated with fluorescein isothiocyanate (FITC)-conjugated anti-rabbit secondary antibody (Molecular probes, Eugene, OR) for 1 h. The cells were washed and then analyzed with the terminal deoxynucleotidyltransferase-mediated dUTP-biotin nick end labeling (TUNEL) assay using the in situ cell death detection kit, TMR red (TMR, tetramethylrhodamine; Roche, Indianapolis, IN).
Apoptosis and measurement of cellular ROS levels.
Cells were stained with annexin V and 7-amino-actinomycin D (7-AAD). The proportions of early apoptotic (annexin V single positive) and late apoptotic (annexin V–7-AAD double positive) cells were quantified by flow cytometric analysis. To measure cellular ROS levels, cells were loaded with 2′-7′-dichlorofluorescein diacetate (DCF-DA) (5 μM) at 37°C for 15 min. ROS (H2O2) levels were then quantified using flow cytometry.
Oxygen consumption, extracellular flux, and ATP measurement.
Measurement of intact cellular respiration was performed using the Seahorse XF24 analyzer (10, 18, 45). Respiration was measured under basal conditions, in the presence of the mitochondrial inhibitor oligomycin, the mitochondrial uncoupling compound carbonylcyanide-4-trifluorometh-oxyphenylhydrazone (FCCP), and the respiratory chain inhibitor rotenone. Glycolytic activities were measured simultaneously using the same instrument based on the extracellular acidification rates. Total cellular ATP levels were assessed using an ATP bioluminescent somatic cell assay kit (Sigma, St. Louis, MO), following the instructions provided by the manufacturer.
Mitochondrial photobleaching time-lapse confocal microscopic and mitochondrial fusion assays.
Ptpmt1+/+/ER-Cre+ and Ptpmt1flox/flox/ER-Cre+ mouse embryonic fibroblasts (MEFs) were treated with 4-OHT (500 nM) for 48 h and then transfected with Mito-DsRed2 to label mitochondria. Forty-eight hours later, images before and after photobleaching were captured using a Zeiss LSM 510 confocal microscope with a 63× oil immersion objective. Data were normalized to correct for variation in background fluorescence (Fbkgd) and loss of fluorescence during the bleach according to the formula F(t)norm = 100 × [F(t)ROI − Fbkgd](Fi_cell − Fbkgd)/[F(t)cell − Fbkgd](Fi_ROI − Fbkgd), where F(t)ROI is intensity of the region of interest, F(t)cell is total cell intensity at any given time point (t), Fi_ROI is initial intensity of the region of interest, and Fi_cell is initial intensity of the entire cell (13). For the mitochondrial fusion assay, Ptpmt1+/+/ER-Cre+ and Ptpmt1flox/flox/ER-Cre+ ES cells and MEFs were treated with 4-OHT. Each cell line was separately transfected with Mito-DsRed2 and Mito-AcGFP plasmids to label mitochondria in red and green fluorescence, respectively. Cell lines of the same genotype that expressed Mito-DsRed2 or Mito-AcGFP were coplated on coverslips at a 1:1 ratio. Cells were fused for 60 s using polyethylene glycol 1500 (50%). The cells were washed and grown for 7 h in medium containing 30 μg/ml cycloheximide. Images of the cells were captured using a fluorescence microscope.
Laser scanning cytometry.
Laser scanning cytometry was used to quantitatively assess PI(3,5)P2 levels in the mitochondria of Ptpmt1-depleted MEFs as reported previously (24, 28). In brief, 4-OHT-treated primary Ptpmt1+/+/ER-Cre+ and Ptpmt1flox/flox/ER-Cre+ MEFs were transfected with Mito-DsRed2 to label mitochondria and then stained with anti-PI(3,5)P2 antibody. PI(3,5)P2 was visualized using Alexa Fluor 488-labeled anti-mouse secondary antibody. DAPI (4′,6-diamidino-2-phenylindole) was used as a nuclear counterstain to contour and quantify cells. The slides were analyzed using a laser scanning cytometer (iCyte; Compucyte, Cambridge, MA), which allows quantitative fluorescence signal processing of the mitochondria (defined by Mito-DsRed2-labeled areas) in individual cells in a population on a flat surface. Slides were scanned at 40× magnification using an argon laser. Mitochondria were contoured based on Mito-DsRed2 fluorescence. The laser scanning cytometer recorded green fluorescence in the mitochondria and counted total numbers of the Mito-DsRed2-transfected cells analyzed. The mean green fluorescence intensities in the mitochondria of all analyzed cells were calculated to determine PI(3,5)P2 levels.
RESULTS
Targeted disruption of Ptpmt1 in mice results in postimplantation lethality.
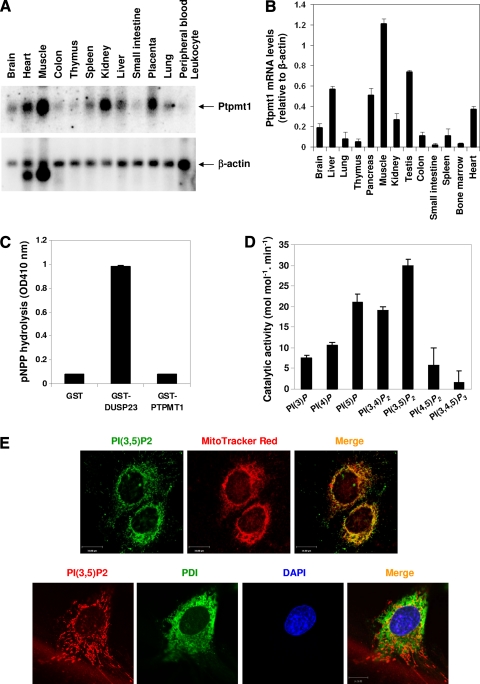
Ptptmt1 is a mitochondrion-based phosphatase (31, 32). Our human RNA Northern blotting (Fig. 1A) and mouse RNA real-time PCR quantification (Fig. 1B) illustrated that Ptpmt1 was relatively broadly expressed, with high levels in skeletal muscle, heart, liver, pancreas, kidney, placenta, testis, and brain. Ptpmt1 does not contain any other recognizable modular domains apart from a putative tyrosine phosphatase domain, with the active site being homologous to the P-loop catalytic domain of Pten phosphatase. Enzymatic activity assays showed that Ptpmt1 had an extremely low activity of hydrolyzing p-nitrophenyl phosphate (pNPP), a widely used nonspecific substrate for tyrosine/dual specificity phosphatases (Fig. 1C). Instead, it effectively dephosphorylated phosphatidylinositol phosphates (PIPs), especially PI(3,5)P2, PI(3,4)P2, and PI(5)P (Fig. 1D). This property is similar to those of Pten (27) and MIP/MTMR14 (38), which also favor PIPs as substrates despite containing tyrosine phosphatase domains. Notably, PI(3,5)P2, the most recently identified phosphatidylinositol bisphosphate (PIP2) isomer (8, 23) and the apparent best PIP substrate for Ptpmt1 (Fig. 1D), is also enriched within the mitochondria, as PI(3,5)P2 detected by anti- PI(3,5)P2 antibody colocalized with MitoTracker Red (a mitochondrion-specific dye) (Fig. 1E, upper panel). This anti-PI(3,5)P2 immunostaining appears to be specific, since the same staining showed that PI(3,5)P2 did not colocalize with protein disulfide isomerase (PDI), a specific marker for the endoplasmic reticulum (Fig. 1E, lower panel), in the same cells (mouse embryonic fibroblasts). As no specific antibodies against other PIPs are available, it remains to be determined whether other PIPs are also localized to the mitochondria.
Fig. 1.
Characterization of Ptpmt1 phosphatase. (A) The human tissue RNA blot (Clontech, Mountain View, CA) was hybridized with [α-32P]dCTP-labeled human Ptpmt1 cDNA probe by following a standard protocol. The blot was stripped and reprobed with the β-actin probe to check RNA loading. (B) Total RNA was extracted from the indicated mouse tissues. Ptpmt1 mRNA levels in these RNA samples were determined by real-time PCR following standard procedures. (C and D) Glutathione S-transferase (GST)–Ptpmt1 fusion protein was carefully purified and tested for its phosphatase activity using pNPP (OD410 nm, optical density at 410 nm) (C) or the indicated PIPs (Echelon Biosciences, Inc., Salt Lake City, UT) (D) as substrates as we previously reported (38). GST-DUSP23 was included as the positive control (C). (E) MEFs were loaded with MitoTracker Red (Molecular Probe, Eugene, OR) and then immunostained with anti-PI(3,5)P2 antibody (Echelon Biosciences Inc., Salt Lake City, UT) (upper panel) or the cells were double immunostained with anti-PI(3,5)P2 and anti-protein disulfide isomerase (PDI; a specific marker for the endoplasmic reticulum) (Stressgen, Ann Arbor, MI) antibodies (lower panel). Images were analyzed with the Zeiss laser scanning microscope LSM510 confocal imaging system. Scale bar = 15 μm.
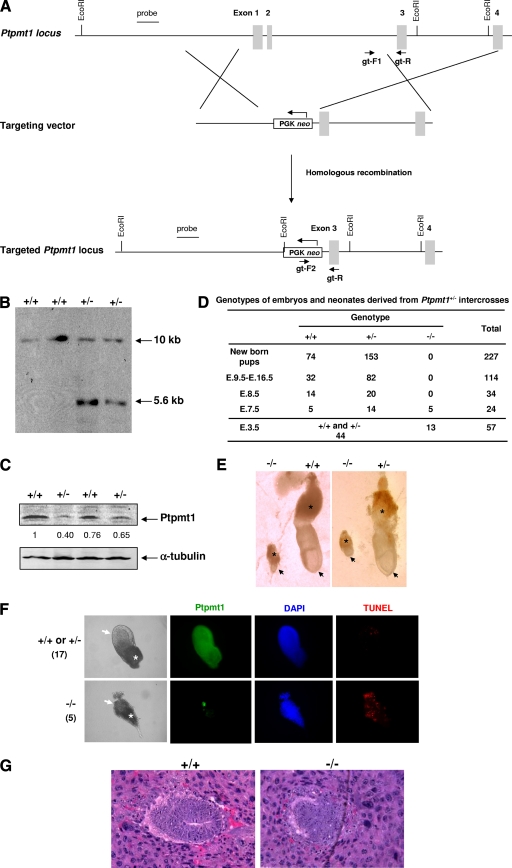
The interesting subcellular localization of Ptpmt1 provides the impetus to further study the unknown biological function of this phosphatase. Accordingly, we generated Ptpmt1 knockout mice through gene targeting (Fig. 2A and B). Exons 1 (containing the start codon) and 2 of the total of 4 exons were replaced by the neo cassette, which completely disrupted the gene function, generating a null allele. As demonstrated in Fig. 2C, the protein levels of Ptpmt1 in heterozygous (Ptpmt1+/−) mutant ES cells were decreased by ∼50%. Ptpmt1+/− mice displayed no overt phenotypes and were healthy and fertile. However, no homozygous (Ptpmt1−/−) mice were identified from the 227 newborn mice produced from the intercrosses of Ptpmt1+/− mice, indicating that Ptpmt1 deficiency resulted in embryonic lethality. Indeed, genotyping of various stages of embryos revealed that Ptpmt1−/− mice died at ∼E7.5 (Fig. 2D). The development of Ptpmt1−/− embryos was severely retarded. Ptpmt1−/− embryos at E7.5 appeared strikingly similar to early-stage blastocysts (Fig. 2E). TUNEL staining of whole-mount embryos showed that apoptotic cells in Ptpmt1−/− embryos and ectoplacental cones were markedly increased (Fig. 2F). Histological analyses of earlier E6.5 embryos demonstrated that wild-type (WT) embryos had developed into early streaks with well-organized germ layers. In contrast, the inner layers of mutant embryos looked disorganized, and extensive occurrence of apoptotic cells was observed (Fig. 2G). Ptpmt1−/− blastocysts at E3.5 were detected at the expected ratio as defined by Mendelian distribution, and they were indistinguishable from WT or Ptpmt1+/− littermates (see below). Thus, Ptpmt1 deficiency causes developmental arrest postimplantation and this defect eventually leads to lethality of the embryos.
Fig. 2.
Global knockout of Ptpmt1 results in postimplantation developmental arrest and lethality in mice. (A) The gene-targeting strategy. Genotyping primers are shown by arrows. Exon 1 containing the start codon ATG to exon 2 was replaced with neo by homologous recombination. The probe used for Southern blotting and two flanking EcoRI sites are also indicated. (B) Genomic DNA extracted from WT and Ptpmt1+/− ES cells was digested with EcoRI and then analyzed by Southern blotting using the probe labeled with digoxigenin-11-dUTP following standard procedures. (C) Cell lysates prepared from WT and Ptpmt1+/− ES cells were examined by Western blotting analyses with Ptpmt1 polyclonal antibody. The membrane was stripped and reprobed with anti-α-tubulin antibody to check protein loading. Relative Ptpmt1 levels were determined by densitometry. (D) Embryos produced from intercrosses of Ptpmt1+/− mice were dissected at various stages and genotyped by PCR or Ptpmt1 immunostaining (E3.5 embryos). Values are numbers of embryos or pups. (E) Embryos produced from the intercrosses of Ptpmt1+/− mice were dissected at E7.5 and photographed. Arrows point to embryos, while stars indicate placental corns. (F) E7.5 embryos produced from intercrosses of Ptpmt1+/− mice were immunostained with anti-Ptpmt1 antibody and analyzed with the TUNEL assay. Arrows point to embryos, while stars indicate placental corns. (G) E6.5 deciduas from timed matings of Ptpmt1+/− mice were dissected in ice-cold PBS, fixed in 10% formalin, dehydrated, paraffin embedded, sectioned, and stained with hematoxylin and eosin.
ICM cells of Ptpmt1−/− blastocysts fail to proliferate, and no Ptpmt1−/− ES cell clones can be established in vitro.
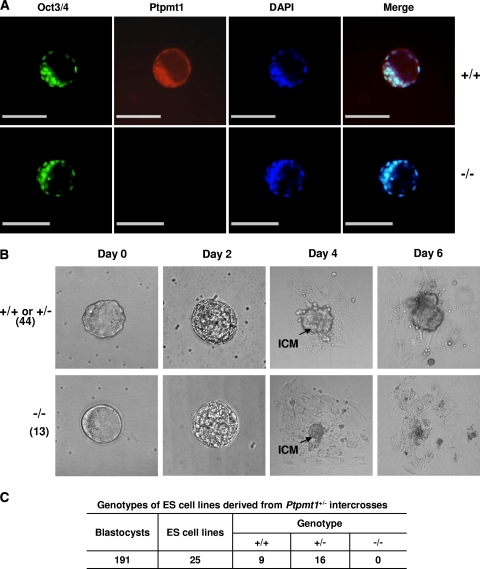
To assay the growth and survival potential of Ptpmt1−/− embryos, E3.5 blastocysts harvested from Ptpmt1+/− intercrosses were first immunostained for ES cells. As illustrated in Fig. 3A, Oct3/4-positive ES cells developed normally in the inner cell mass (ICM) of Ptpmt1−/− embryos. E3.5 blastocysts were then cultured in ES cell medium without leukemia inhibitory factor (LIF, which inhibits ES cell differentiation). No obvious abnormalities were observed in Ptpmt1−/− embryos during the first 1 to 2 days of culture. Similar to WT and Ptpmt1+/− embryos, Ptpmt1−/− blastocysts successfully hatched from zona pellucida and initiated growth (Fig. 3B). The ICM of Ptpmt1−/− embryos was indistinguishable from the counterparts of WT and Ptpmt1+/− embryos during the first 2 days in culture. However, Ptpmt1−/− ICM cells gradually stopped growing and invariably died by day 6 (Fig. 3B). The impaired growth of ICM cells of Ptpmt1−/− blastocysts strongly suggests that Ptpmt1 is indispensable for normal mitotic division in early embryonic development. Consistent with the observations from blastocyst outgrowth assays, we failed to establish Ptpmt1−/− ES cell clones from the blastocysts derived from Ptpmt1+/− matings. We collected 191 embryos in three independent experiments to generate mouse ES cell lines by following the established protocol (9, 22). After 3 to 4 weeks of culture on feeder cells in the presence of LIF, 25 immortal ES cell lines were obtained. They were identified as either WT or Ptpmt1+/− cells; none of them were Ptpmt1−/− (Fig. 3C).
Fig. 3.
Inner cell mass (ICM) of Ptpmt1−/− blastocysts fails to expand, and no Ptpmt1−/− ES cell clones are derived in vitro. (A) E3.5 blastocysts harvested from Ptpmt1+/− intercrosses were immunostained with anti-Oct3/4 and anti-Ptpmt1 antibodies, counterstained with the DNA dye DAPI, and analyzed under a confocal microscope. Scale bar = 100 μm. (B) E3.5 blastocysts harvested from Ptpmt1+/− intercrosses were cultured individually in ES medium without LIF. Each blastocyst was monitored on a daily basis, documented photographically, and subsequently genotyped. (C) A total of 191 E3.5 blastocysts produced from Ptpmt1+/− intercrosses were cultured on mitomycin C-treated STO feeder cells in ES cell medium containing LIF to generate ES cell clones following standard procedures. The 25 established ES cell clones were genotyped by PCR.
Depletion of Ptpmt1 from conditional knockout ES cells decreases proliferation and blocks differentiation.
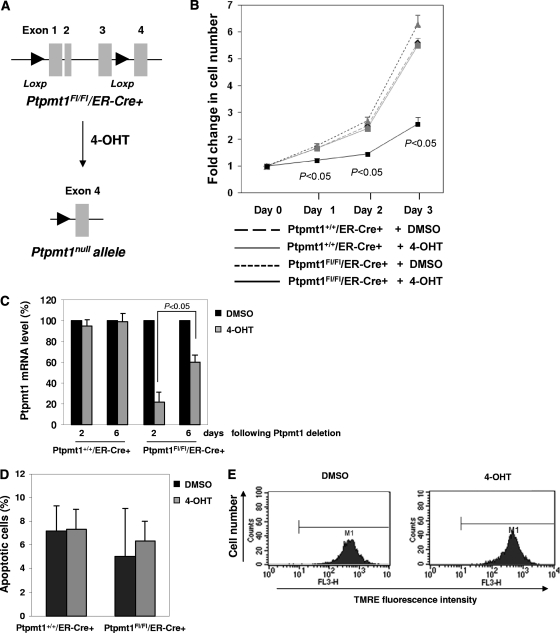
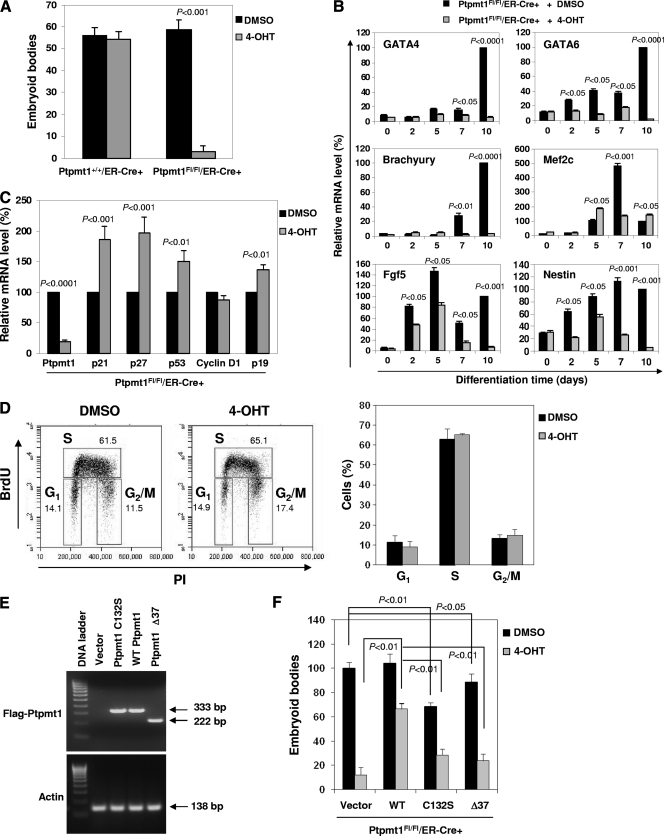
To circumvent the early embryonic lethality of Ptpmt1 global knockout mice and to further explore the physiological function of Ptpmt1, we created Ptpmt1 conditional alleles in mice (unpublished data). Exons 1 to 3 of the total of 4 exons were flanked by two Loxp sites (i.e., floxed). Ptpmt1-floxed heterozygous (Ptpmt1flox/+) mice were used to cross estrogen receptor (ER) promoter-driven Cre transgenic (ER-Cre+) mice. Ptpmt1flox/flox/ER-Cre+ and Ptpmt1+/+/ER-Cre+ ES cells were generated as described above. Ex vivo deletion of Ptpmt1 from Ptpmt1flox/flox/ER-Cre+ ES cells was achieved by treating the cells with 4-hydroxytamoxifen (4-OHT) (1 μM) (Fig. 4A). The proliferation of 4-OHT-treated Ptpmt1flox/flox/ER-Cre+ ES cells was decreased compared to that of dimethyl sulfoxide (DMSO)-treated Ptpmt1flox/flox/ER-Cre+ or 4-OHT- or DMSO-treated Ptpmt1+/+/ER-Cre+ ES cells (Fig. 4B). Consistent with this observation, Ptpmt1 deletion efficiency in the whole population of 4-OHT-treated Ptpmt1flox/flox/ER-Cre+ cells dropped over time during in vitro culture because of the growth disadvantage of Ptpmt1-depleted cells and because these mutant cells were outcompeted by nondepleted cells (Fig. 4C). Interestingly, no differences in cell survival between 4-OHT-treated Ptpmt1flox/flox/ER-Cre+ and Ptpmt1+/+/ER-Cre+ ES cells were observed (Fig. 4D), suggesting that Ptpmt1 ablation does not impact the mitochondrion-mediated apoptosis apparatus. This notion is further supported by the observation that the mitochondrial membrane potential of Ptpmt1-depleteted ES cells was not decreased as normally seen in apoptotic cells (Fig. 4E). We next assessed the impact of Ptpmt1 deficiency on the differentiation capabilities of ES cells by inducing ES cells to differentiate into embryoid bodies (EB) in LIF-free methylcellulose medium. Compared to those of control cells, the abilities of Ptpmt1-depleted ES cells to generate EBs were essentially blocked (Fig. 5A). Real-time PCR quantification of endodermal (GATA4 and GATA6), mesodermal (brachyury and Mef2c), and ectododermal (Fgf5 and nestin) markers confirmed that the differentiation of Ptpmt1 knockout ES cells in liquid culture was also substantially decreased (Fig. 5B). The decreased growth and loss of differentiation capabilities of Ptpmt1-depleted ES cells appear to be associated with cell cycle defects, as cyclin-dependent kinase inhibitors p21, p27, and p19 were markedly upregulated in Ptpmt1 knockout cells (Fig. 5C). Although the cell cycle distribution of Ptpmt1-depleted ES cells was not significantly disturbed (Fig. 5D) due to the lack of G1/S arrest in ES cells, the cell population doubling time was increased from 14.90 ± 0.98 (mean ± standard deviation) to 23.65 ± 0.49 h (P = 0.008 by Student t test) following Ptpmt1 depletion.
Fig. 4.
Ptpmt1 ablation decreases cell growth in conditional knockout ES cells without affecting cell survival. (A) E3.5 blastocysts produced from the intercrosses of Ptpmt1flox/+/ER-Cre+ and Ptpmt1flox/+ mice were used to generate ES cells by following standard procedures. Ptpmt1 deletion from Ptpmt1flox/flox/ER-Cre+ ES cells was induced by 4-OHT (1 μM) treatment. (B) Ptpmt1+/+/ER-Cre+ and Ptpmt1flox/flox/ER-Cre+ ES cells were treated with 4-OHT or DMSO for 96 h. Cell growth rates were then determined by the MTS [3-(4,5-dimethylthiazol-2-yl)-5-(3-carboxymethoxyphenyl)-2-(4-sulfophenyl)-2H-tetrazolium, inner salt] assay. Three experiments were performed, with three independent cell pools for each group. Representative results from one experiment are shown. (C) Ptpmt1+/+/ER-Cre+ and Ptpmt1flox/flox/ER-Cre+ ES cells were treated with 4-OHT or DMSO and then cultured for the indicated periods of time. Ptpmt1 deletion efficiency in the whole-cell population was determined by real-time PCR quantification of Ptpmt1 mRNA levels. (D) Ptpmt1+/+/ER-Cre+ and Ptpmt1flox/flox/ER-Cre+ ES cells were treated with 4-OHT or DMSO for 96 h and then cultured in regular ES cell medium for 48 h. Apoptotic cells were assessed as described in Materials and Methods. Representative results from three independent experiments are shown. (E) Ptpmt1flox/flox/ER-Cre+ ES cells were treated with 4-OHT or DMSO for 96 h and then cultured for 48 h. The cells were loaded with the rhodamine-based dye tetramethylrhodamine, ethyl ester (TMRE) (1 mM). Mitochondrial membrane potential was determined by assessing mean fluorescence intensity in the cells using flow cytometry. Experiments were repeated three times. Similar results were obtained.
Fig. 5.
Ptpmt1 ablation blocks differentiation capabilities in conditional knockout ES cells, and both catalytic activity and mitochondrial localization are required for Ptpmt1 function in ES cell differentiation. (A) Ptpmt1+/+/ER-Cre+ and Ptpmt1flox/flox/ER-Cre+ ES cells were treated with 4-OHT or DMSO for 96 h and then induced to differentiate into EBs in methylcellulose-Iscove's modified Dulbecco's medium (IMDM) without LIF as previously described (33, 34). After 10 days, resultant EBs were counted under a dissecting microscope. Representative results from three independent experiments are shown. (B) Ptpmt1flox/flox/ER-Cre+ ES cells were treated with 4-OHT or DMSO and induced to differentiate in IMDM without LIF for the indicated periods of time. Resulting cells were harvested and assayed by real-time PCR to determine expression levels of GATA4, GATA6, brachyury, Mef2c, Fgf5, and nestin. Experiments were repeated twice. Similar results were obtained. Representative results from one experiment are shown. (C) Ptpmt1flox/flox/ER-Cre+ ES cells were treated with 4-OHT or DMSO as described above. mRNA levels of the indicated cell cycle regulatory genes were determined by real-time PCR. Representative results from one experiment intriplicate are shown. (D) Ptpmt1flox/flox/ER-Cre+ ES cells were treated with 4-OHT or DMSO as described above. The cells were loaded with 5-bromodeoxyuridine (BrdU; 10 μM) for 30 min, harvested, and fixed with cold 70% ethanol overnight. The cells were then washed with PBS, treated with HCl (2 N), stained with anti-BrdU antibody, and finally resuspended in PBS containing 50 μg/ml propidium iodide (PI). Cell cycle distribution was determined by FACS analyses according to BrdU- and PI-staining profiles. Results shown are means ± standard deviations of three independent experiments. (E) Flag-tagged WT Ptpmt1, catalytically deficient Ptpmt1 C132S, truncated Ptpmt1 (Ptpmt1 Δ37) lacking the mitochondrial localization signal (amino acids 1 to 37), and vector control were transduced into Ptpmt1flox/flox/ER-Cre+ ES cells through retrovirus-mediated gene transfer. Transduced cells were sorted by FACS based on the expression of the GFP marker contained in the retroviral vector MSCV-IRES-GFP (MSCV, murine stem cell virus; IRES, internal ribosome entry site). Sorted cells were expanded for reverse transcription-PCR analyses for expression levels of Ptpmt1 and mutants. (F) WT Ptpmt1, Ptpmt1 C132S, Ptpmt1 Δ37, and vector control were transduced into Ptpmt1flox/flox/ER-Cre+ ES cells, and the cells treated with 4-OHT or DMSO for 96 h. These cells were then induced to differentiate into EBs as described for panel A. After 10 days, resultant EBs were counted under a dissecting microscope and normalized according to the Ptpmt1 deletion efficiency of each line. Experiments were repeated three times with similar results. Representative results from one experiment are shown.
Both catalytic activity and mitochondrial localization are required for Ptpmt1 function in ES cells.
Ptpmt1 is a phosphatase that is exclusively localized to the mitochondria (31). To further elucidate the structural bases for the critical role of Ptpmt1 in ES cells, we performed structure-function analyses. WT Ptpmt1, mutant Ptpmt1 with a C132S mutation that abolishes catalytic activity, and truncated Ptpmt1 lacking the mitochondrial localization signal (amino acids 1 to 37) (Ptpmt1 Δ37) were transduced into Ptpmt1flox/flox/ER-Cre+ ES cells (without 4-OHT treatment) through retrovirus-mediated gene transfer. Transduced cells were sorted by fluorescence-activated cell sorting (FACS) (Fig. 5E). Sorted WT Ptpmt1-, Ptpmt1 C132S-, Ptpmt1 Δ37-, and vector control-transduced Ptpmt1flox/flox/ER-Cre+ ES cells were then assayed for apoptosis and differentiation potential following 4-OHT or DMSO treatments. No significant changes in cell survival before and after 4-OHT treatments were detected among all the cell lines (data not shown). Without deletion of endogenous Ptpmt1 (DMSO-treated cells), the expression of WT Ptpmt1 did not affect ES cell differentiation, whereas overexpression of Ptpmt1 C132S or Ptpmt1 Δ37 significantly decreased EB formation capabilities (Fig. 5F, solid bars). Following deletion of endogenous Ptpmt1 by 4-OHT treatment, the differentiation of vector control-transduced Ptpmt1flox/flox/ER-Cre+ ES cells was blocked (Fig. 5F, shaded bars), consistent with the results shown in Fig. 5A. Reintroduction of WT Ptpmt1 into Ptpmt1 knockout ES cells largely restored the EB-forming capabilities (Fig. 5F, shaded bars), reaffirming the cell-autonomous effects of Ptpmt1 deficiency on ES cell differentiation. In contrast, the introduction of either Ptpmt1 C132S or Ptpmt1 Δ37 did not show rescue effects (Fig. 5F, shaded bars), verifying that both catalytic activity and mitochondrial localization are required for Ptpmt1 function in ES cell differentiation.
Aerobic metabolism is decreased whereas glycolysis is enhanced in Ptpmt1-ablated cells.
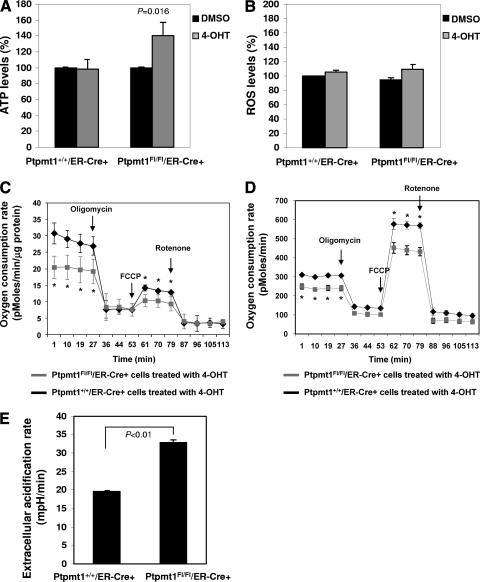
We next asked how Ptpmt1 deficiency impaired ES cell function. We first examined mitochondrial structures by transmission electron microscopy. Mitochondrial fragmentation in 4-OHT-treated Ptpmt1flox/flox/ER-Cre+ ES cells was increased; however, ultrastructures of mitochondria appeared relatively normal (data not shown). Ptpmt1 is localized to the mitochondrial inner membrane where oxidative phosphorylation and ATP synthesis take place. We next assessed energy production in Ptpmt1 knockout ES cells. ATP levels in Ptpmt1-depleted ES cells (Ptpmt1 deletion efficiency was 80 to 85%) were increased by 40% (Fig. 6A). ROS levels in Ptpmt1-depleted cells, however, were not significantly changed (Fig. 6B). As the mitochondrion is the primary cellular respiratory organelle, we then determined mitochondrial function in Ptpmt1 knockout cells by real-time measurement of oxygen consumption in intact live cells. The results showed that Ptpmt1-ablated ES cells had significantly decreased basal oxygen consumption (Fig. 6C). As the addition of the mitochondrial inhibitor oligomycin resulted in a similar and nearly complete reduction in oxygen consumption in WT and Ptpmt1 mutant cells, the oxygen consumption in both cell types under resting conditions appears to be derived almost exclusively from mitochondrial cytochrome chain activity. Similarly, basal aerobic metabolism in Ptpmt1-depleted mouse embryonic fibroblasts (MEFs) (Ptpmt1 deletion efficiency was nearly complete) was also markedly decreased (Fig. 6D). To measure maximal oxygen consumption, we treated the cells with the mitochondrial uncoupling reagent carbonylcyanide-4-trifluorometh-oxyphenylhydrazone (FCCP). Under the maximally uncoupled conditions, the difference in oxygen consumption between WT and knockout ES cells remained (Fig. 6C), and in MEFs, this difference was even larger (Fig. 6D). Subsequent treatment with the respiratory chain inhibitor rotenone abolished oxygen consumption to basal levels in both WT and Ptpmt1-depleted cells, confirming that the oxygen consumption following FCCP treatment reflects maximal reserve oxygen consumption capacity. Since total cellular ATP levels were well maintained in Ptpmt1 knockout cells (Fig. 6A), we reasoned that alternative ATP-generating pathways might be enhanced. One major alternative pathway is aerobic glycolysis, with the ATP-generating step deriving from the cytosolic conversion of pyruvate to lactate. Measurement of extracellular proton flux indeed revealed that Ptpmt1-depleted MEFs had significantly increased extracellular acidification rates (Fig. 6E), consistent with these cells exhibiting an enhanced rate of glycolysis.
Fig. 6.
Aerobic metabolism is decreased in Ptpmt1-ablated cells. (A) 4-OHT- or DMSO-treated Ptpmt1+/+/ER-Cre+ and Ptpmt1flox/flox/ER-Cre+ ES cells were assayed for total cellular ATP levels as described in Materials and Methods. Experiments were performed with three independent cell pools for each group. Results shown are means ± standard deviations of three independent experiments. (B) ROS levels in 4-OHT or DMSO-treated Ptpmt1+/+/ER-Cre+ and Ptpmt1flox/flox/ER-Cre+ ES cells were determined as described in Materials and Methods. Experiments were performed with 3 cell pools for each group. Results shown are means ± standard deviations. (C) Oxygen consumption rates of intact 4-OHT-treated Ptpmt1+/+/ER-Cre+ and Ptpmt1flox/flox/ER-Cre+ ES cells were measured following the addition of mitochondrial inhibitor (oligomycin, 5 μM), uncoupling agent (FCCP, 1 μM), and respiratory chain inhibitor (rotenone, 5 μM) as described in Materials and Methods. Experiments were performed with 3 cell pools for each group. Results shown are means ± standard deviations. (D, E) Oxygen consumption (D) and glycolytic activities (E) of intact 4-OHT-treated Ptpmt1+/+/ER-Cre+ and Ptpmt1flox/flox/ER-Cre+ MEFs were measured following the addition of mitochondrial inhibitor (oligomycin, 1 μM), uncoupling agent (FCCP, 300 nM), and respiratory chain inhibitor (rotenone, 600 nM). (E) Baseline extracellular acidification rates are shown. Experiments were performed with three independent cell pools for each group. Representative results from one pair of cell pools are shown.
Compromised mitochondrial dynamics and mitochondrial fusion defects in Ptpmt1-depleted cells.
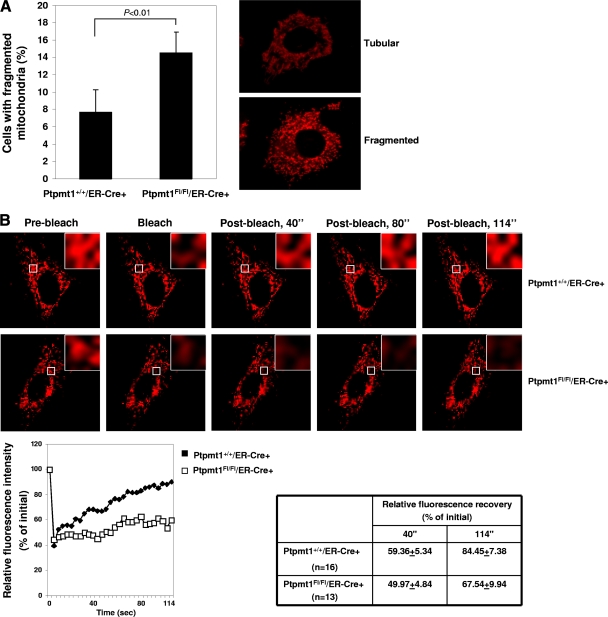
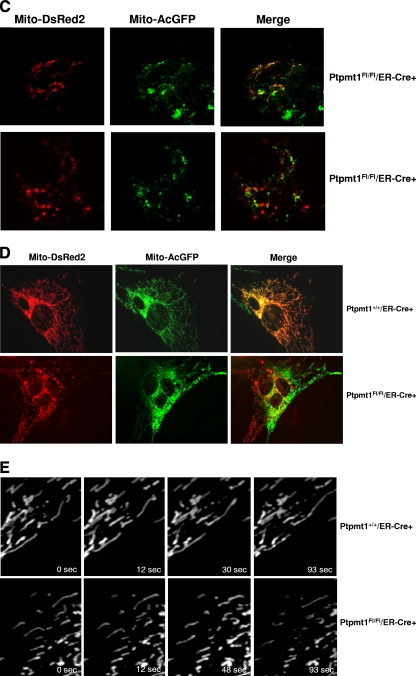
To understand further the impact of Ptpmt1 ablation on mitochondrial function, we analyzed mitochondrial morphology in Ptpmt1 knockout ES cells and MEFs. The results showed that fragmented mitochondria were increased in Ptpmt1-deficient ES cells (data not shown) and MEFs (Fig. 7A). Mitochondrial fragmentation is known to be associated with defects in mitochondrial fusion (1, 5, 17). To test whether mitochondrial fusion is affected in the absence of Ptpmt1, we first made use of a widely used approach, i.e., mitochondrial photobleaching time-lapse confocal microscopic analysis (14, 25, 44), to examine mitochondrial dynamics using MEF cell models. As shown in Fig. 7B, fluorescence intensity in the bleached areas in WT cells was quickly recovered after photobleaching due to mitochondrial fusion. In contrast, this mitochondrial fusion-associated fluorescence recovery was significantly delayed in Ptpmt1 knockout cells. Moreover, during the 114-s monitoring time period, 38% (8/21) of Ptpmt1-deficient cells failed to show fluorescence recovery after photobleaching whereas only 20% (4/20) of control cells did. This fluorescence recovery assessment suggests that mitochondrial fusion is compromised in the cells lacking Ptpmt1. To confirm this result, we differentially marked mitochondria in ES cells and MEFs by transfection of Mito-DsRed2 (red) and Mito-AcGFP (green) plasmids. Two parental cell lines were fused with polyethylene glycol 1500. Fused-cell hybrids were examined under a fluorescence microscope. As illustrated in Fig. 7C, mitochondria in control ES cell hybrids underwent pronounced fusion, as evidenced by the merged orange fluorescence in fused mitochondria. Only 18.7% (6/32) of control cell hybrids did not show mitochondrial fusion. In contrast, 42.5% of Ptpmt1-depleted cell hybrids showed no mitochondrial fusion. Consistent with these results, only 7% (2/30) of control MEF cell hybrids did not show mitochondrial fusion whereas 28% (9/32) of Ptpmt1-depleted MEF hybrids showed no mitochondrial fusion (Fig. 7D). Furthermore, we labeled mitochondria with Mito-DsRed and directly monitored mitochondria in live MEF cells using time-lapse microscopic analyses. In control cells, mitochondria were highly dynamic, and fusion or fission events were frequently observed during the 5 min of recording. However, in Ptpmt1-depleted cells, mitochondria underwent fusion events much less frequently, although a few fission events could be found (Fig. 7E). These morphological data together clearly suggest that Ptpmt1 is required for optimal mitochondrial dynamics. Intriguingly, despite multiple defects in mitochondria, MEFs tolerated Ptpmt1 depletion well. Compared to Ptpmt1 knockout ES cells, MEFs lacking Ptpmt1 exhibited no phenotypes. Their survival and growth were not disturbed (data not shown).
Fig. 7.
Decreased mitochondrial fusion and compromised mitochondrial dynamics in Ptpmt1-depleted cells. (A) Primary Ptpmt1+/+/ER-Cre+ and Ptpmt1flox/flox/ER-Cre+ MEFs at passage 3 or 4 were treated with 4-OHT for 48 h and then transfected with Mito-DsRed2 plasmid to label mitochondria. Forty-eight hours later, mitochondrial morphology in transfected cells (at least 100 cells were counted for each group) was examined under a fluorescence microscope. Normal mitochondria showed long thread-like tubular structures, whereas fragmented mitochondria were punctate and sometimes rounded. The percentage of cells with fragmented mitochondria was determined. Representative tubular and fragmented mitochondria are shown in the right panel. Experiments were performed three times. Results shown are means ± standard deviations. (B) Ptpmt1+/+/ER-Cre+ and Ptpmt1flox/flox/ER-Cre+ MEFs were treated with 4-OHT and then transfected with Mito-DsRed2. Fluorescence recovery after photobleaching analyses were carried out as described in Materials and Methods. Time-lapse images were captured using a Zeiss LSM 510 confocal microscope with intervals of 2 s. Regions of interest are indicated with white squares. Cells that failed to show fluorescence recovery after photobleaching were counted. In addition, in the successfully recovered cells, fluorescence recovery efficiencies 40 and 114 s after photobleaching were determined. The relative fluorescence intensity of Mito-DsRed2 recorded during a photobleaching protocol was plotted over time. Experiments were performed two times using different clones, and similar results were obtained in each. (C and D) 4-OHT-treated Ptpmt1+/+/ER-Cre+ and Ptpmt1flox/flox/ER-Cre+ ES cells (C) or MEFs (D) were separately transfected with Mito-DsRed2 and Mito-AcGFP plasmids to label mitochondria in red and green fluorescence, respectively. Cell lines of the same genotype that express Mito-DsRed2 or Mito-AcGFP were fused using polyethylene glycol 1500. Images of the cells were captured using a fluorescence microscope. Representative pictures are shown. Summarized data are described in the text. (E) Ptpmt1+/+/ER-Cre+ and Ptpmt1flox/flox/ER-Cre+ MEFs treated with 4-OHT were transfected with Mito-DsRed2. Transfected cells were monitored using a Leica DMI600B inverted microscope equipped with an environmental control chamber. Images were taken every 3 s for 5 min with a Retiga EXI 12-bit camera and analyzed with MetaMorph software. Representative pictures are shown.
Defective mitochondrial dynamics in Ptpmt1-depleted cells are attributable to the accumulation of PIP substrates in the mitochondria.
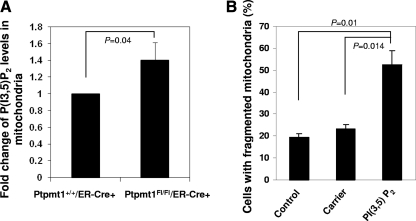
Ptpmt1 dephosphorylates multiple PIPs, especially PI(3,5)P2 (Fig. 1D), a recently identified phosphatidylinositol bisphosphate (PIP2) isomer whose subcellular localization and function in mammalian cells have not been well characterized (8, 23). To test whether the defective mitochondrial dynamics in Ptpmt1-ablated cells are associated with decreased dephosphorylation of PIP substrates, we first assessed PI(3,5)P2 levels in the mitochondria in these cells. 4-OHT-treated Ptpmt1flox/flox/ER-Cre+ and Ptpmt1+/+/ER-Cre+ MEFs were transfected with Mito-DsRed2 to label mitochondria, immunostained with anti-PI(3,5)P2 antibody, and analyzed by laser scanning cytometry (24, 28). As shown in Fig. 8A, PI(3,5)P2 determined by green fluorescence intensity in the Mito-DsRed2-labeled areas in Ptpmt1-depleted cells was increased compared to that in WT counterparts, confirming excessive PI(3,5)P2 in Ptpmt1-deficient mitochondria. We then tested for direct effect of overloading of PI(3,5)P2 on mitochondrial dynamics by dialyzing WT MEFs with PI(3,5)P2. The results showed that perfusion of PI(3,5)P2 in WT cells caused significant mitochondrial fragmentation (Fig. 8B), recapitulating the mitochondrial defects in Ptpmt1-depleted cells (Fig. 7A). Moreover, overloading of PI(3,5)P2 in WT ES cells significantly decreased basal mitochondrial oxygen consumption (data not shown). Although it is unclear whether other PIP substrates in Ptpmt1 knockout mitochondria are also accumulated and whether this may also contribute to the overall cell phenotypes, the PI(3,5)P2 data explain at least in part the underlying mechanism of the effects of Ptpmt1 deficiency, i.e., the defective mitochondrial networks and aerobic metabolism in Ptpmt1-depleted cells are attributable to the elevated levels of PIP substrates in the mitochondria, most likely in the inner membrane since Ptpmt1 is localized there (31).
Fig. 8.
PI(3,5)P2 is accumulated in the mitochondria in Ptpmt1-depleted cells, and overloading of PI(3,5)P2 results in defective mitochondrial dynamics. (A) 4-OHT-treated Ptpmt1+/+/ER-Cre+ and Ptpmt1flox/flox/ER-Cre+ MEFs were transfected with Mito-DsRed2 and then immunostained with anti-PI(3,5)P2 antibody. PI(3,5)P2 was visualized using Alexa Fluor 488-conjugated anti-mouse secondary antibody. Green fluorescence intensity in Mito-DsRed2-positive areas in Ptpmt1flox/flox/ER-Cre+ cells (n = 137) was quantified and normalized against that in the Ptpmt1+/+/ER-Cre+ control (n = 131) using laser scanning cytometric analyses. Results shown are means ± standard deviations of three independent experiments. (B) PI(3,5)P2 (di-C16) (1 μM) was delivered (shuttled) into Ptpmt1+/+/ER-Cre+ MEFs using Shuttle PIP kits following the protocol provided by the manufacturer (Echelon Biosciences, Inc.). Carrier 2 was used to deliver PI(3,5)P2. Cells were stained with Mitotracker Red 4 h later. The percentage of the cells with fragmented mitochondria was determined. Representative results of one experiment (average of three different fields, and 200 cells were counted for each field) are shown. Experiments were repeated using two different cell clones, and similar results were obtained.
DISCUSSION
Mitochondria regulate cell function through multiple mechanisms, such as energy production, metabolism, and apoptosis. Deficiency in mitochondrial Ptpmt1 does not cause developmental arrest and subsequent embryonic lethality by directly inducing cell apoptosis, because Ptpmt1−/− embryos at the blastocyst stage were morphologically indistinguishable from WT littermates and no increase in apoptosis was observed (Fig. 3A). Moreover, acute deletion of Ptpmt1 from conditional knockout ES cells or MEFs did not appreciably alter cell survival (Fig. 4D), and mitochondrial membrane potential in Ptpmt1-depleted cells was not decreased (Fig. 4E). Ptpmt1 appears to facilitate embryogenesis by maintaining mitochondrial aerobic metabolism and dynamics in ES cells, as the resting levels and maximal capacities of oxygen consumption of Ptpmt1 knockout cells were decreased (Fig. 6C and D). Furthermore, mitochondrial fusion and dynamics in Ptpmt1-deficient cells were compromised (Fig. 7).
It appears that ablation of Ptpmt1 causes mitochondrial dysfunction by disrupting PIP homeostasis in the mitochondrial membrane. Ptpmt1 is localized to the inner membrane (31). It favors PIPs as substrates (Fig. 1D). PIPs are a class of membrane phospholipids that regulate many important cellular processes, including membrane trafficking, ion channel and transporter functions, and cell division (3, 12, 15). PI(3,5)P2, the apparently favored PIP substrate of Ptpmt1 (Fig. 1D), is a recently identified phosphatidylinositol bisphosphate (PIP2) isomer whose subcellular localization and function in mammalian cells have not been well characterized (8, 23). In this report, we show that PI(3,5)P2 is also enriched within the mitochondria (Fig. 1E) and that tight control of the levels of PI(3,5)P2 in the mitochondrial inner membrane is important for the morphological networks and function of this organelle. Ptpmt1 depletion from ES cells decreased cell growth (Fig. 4B), and the differentiation of Ptpmt1-depleted ES cells was blocked (Fig. 5A). Moreover, only WT Ptpmt1 and not Ptpmt1 C132S or truncated Ptpmt1 lacking mitochondrial localization could rescue the differentiation potential of Ptpmt1 knockout ES cells (Fig. 5F). These results clearly suggest that Ptpmt1 functions in a catalytically dependent manner and that mitochondrial localization is required for its function. Thus, it seems that the accumulation of PIP substrates, such as PI(3,5)P2 (Fig. 8A), in the inner membrane as a result of Ptpmt1 deficiency disturbs the proper membrane trafficking necessary for mitochondrial fusion, leading to compromised mitochondrial dynamics and increased mitochondrial fragmentation. In support of this notion, overloading of PI(3,5)P2 in WT cells generated mitochondrial phenotypes similar to those of Ptpmt1-depleted cells (Fig. 8B). As coordinated mitochondrial dynamics are vital for mitochondrial metabolism (5, 29, 40), it is possible that the compromised mitochondrial metabolism in Ptpmt1 knockout cells is associated with defective dynamics. Alternatively, as many regulatory proteins important for mitochondrial ion homeostasis and mitochondrial metabolism, such as ion channels/transporters, reside in the mitochondrial inner membrane, the accumulation of PIPs in the inner membrane might affect the functions of these proteins, disrupting ion homeostasis in the mitochondrial matrix or the electrochemical gradient across the inner membrane, which would consequently alter mitochondrial metabolism.
Another interesting finding that we would like to highlight is that the role of Ptpmt1 in cellular function is highly cell type specific. Although Ptpmt1 is expressed at similar levels in ES cells and MEFs (data not shown), it is much more important for ES cells than for differentiated MEFs. ES cells responded more dramatically than MEFs to the same mitochondrial dysfunction induced by Ptpmt1 deficiency. The proliferation of Ptpmt1-depleted ES cells was decreased (Fig. 4B), and the differentiation of these mutant ES cells was blocked (Fig. 5F). As the survival of Ptpmt1 knockout ES cells was not altered (Fig. 4D) and cellular ROS levels were not changed (Fig. 6B), the differentiation block of these cells is obviously not mediated by increased ROS or cell death. Rather, it appears that a cell-intrinsic checkpoint was activated and that that in turn stopped the cell differentiation program by cell cycle arrest. Indeed, cyclin-dependent kinase inhibitors were markedly upregulated (Fig. 5C) and the cell cycle in ES cells was significantly prolonged following Ptpmt1 depletion. In contrast, Ptpmt1-depleted MEFs exhibited no phenotypes. Their cellular functions were barely disturbed (data not shown). Moreover, dominant-negative effects of Ptpmt1 C132S in MEFs were undetectable (data not shown), while the overexpression of this catalytically deficient Ptpmt1 mutant in ES cells significantly decreased cell differentiation capabilities (Fig. 5F). The cell type-dependent nature of these effects of Ptpmt1 deficiency indicates that the mitochondrial stress-induced cell cycle checkpoint is activated only in pluripotent stem cells, but not in differentiated fibroblasts. Consistent with this idea, no upregulation of cyclin-dependent kinase inhibitors was found in Ptpmt1-depleted MEFs (data not shown). Stem cells have a few mitochondria (20, 42). Unlike MEFs, whose cell division is accompanied with only duplication of mitochondria, when stem cells differentiate into progeny cells with dramatically increased mitochondrial mass, robust mitochondrial biogenesis/replication is required. If this suddenly rising need cannot be met due to defective membrane trafficking and mitochondrial dynamics, as seen in Ptpmt1−/− ES cells, the stem cell differentiation process may be halted, leading to developmental arrest. More interestingly, mitochondrial metabolism and dynamics were only moderately perturbed in Ptpmt1−/− stem cells, while cellular consequences were remarkably profound, similar to the nuclear DNA damage and mitotic spindle assembly checkpoints in which a single double-strand DNA break or misalignment of a single chromosome causes complete cell cycle arrest (26, 35). It is thus likely that the mitochondrial stress induced by Ptpmt1 ablation must signal to a certain intracellular signaling cascade(s) to produce amplified cellular effects. Nevertheless, how the mitochondrial stress is sensed and signaled to the cell cycle regulatory machinery remains to be further determined.
ACKNOWLEDGMENTS
This work was supported by National Institutes of Health grants HL068212, DK092722, and HL095657 (to C.-K.Q.).
Footnotes
Published ahead of print on 10 October 2011.
ADDENDUM IN PROOF
During the processing of our paper, Jack Dixon and his group reported that PTPMT1 was essential for cardiolipin biosynthesis (Cell Metabolism, 13:690–700, 2011). Therefore, further studies are needed to determine whether the ES cell differentiation block caused by PTPMT1 deficiency is mediated by decreased cardiolipin levels in the mitochondria.
REFERENCES
- 1. Andrade-Navarro M. A., Sanchez-Pulido L., McBride H. M. 2009. Mitochondrial vesicles: an ancient process providing new links to peroxisomes. Curr. Opin. Cell Biol. 21:560–567 [DOI] [PubMed] [Google Scholar]
- 2. Balaban R. S., Nemoto S., Finkel T. 2005. Mitochondria, oxidants, and aging. Cell 120:483–495 [DOI] [PubMed] [Google Scholar]
- 3. Balla T. 2006. Phosphoinositide-derived messengers in endocrine signaling. J. Endocrinol. 188:135–153 [DOI] [PubMed] [Google Scholar]
- 4. Brown G. C. 1992. Control of respiration and ATP synthesis in mammalian mitochondria and cells. Biochem. J. 284(Pt. 1):1–13 [DOI] [PMC free article] [PubMed] [Google Scholar]
- 5. Chan D. C. 2006. Mitochondria: dynamic organelles in disease, aging, and development. Cell 125:1241–1252 [DOI] [PubMed] [Google Scholar]
- 6. Chen H., McCaffery J. M., Chan D. C. 2007. Mitochondrial fusion protects against neurodegeneration in the cerebellum. Cell 130:548–562 [DOI] [PubMed] [Google Scholar]
- 7. Chen H., et al. 2010. Mitochondrial fusion is required for mtDNA stability in skeletal muscle and tolerance of mtDNA mutations. Cell 141:280–289 [DOI] [PMC free article] [PubMed] [Google Scholar]
- 8. Di Paolo G., De Camilli P. 2006. Phosphoinositides in cell regulation and membrane dynamics. Nature 443:651–657 [DOI] [PubMed] [Google Scholar]
- 9. Evans M. J., Kaufman M. H. 1981. Establishment in culture of pluripotential cells from mouse embryos. Nature 292:154–156 [DOI] [PubMed] [Google Scholar]
- 10. Ferrick D. A., Neilson A., Beeson C. 2008. Advances in measuring cellular bioenergetics using extracellular flux. Drug Discov. Today. 13:268–274 [DOI] [PubMed] [Google Scholar]
- 11. Fischer B., Bavister B. D. 1993. Oxygen tension in the oviduct and uterus of rhesus monkeys, hamsters and rabbits. J. Reprod. Fertil. 99:673–679 [DOI] [PubMed] [Google Scholar]
- 12. Gamper N., Shapiro M. S. 2007. Regulation of ion transport proteins by membrane phosphoinositides. Nat. Rev. Neurosci. 8:921–934 [DOI] [PubMed] [Google Scholar]
- 13. Goodwin J. S., Kenworthy A. K. 2005. Photobleaching approaches to investigate diffusional mobility and trafficking of Ras in living cells. Methods 37:154–164 [DOI] [PubMed] [Google Scholar]
- 14. Hailey D. W., et al. 2010. Mitochondria supply membranes for autophagosome biogenesis during starvation. Cell 141:656–667 [DOI] [PMC free article] [PubMed] [Google Scholar]
- 15. Haucke V., Di Paolo G. 2007. Lipids and lipid modifications in the regulation of membrane traffic. Curr. Opin. Cell Biol. 19:426–435 [DOI] [PMC free article] [PubMed] [Google Scholar]
- 16. Huang H., Frohman M. A. 2009. Lipid signaling on the mitochondrial surface. Biochim. Biophys. Acta 1791:839–844 [DOI] [PMC free article] [PubMed] [Google Scholar]
- 17. Lackner L. L., Nunnari J. M. 2009. The molecular mechanism and cellular functions of mitochondrial division. Biochim. Biophys. Acta 1792:1138–1144 [DOI] [PMC free article] [PubMed] [Google Scholar]
- 18. Liu J., et al. 2009. Bmi1 regulates mitochondrial function and the DNA damage response pathway. Nature 459:387–392 [DOI] [PMC free article] [PubMed] [Google Scholar]
- 19. Liu P., Jenkins N. A., Copeland N. G. 2003. A highly efficient recombineering-based method for generating conditional knockout mutations. Genome Res. 13:476–484 [DOI] [PMC free article] [PubMed] [Google Scholar]
- 20. Lonergan T., Bavister B., Brenner C. 2007. Mitochondria in stem cells. Mitochondrion 7:289–296 [DOI] [PMC free article] [PubMed] [Google Scholar]
- 21. Lonergan T., Brenner C., Bavister B. 2006. Differentiation-related changes in mitochondrial properties as indicators of stem cell competence. J. Cell. Physiol. 208:149–153 [DOI] [PubMed] [Google Scholar]
- 22. Martin G. R. 1981. Isolation of a pluripotent cell line from early mouse embryos cultured in medium conditioned by teratocarcinoma stem cells. Proc. Natl. Acad. Sci. U. S. A. 78:7634–7638 [DOI] [PMC free article] [PubMed] [Google Scholar]
- 23. Michell R. H., Heath V. L., Lemmon M. A., Dove S. K. 2006. Phosphatidylinositol 3,5-bisphosphate: metabolism and cellular functions. Trends Biochem. Sci. 31:52–63 [DOI] [PubMed] [Google Scholar]
- 24. Min J., et al. 2007. Forward chemical genetic approach identifies new role for GAPDH in insulin signaling. Nat. Chem. Biol. 3:55–59 [DOI] [PubMed] [Google Scholar]
- 25. Mitra K., Lippincott-Schwartz J. 2010. Analysis of mitochondrial dynamics and functions using imaging approaches. Curr. Protoc. Cell Biol. Chapter 4:Unit 4.25.1-21. [DOI] [PMC free article] [PubMed] [Google Scholar]
- 26. Musacchio A., Salmon E. D. 2007. The spindle-assembly checkpoint in space and time. Nat. Rev. Mol. Cell Biol. 8:379–393 [DOI] [PubMed] [Google Scholar]
- 27. Myers M. P., et al. 1998. The lipid phosphatase activity of PTEN is critical for its tumor suppressor function. Proc. Natl. Acad. Sci. U. S. A. 95:13513–13518 [DOI] [PMC free article] [PubMed] [Google Scholar]
- 28. Niswender K. D., et al. 2003. Immunocytochemical detection of phosphatidylinositol 3-kinase activation by insulin and leptin. J. Histochem. Cytochem. 51:275–283 [DOI] [PubMed] [Google Scholar]
- 29. Okamoto K., Shaw J. M. 2005. Mitochondrial morphology and dynamics in yeast and multicellular eukaryotes. Annu. Rev. Genet. 39:503–536 [DOI] [PubMed] [Google Scholar]
- 30. Osman C., Voelker D. R., Langer T. 2011. Making heads or tails of phospholipids in mitochondria. J. Cell Biol. 192:7–16 [DOI] [PMC free article] [PubMed] [Google Scholar]
- 31. Pagliarini D. J., et al. 2005. Involvement of a mitochondrial phosphatase in the regulation of ATP production and insulin secretion in pancreatic beta cells. Mol. Cell 19:197–207 [DOI] [PubMed] [Google Scholar]
- 32. Pagliarini D. J., Worby C. A., Dixon J. E. 2004. A PTEN-like phosphatase with a novel substrate specificity. J. Biol. Chem. 279:38590–38596 [DOI] [PubMed] [Google Scholar]
- 33. Qu C. K., Feng G. S. 1998. Shp-2 has a positive regulatory role in ES cell differentiation and proliferation. Oncogene 17:433–439 [DOI] [PubMed] [Google Scholar]
- 34. Qu C. K., et al. 1997. A deletion mutation in the SH2-N domain of Shp-2 severely suppresses hematopoietic cell development. Mol. Cell. Biol. 17:5499–5507 [DOI] [PMC free article] [PubMed] [Google Scholar]
- 35. Reinhardt H. C., Yaffe M. B. 2009. Kinases that control the cell cycle in response to DNA damage: Chk1, Chk2, and MK2. Curr. Opin. Cell Biol. 21:245–255 [DOI] [PMC free article] [PubMed] [Google Scholar]
- 36. Schapira A. H. 2006. Mitochondrial disease. Lancet 368:70–82 [DOI] [PubMed] [Google Scholar]
- 37. Schieke S. M., et al. 2008. Mitochondrial metabolism modulates differentiation and teratoma formation capacity in mouse embryonic stem cells. J. Biol. Chem. 283:28506–28512 [DOI] [PMC free article] [PubMed] [Google Scholar]
- 38. Shen J., et al. 2009. Deficiency of MIP/MTMR14 phosphatase induces a muscle disorder by disrupting Ca(2+) homeostasis. Nat. Cell Biol. 11:769–776 [DOI] [PMC free article] [PubMed] [Google Scholar]
- 39. St. John J. C., et al. 2005. The expression of mitochondrial DNA transcription factors during early cardiomyocyte in vitro differentiation from human embryonic stem cells. Cloning Stem Cells 7:141–153 [DOI] [PubMed] [Google Scholar]
- 40. Suen D. F., Norris K. L., Youle R. J. 2008. Mitochondrial dynamics and apoptosis. Genes Dev. 22:1577–1590 [DOI] [PMC free article] [PubMed] [Google Scholar]
- 41. Thundathil J., Filion F., Smith L. C. 2005. Molecular control of mitochondrial function in preimplantation mouse embryos. Mol. Reprod. Dev. 71:405–413 [DOI] [PubMed] [Google Scholar]
- 42. Van Blerkom J. 2009. Mitochondria in early mammalian development. Semin. Cell Dev. Biol. 20:354–364 [DOI] [PubMed] [Google Scholar]
- 43. Wallace D. C., Fan W. 2009. The pathophysiology of mitochondrial disease as modeled in the mouse. Genes Dev. 23:1714–1736 [DOI] [PMC free article] [PubMed] [Google Scholar]
- 44. Wasiak S., Zunino R., McBride H. M. 2007. Bax/Bak promote sumoylation of DRP1 and its stable association with mitochondria during apoptotic cell death. J. Cell Biol. 177:439–450 [DOI] [PMC free article] [PubMed] [Google Scholar]
- 45. Yao J., et al. 2009. Mitochondrial bioenergetic deficit precedes Alzheimer's pathology in female mouse model of Alzheimer's disease. Proc. Natl. Acad. Sci. U. S. A. 106:14670–14675 [DOI] [PMC free article] [PubMed] [Google Scholar]


